


 |
| Gold V.1.3.1 signal Telegram Channel (English) |

WTI Crude Oil: Key Strait of Hormuz Shipping Boosts Volatility in Price Technical and Fundamental Analysis
2026-03-17 @ 06:03
Over the past 48 hours, WTI crude oil has experienced marked volatility, with the closing price on March 16 dropping sharply from $99 to $93.5, a decline of about 3.5%.
This market movement was driven by two key developments: firstly, some vessels transited the strategically critical Strait of Hormuz, easing immediate supply concerns and causing a roughly 3% dip in prices. Secondly, despite this maneuver, geopolitical tensions in the Middle East remain unresolved, keeping war risk premiums elevated and pushing oil prices above the $100 per barrel mark earlier this month. These opposing forces created a tug of war, causing WTI crude to fluctuate around high levels.
For an everyday investor, such shipping movements can be viewed like traffic updates on supply routes — when the path is clear, prices ease; when risks rise, fuel costs can surge like a gridlocked highway. The recent sharp swings underscore how geopolitical tensions in the region continue to be the primary driver of oil price fluctuations.
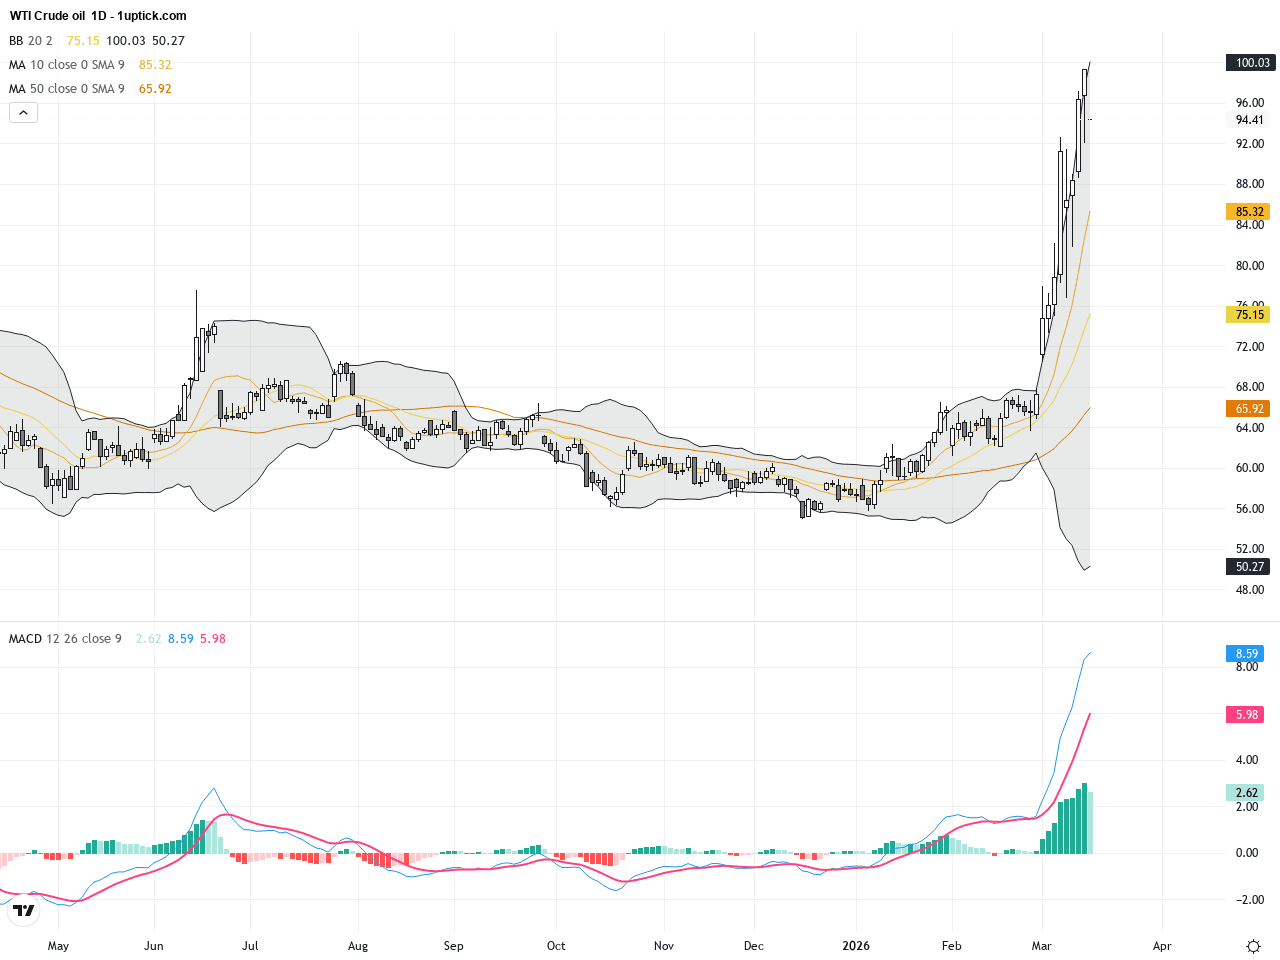
The WTI Crude Oil daily chart indicates large fluctuations since the start of the month, with a strong uptrend initially followed by a correction phase. Moving averages (20-day, 50-day, and 100-day) maintain a bullish alignment, but the price dipping below the 20-day moving average signals short-term bearish pressure. Bollinger Bands are expanding, reflecting increased volatility. The MACD exhibits a bearish crossover, suggesting potential downside in the near term. Overall, the trend shows consolidation and traders should be wary of potential support breaks.

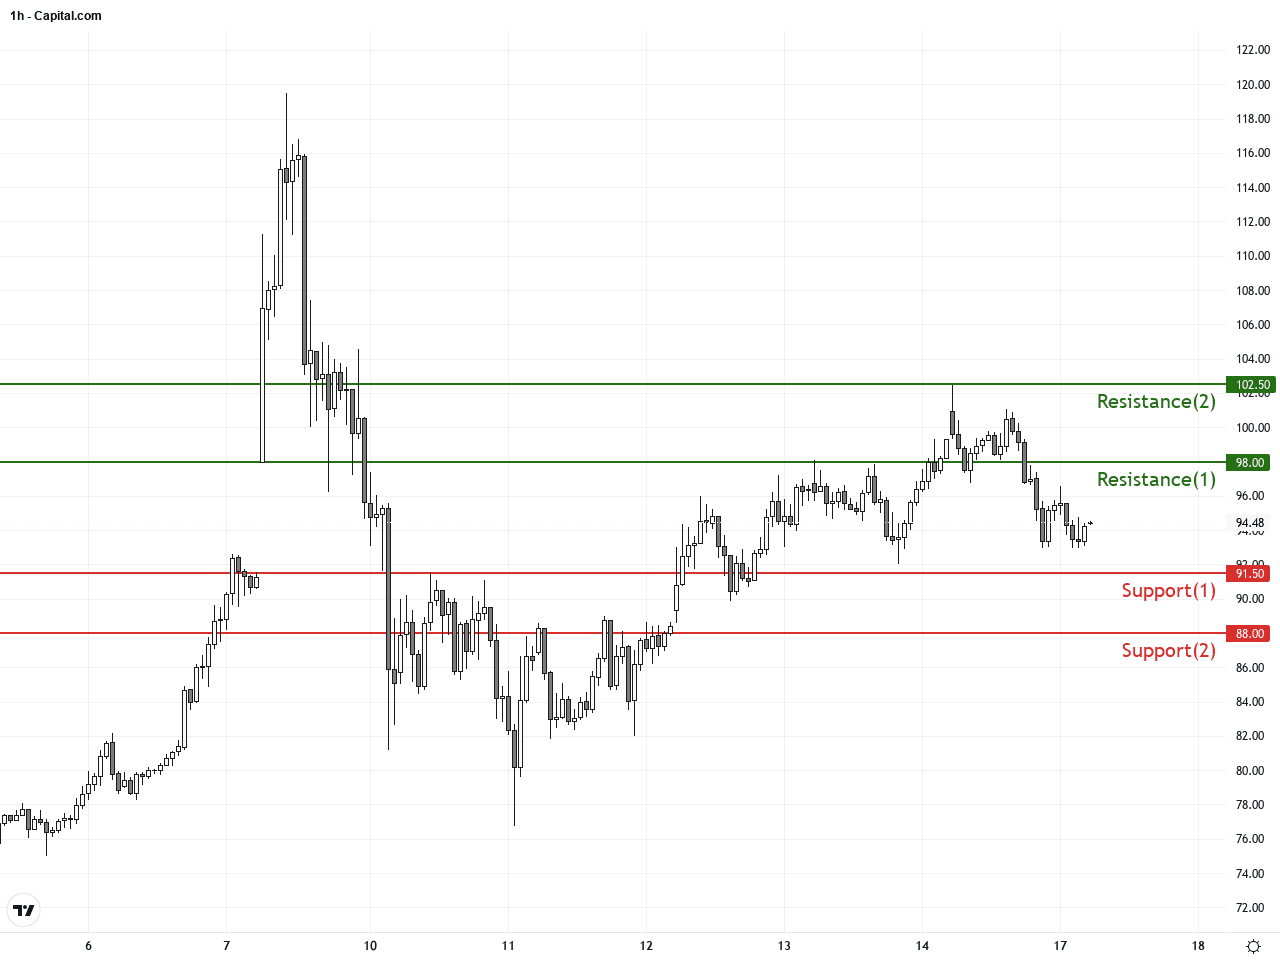
The hourly chart over the past five trading days shows a clear downward trend with price testing support levels multiple times before minor rebounds. The 20-hour and 50-hour moving averages have crossed bearishly, with the Bollinger Band middle line sloping downwards, signaling strong bearish momentum. The MACD histogram is negative and the recent formation of a bearish engulfing candlestick pattern indicates pressure to the downside in the short term, though positive news could trigger swift rebounds.
Technical Trend: WTI Crude Oil is presently in a ‘Cautiously Bearish’ trend, exhibiting heightened short-term volatility but retaining room for rallies based on market catalysts. Monitoring support and resistance flips is essential.
Key technical insights reveal WTI is currently in a cautious bearish phase. The MACD bearish crossover and bearish engulfing candlestick patterns on both daily and hourly charts are warning signs of possible further downside. A break below the support near $91.5 could accelerate selling pressure, while a positive catalyst could push prices to test resistance around $98. Traders are advised to set tight stop losses and consider range-bound or breakout trading strategies.Today’s economic calendar does not feature significant or direct events impacting WTI Crude Oil. Market participants should continue monitoring geopolitical developments and supply-demand dynamics, as these remain the primary drivers for crude prices.
Resistance & Support
The above financial market data, quotes, charts, statistics, exchange rates, news, research, analysis, buy or sell ratings, financial education, and other information are for reference only. Before making any trades based on this information, you should consult independent professional advice to verify pricing data or obtain more detailed market information. 1uptick.com should not be regarded as soliciting any subscriber or visitor to execute any trade. You are solely responsible for all of your own trading decisions.