


 |
| Gold V.1.3.1 signal Telegram Channel (English) |
WTI Crude Oil: Mid-East Conflict Fuels Volatility Near Key Resistance Levels
2026-04-29 @ 02:51
Over the past 24 to 48 hours, WTI crude oil prices have surged notably, closing at $96.37 on April 27, up from $95.3 the previous day. The market volatility was mainly driven by escalating conflict in Iran, which restricted shipments through the Strait of Hormuz and tightened supply conditions. Despite an approximate 44% jump recently, traders remain skeptical about hitting record highs soon, estimating only a 1% chance of reaching all-time highs by April 30.
Meanwhile, the U.S. has threatened sanctions against businesses dealing with sanctioned Iranian airlines, adding pressure through geopolitical risks that undermine Middle East oil export security and push global oil prices higher. With peace talks stalling, concerns over supply chain disruptions keep oil prices supported, prompting investors to closely monitor developments due to fears about the conflict’s impact on economic activity.
In simple terms, average investors can view the recent WTI crude price fluctuations as market reactions to increased geopolitical risk globally. The heightened volatility reflects rising concerns about oil supply uncertainty. This key market news highlights that international political developments remain the main factor driving oil prices, making it crucial to track negotiations and emerging situations to adjust investment strategies accordingly.

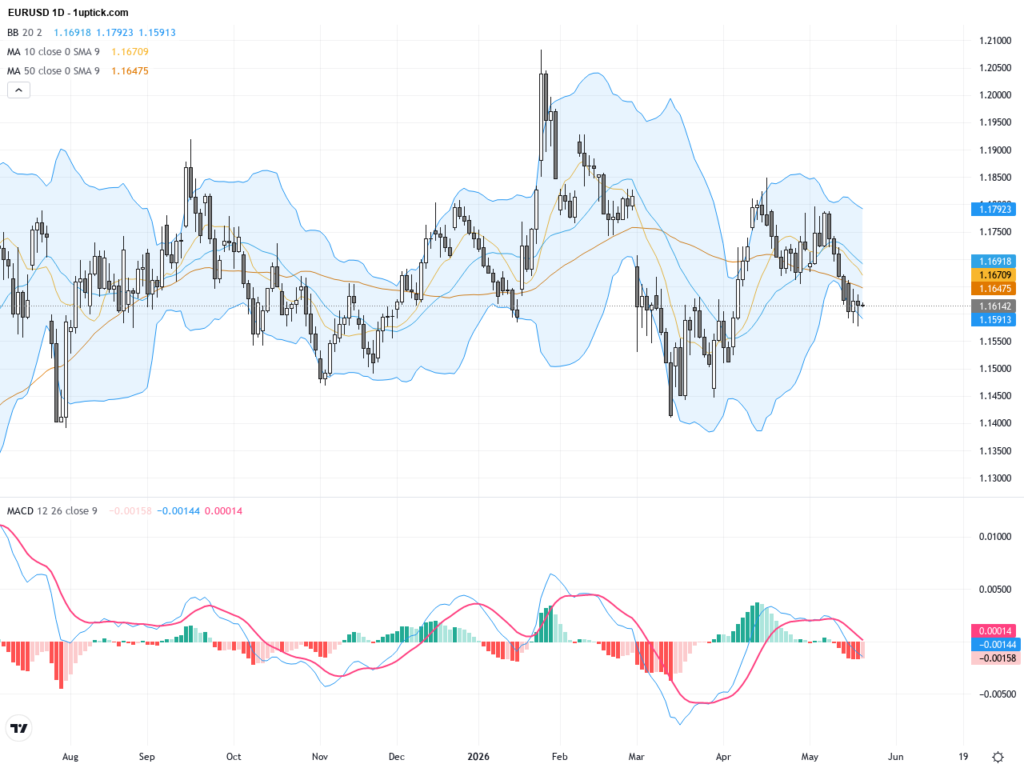
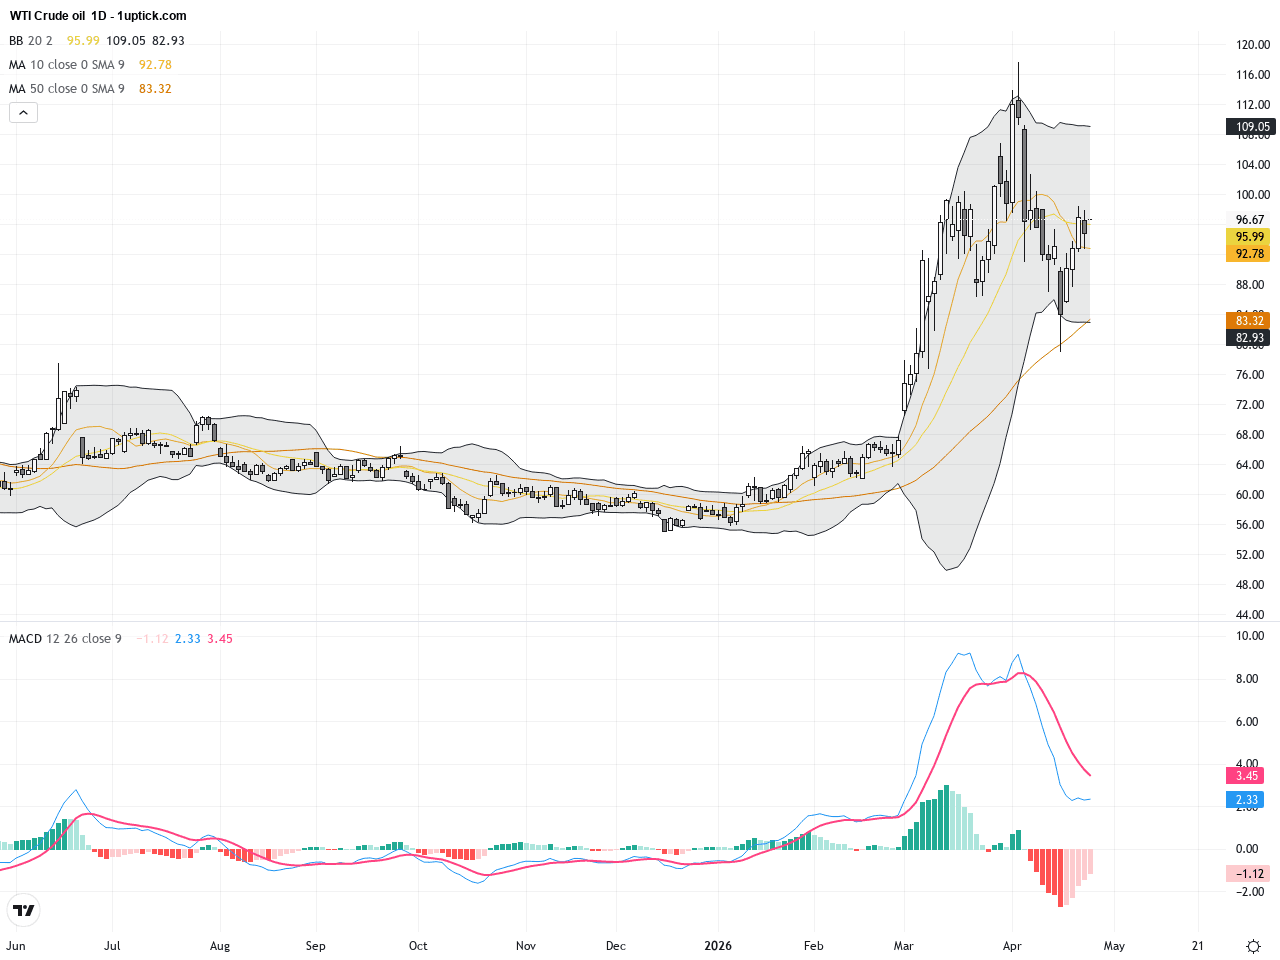
The daily chart shows WTI Crude Oil forming a steady uptrend since mid-April, breaking through the 95 USD mark with higher highs and higher lows. The 20-day moving average is curving upwards, with price mostly sustaining above it, indicating medium- to long-term bullish momentum. Bollinger Bands are widening, signaling increased volatility, while the MACD histogram above zero suggests strengthening momentum. The overall technical backdrop supports continued upside potential but a cautious watch on resistance levels is warranted.
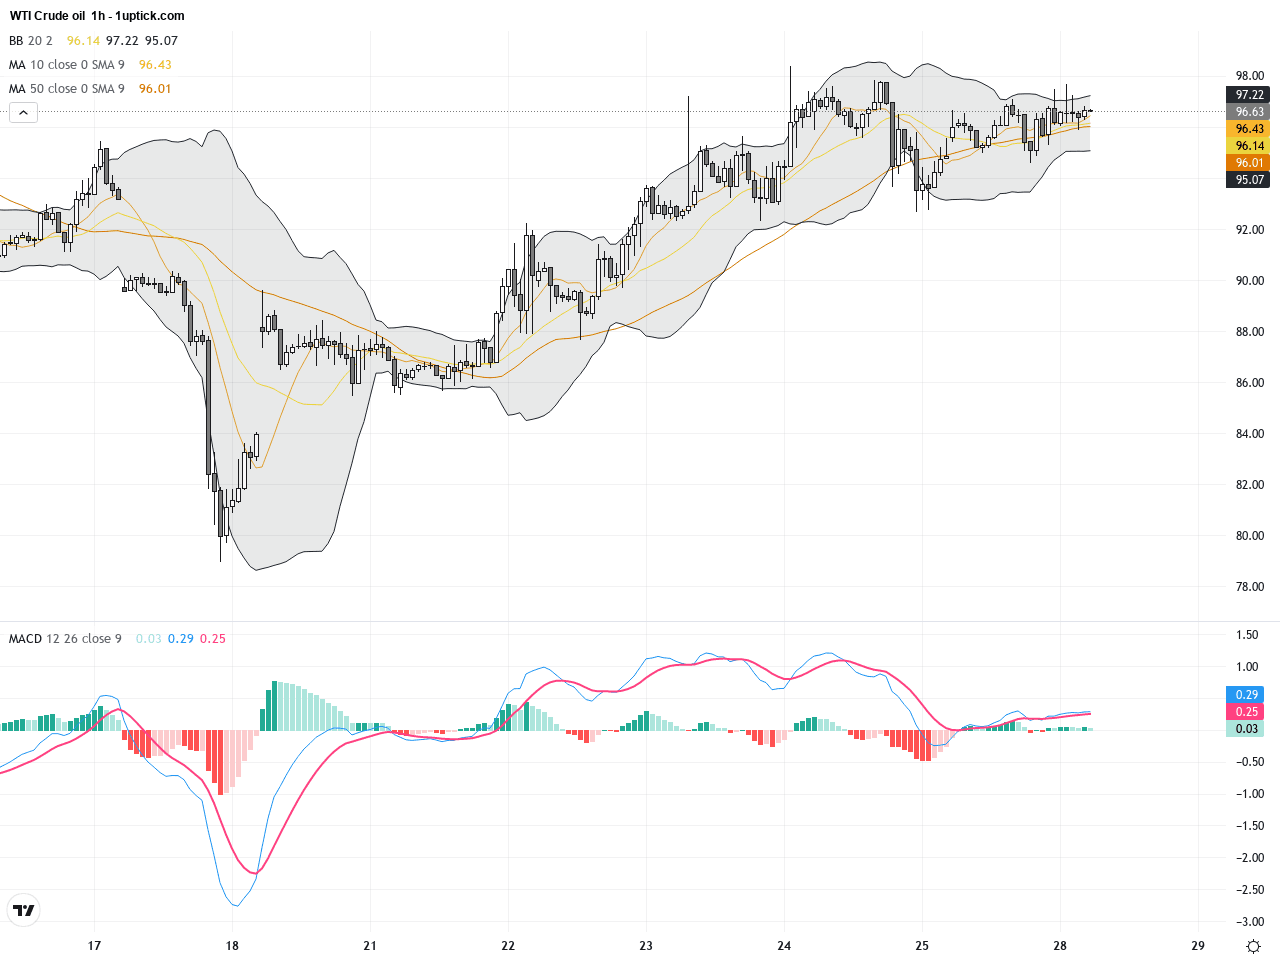
On the hourly timeframe covering the last 5 days, WTI price action is volatile, repeatedly testing the 97.5 USD resistance but failing to decisively break through. Price formed a small symmetrical triangle pattern with mixed short-term moving averages, though the 20-period MA offers minor support. Bollinger Bands contraction indicates a possible breakout soon. MACD lines recently crossed bullishly, signaling near-term buying interest. The recent bullish engulfing candle underscores strong short-term demand, yet failure at resistance could lead to a pullback near 95 USD support.
Technical Trend: WTI Crude Oil is currently exhibiting a ‘Volatile Bullish’ trend, showing strong buying momentum tempered by resistance hurdles, with the potential for both breakout continuation or short-term retracement.
Key technical insights include a bullish MACD expansion on the daily chart combined with a bullish crossover on the hourly chart, indicating momentum alignment across multiple timeframes. However, persistent resistance around 97.5 USD poses a challenge. A breakout above this level on strong volume could trigger a new leg higher, while failure may result in corrective pullbacks. Monitoring momentum indicators and volume will be crucial for timing entries or exits.There are no significant or directly relevant economic events scheduled today to impact WTI Crude Oil. Traders should continue monitoring geopolitical developments as these remain the primary driver for oil price movements currently.
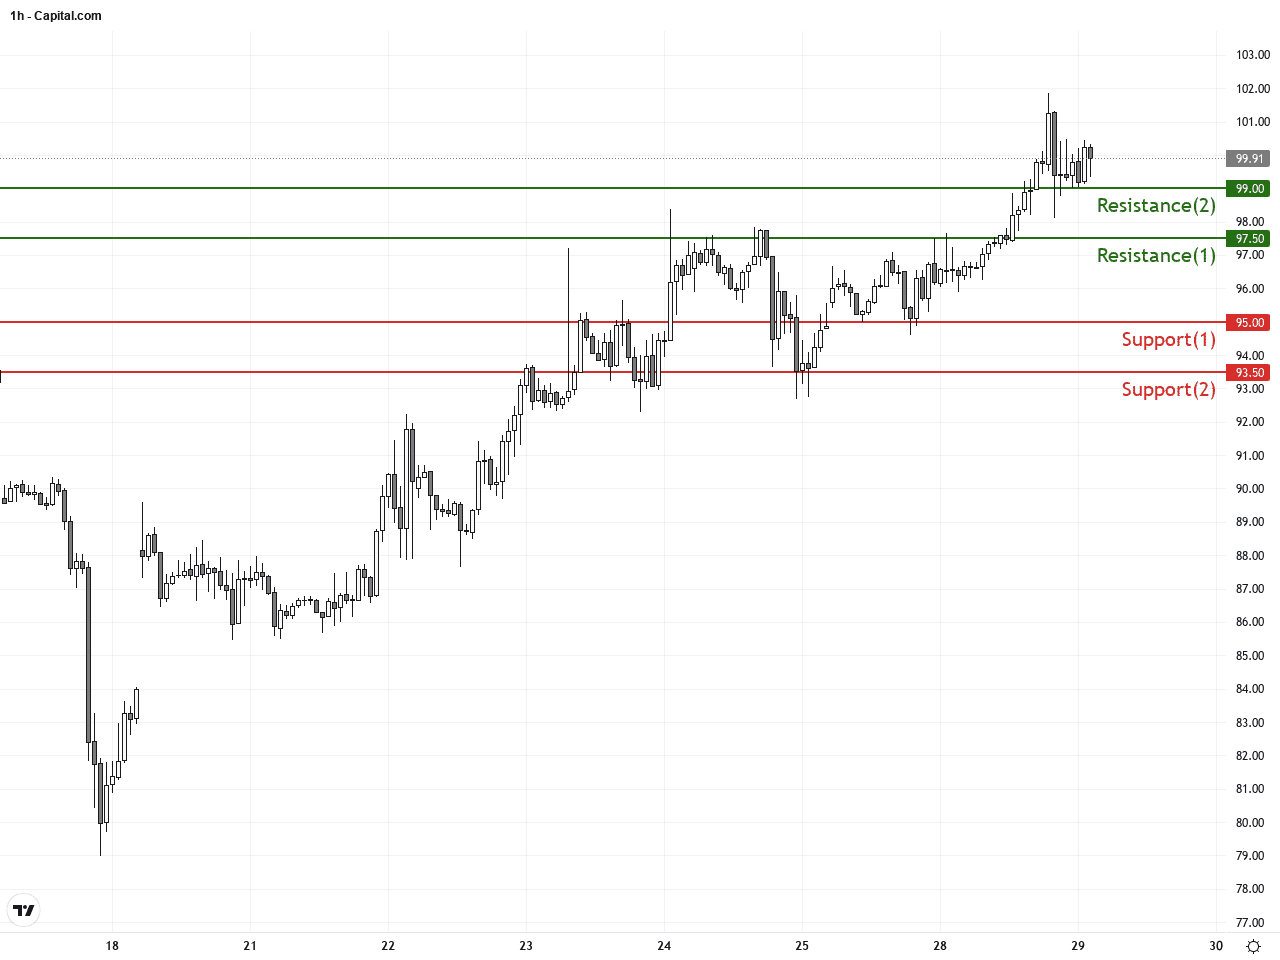
Resistance & Support
The above financial market data, quotes, charts, statistics, exchange rates, news, research, analysis, buy or sell ratings, financial education, and other information are for reference only. Before making any trades based on this information, you should consult independent professional advice to verify pricing data or obtain more detailed market information. 1uptick.com should not be regarded as soliciting any subscriber or visitor to execute any trade. You are solely responsible for all of your own trading decisions.