


 |
| Gold V.1.3.1 signal Telegram Channel (English) |

AUDUSD Technical & Fundamental Report: Key Resistance Levels and Geopolitical Risk Impact
2026-04-22 @ 06:01
Over the past 24 to 48 hours, the Australian Dollar against the US Dollar (AUD/USD) exhibited notable volatility, declining more than 0.30% from yesterday’s close of 0.7151. This fluctuation was primarily driven by escalating tensions between the US and Iran in the Middle East, which bolstered the US Dollar and dampened market risk sentiment, putting downward pressure on the Aussie.
Amid a risk-averse environment, Australian Dollar gains struggled to sustain, despite support from a robust Australian labor market and rising commodity prices. The AUD/USD pair failed to break above the 0.7200 level. Meanwhile, fleeting optimism surrounding US-Iran peace talks briefly weakened the dollar’s risk premium and lifted the Aussie, but as talks faltered, risk aversion quickly returned, causing AUD to retreat.
For the average investor, the recent AUD fluctuations resemble a rollercoaster ride driven by geopolitical uncertainty, heightening the perceived risk of holding Aussie assets. In summary, the market’s action remains heavily influenced by external political risk and the strength of the US Dollar, alongside shifts in risk appetite. Investors should closely monitor ongoing geopolitical developments and Australian economic data releases in the near term.
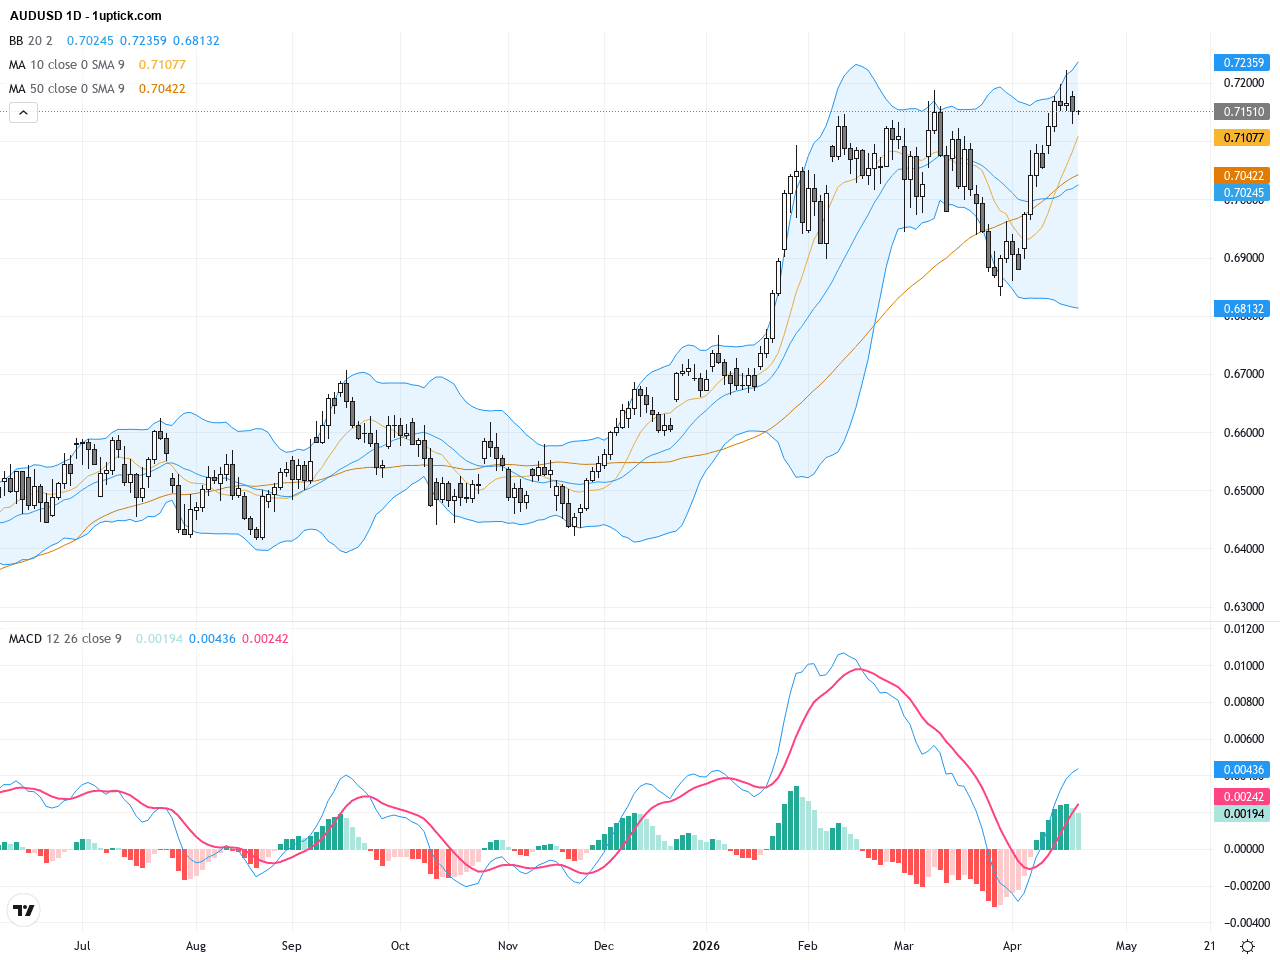
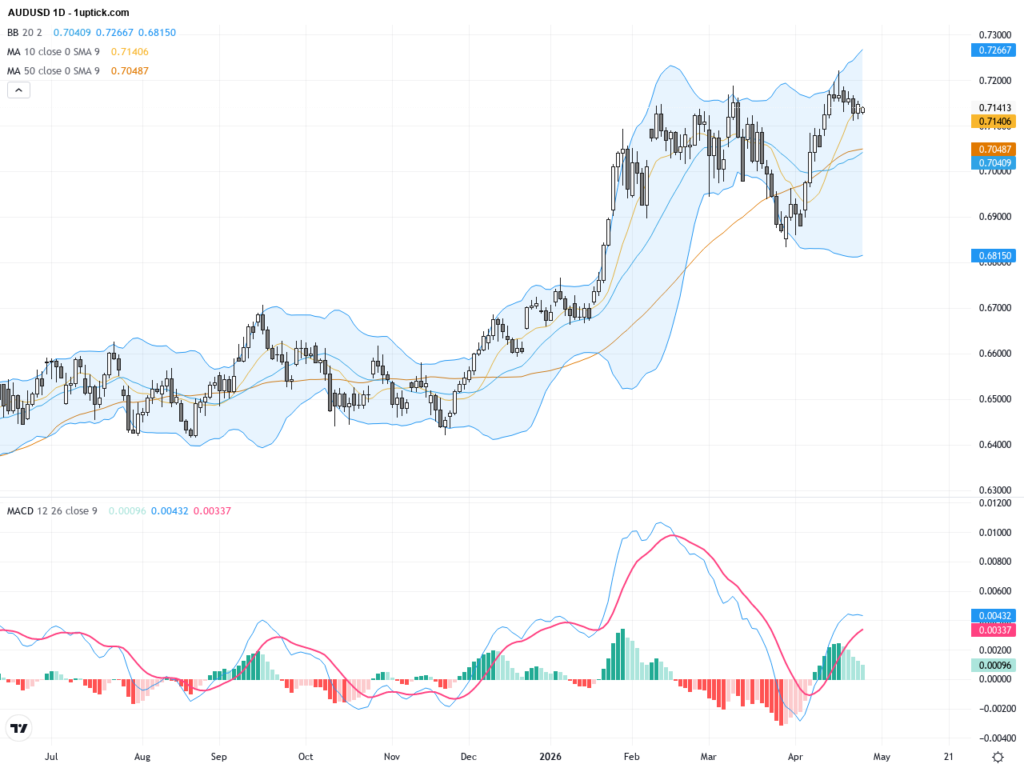
The daily chart reveals AUDUSD’s broad consolidation with price bouncing from earlier lows this year, trading between 0.703 and 0.718 levels recently. The 50-day moving average near 0.703 acts as short-term trend support, while the 200-day average around 0.675 confirms longer-term bullish bias. Bollinger Bands show early expansion indicating increasing volatility. The MACD stays above zero, signaling bullish momentum but recent crossovers suggest possible near-term retracement. Overall, the trend is bullish, though traders should stay alert to geopolitical tensions and a strong US dollar possibly triggering short-term pullbacks.
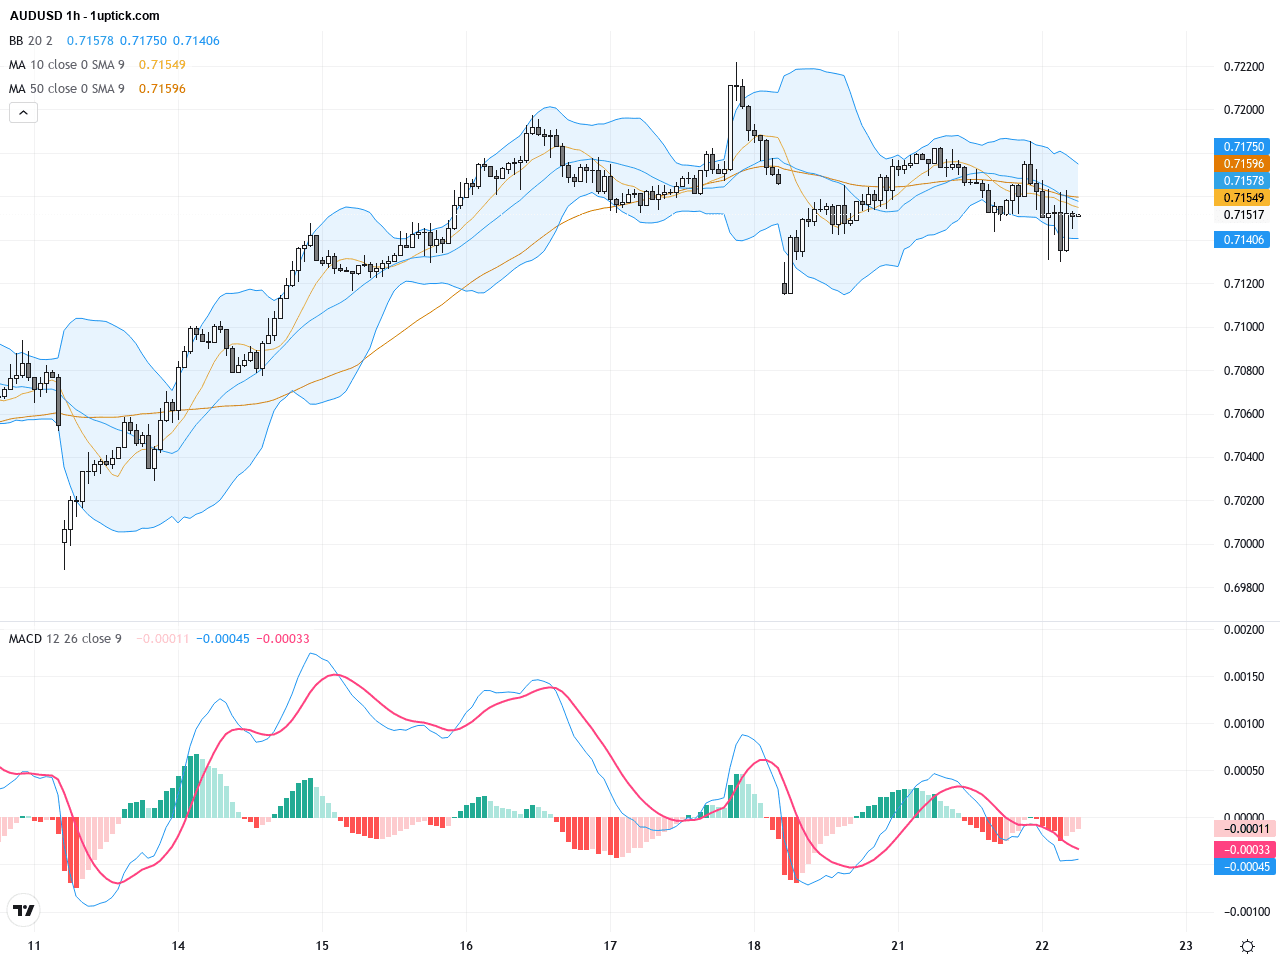
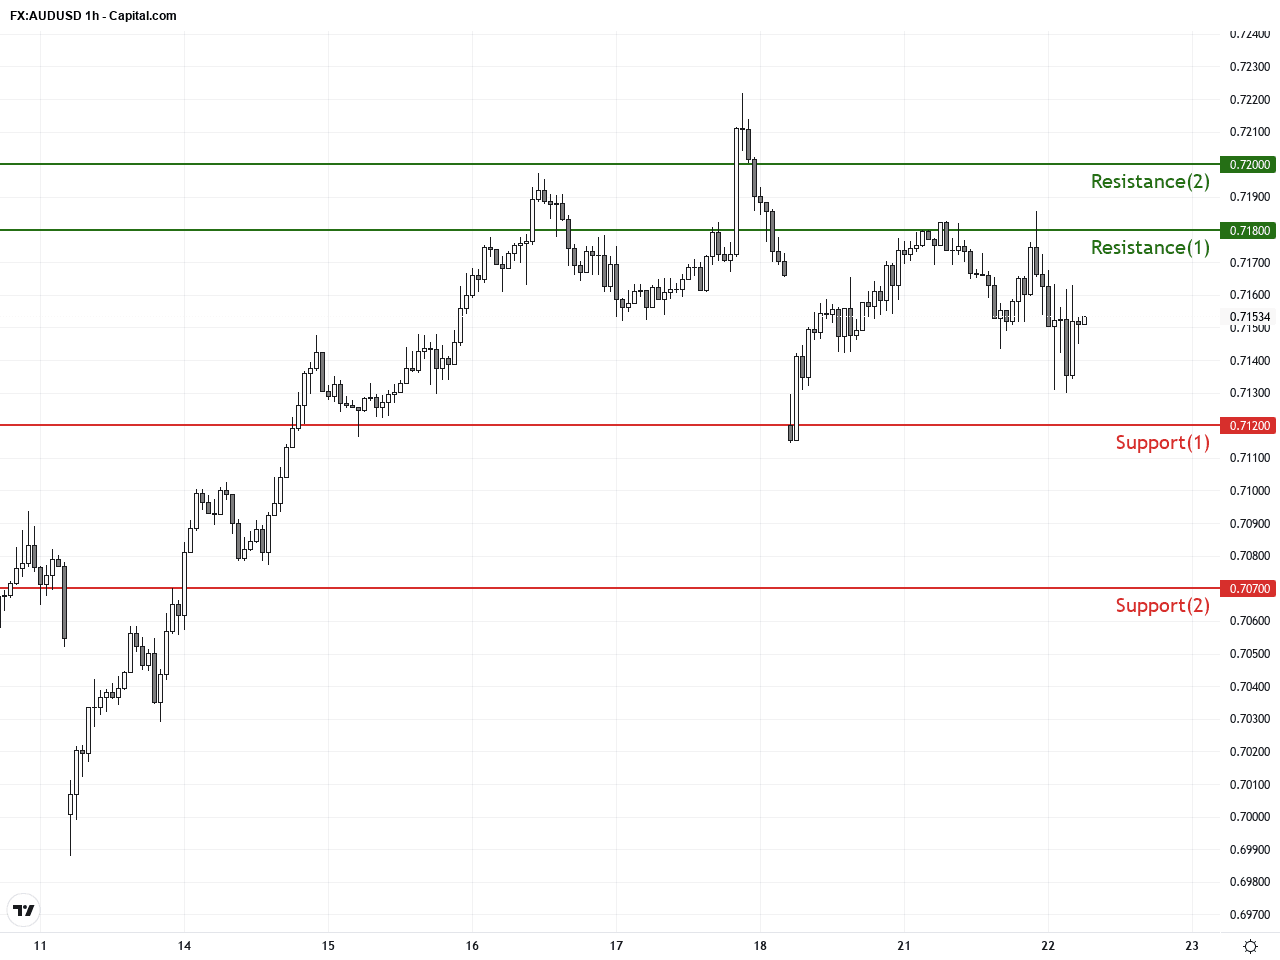
The hourly chart over the past 3-5 days shows price action ranging between 0.7100 and 0.7170, suggesting consolidation with a modest uptick. The 20- and 50-period moving averages often cross, reflecting increased volatility. Bollinger Bands are widening with price nearing the upper band before slight retracement. MACD histogram diminishes indicating waning momentum, and RSI oscillates around neutral. A recent bearish engulfing candlestick indicates potential short-term downside pressure, putting support near 0.7120 and resistance near 0.7170 to focus on.
Technical Trend: Cautiously Sideways
Technical analysis shows AUDUSD in short-term consolidation. Daily MACD confirms bullish momentum, yet hourly bearish engulfing candlestick signals potential near-term correction. The 0.712 support level is pivotal; a bounce here could trigger rallies towards 0.718 and 0.720 resistance zones. Declining momentum and volume indicators suggest caution for potential downside probes. Traders should maintain flexible strategies, watching price responses to geopolitical and risk sentiment shifts.Today’s economic calendar (GMT+1) features no significant events directly impacting AUDUSD. Japan’s March trade balance data attracts interest but holds limited influence on this pair. ECB and Bundesbank officials speak later in the day, but are not expected to cause notable AUDUSD moves. Market participants should remain focused on geopolitical tensions and China’s economic data for directional momentum.
Resistance & Support
The above financial market data, quotes, charts, statistics, exchange rates, news, research, analysis, buy or sell ratings, financial education, and other information are for reference only. Before making any trades based on this information, you should consult independent professional advice to verify pricing data or obtain more detailed market information. 1uptick.com should not be regarded as soliciting any subscriber or visitor to execute any trade. You are solely responsible for all of your own trading decisions.