


 |
| Gold V.1.3.1 signal Telegram Channel (English) |

EURUSD Technical & Fundamental Outlook: Euro Surges Past 1.1600 as Iran Deal Hopes Rise
2026-04-08 @ 09:01
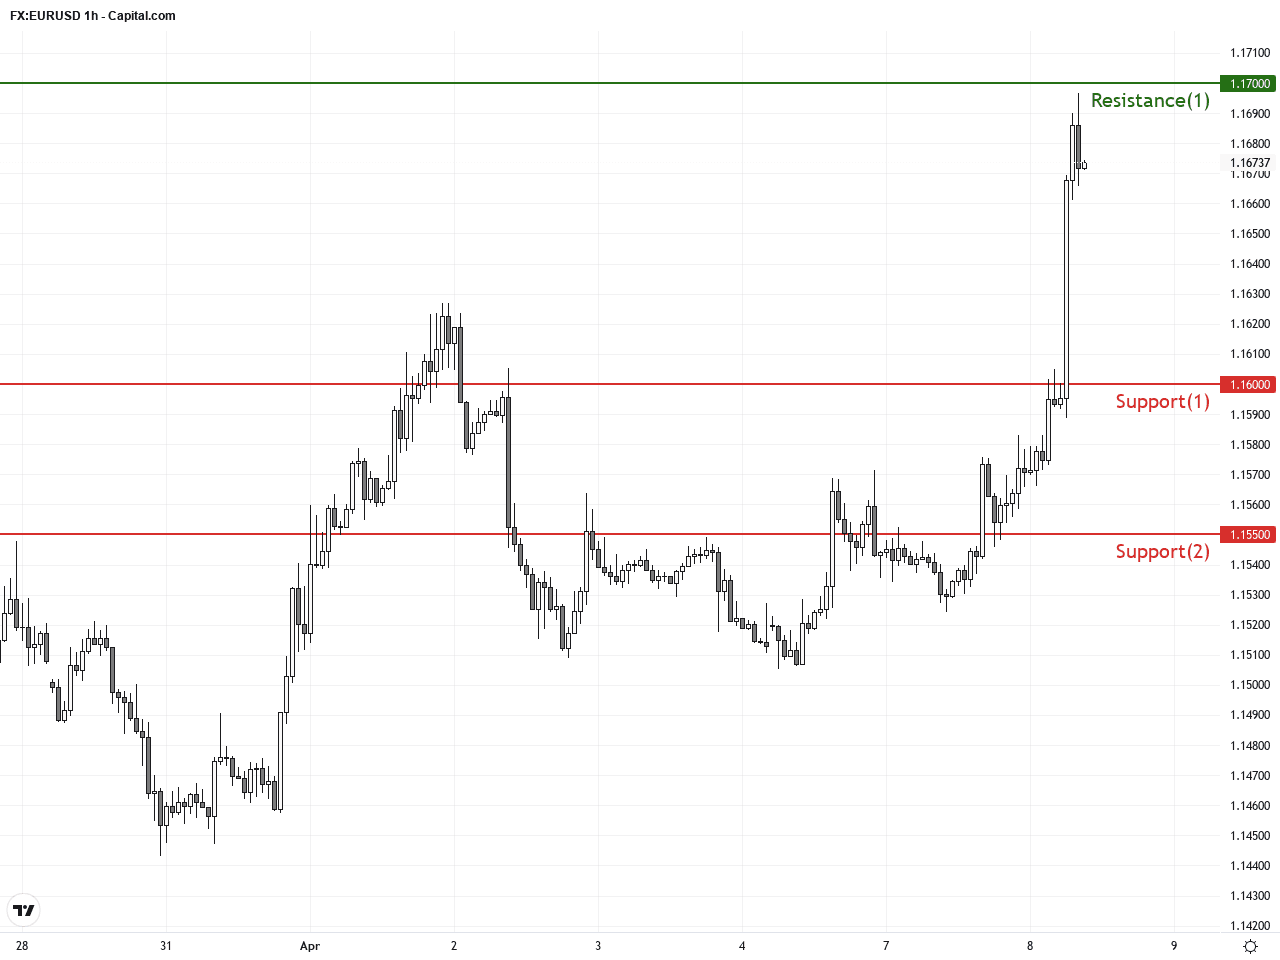
Over the past 24 to 48 hours, the EUR/USD experienced notable volatility, rebounding strongly from yesterday’s close around 1.1597 to approximately 1.1671, marking a rise exceeding 0.6%. This bullish move was largely driven by former US President Donald Trump’s signals that the US and Iran might be nearing a lasting peace deal, easing fears over the Middle East conflict escalation.
Trump’s social media post suggesting a potential end to the US-Iran war immediately revitalized market risk appetite, leading to gains in the euro and other currencies less associated with safe-haven demand. This positive development also lifted European stock markets significantly, restoring investor confidence and pushing the euro above resistance levels that capped it in recent days. Meanwhile, the US dollar faced slight pressure as demand for safe-haven assets waned, with the US Dollar Index stalling near the 100.50 resistance level.
For investors, this market reaction can be likened to a scenario where prolonged tensions show signs of resolution, diminishing uncertainty and encouraging capital flow into euro-denominated assets—commonly seen as a barometer of economic stability. Meanwhile, the US dollar, having gained strength recently due to Federal Reserve rate hike expectations, experiences reduced appeal as geopolitical risks ease, allowing currencies like the euro to benefit comparatively.
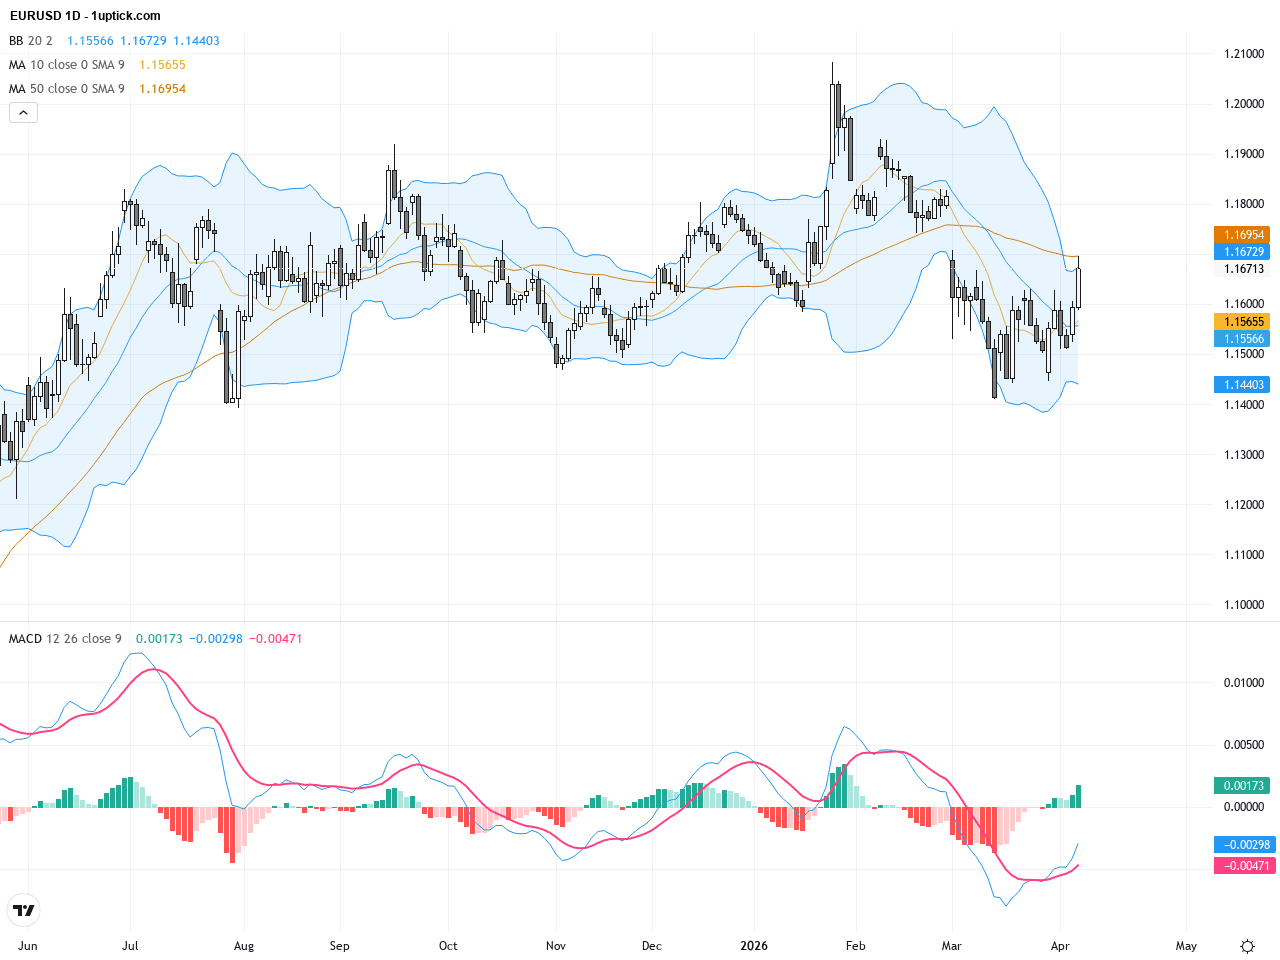
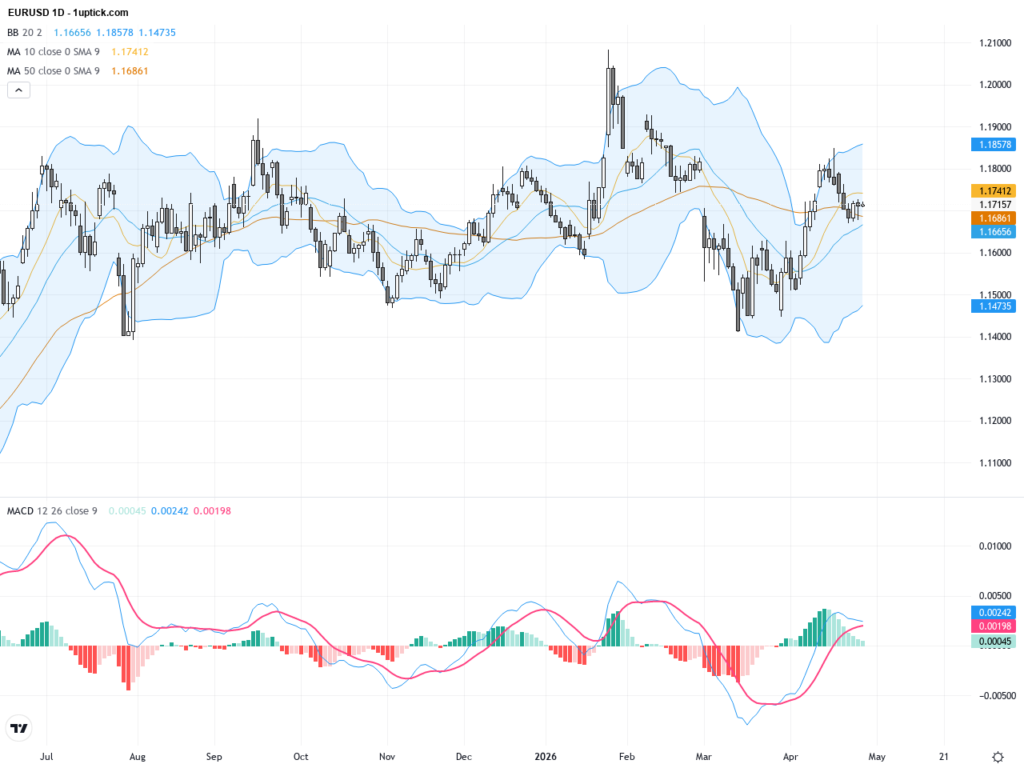
The daily chart shows a strong rebound in EURUSD over the past week, with the price holding above the 50-day moving average and testing resistance near the 200-day moving average. Bollinger Bands have widened, indicating increased volatility. The MACD has formed a bullish crossover, reinforcing upward momentum. A rising triangle pattern has recently begun to shape, suggesting that buyers are consolidating energy for a possible breakout. Overall, the medium-term bias is bullish, though caution is warranted around resistance levels.
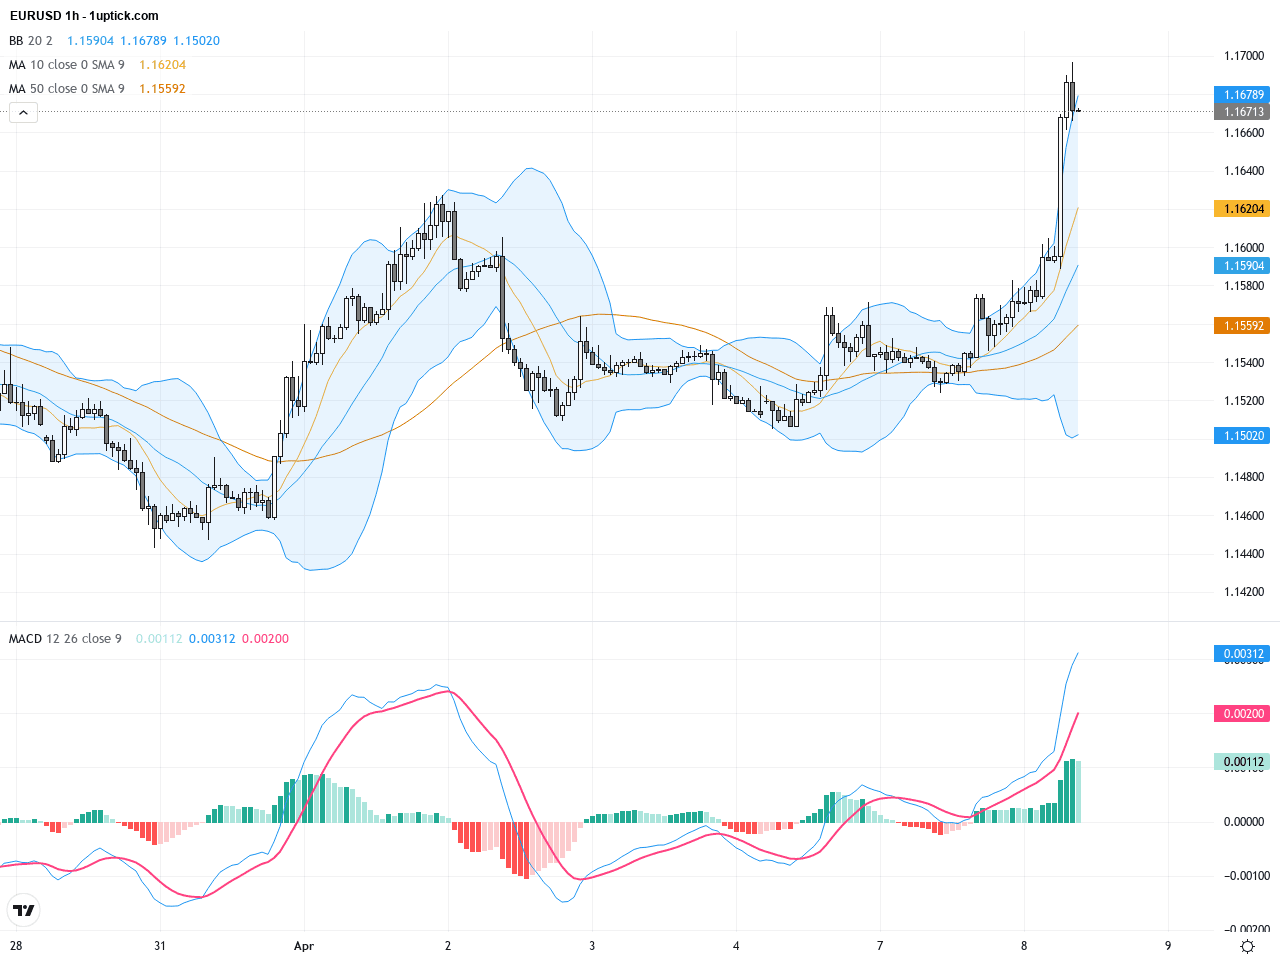
The hourly chart reveals EURUSD entering a steady uptrend over the last 3-5 days. Short-term moving averages (20 and 50 periods) are bullishly aligned, providing immediate support. Bollinger Bands are contracting, hinting at a potential short-term acceleration. A hammer candlestick with a long lower wick recently appeared, signaling renewed buying interest, with a likely continuation of gains in the next 24 hours. MACD histogram is rising with RSI near overbought but still showing strength.
Technical Trend: The current trend for EURUSD is cautiously bullish. Supported by positive geopolitical signals and technical momentum, the pair shows signs of recovering upwards but remains susceptible to volatility driven by USD strength and energy price movements.
The rising triangle pattern on the daily chart suggests accumulation ahead of a possible breakout. The recent hammer candlestick indicates buying pressure at short-term support levels between the 50 and 200-day moving averages. The MACD golden cross and widening Bollinger Bands provide confirmatory momentum cues. However, RSI entering the upper range signals the need for caution due to overbought conditions. Traders should watch for decisive volume confirmation to validate any breakout and set prudent stop-loss levels to manage pullback risks.Today’s economic calendar highlights key eurozone data releases including German Factory Orders at 08:00 (GMT+1) with an expected 2% monthly increase. Positive surprises here would support EURUSD. European Producer Price Index and Retail Sales, scheduled for 11:00, will also provide insight into underlying economic strength. For the US, later releases focus on crude oil inventory and FOMC member comments, which could indirectly affect USD sentiment. Overall, no major US data points today directly target EURUSD, but European figures will be key for near-term price action.
Resistance & Support
The above financial market data, quotes, charts, statistics, exchange rates, news, research, analysis, buy or sell ratings, financial education, and other information are for reference only. Before making any trades based on this information, you should consult independent professional advice to verify pricing data or obtain more detailed market information. 1uptick.com should not be regarded as soliciting any subscriber or visitor to execute any trade. You are solely responsible for all of your own trading decisions.