


 |
| Gold V.1.3.1 signal Telegram Channel (English) |

USDCAD Nears Key Resistance at 1.3700 Amid Oil Price Surge and Central Bank Signals
2026-04-30 @ 13:01
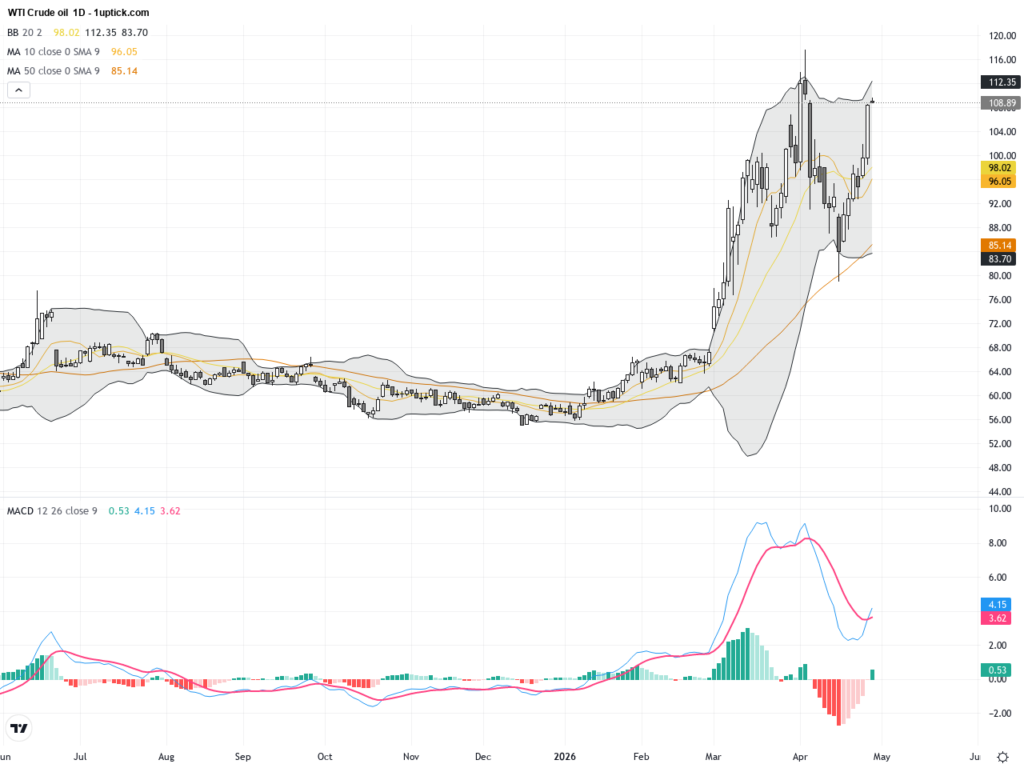
Over the past 24 to 48 hours, USD/CAD has hovered around 1.3685 with limited volatility but notable market nuance. Despite oil prices holding firm near $114 a barrel—a factor that typically bolsters the Canadian dollar—the USD/CAD pair has instead been climbing, recently retesting the key 1.3700 level. This unusual ‘oil and loonie breakup’ has caused investors to rethink what’s driving the currency moves.
One driving factor behind this divergence is the Bank of Canada’s recent decision to hold its policy rate steady at 2.25%, accompanied by a dovish tone suggesting no imminent rate hikes. This dampens the yield advantage of the Canadian dollar, contrasting sharply with the soaring oil price. Meanwhile, geopolitical tensions, particularly involving Iran, have stirred safe-haven demand, strengthening the US dollar and further limiting the loonie’s gains.
For everyday investors, this means that despite rising oil prices, the Canadian dollar might not necessarily appreciate, while the US dollar may stay stronger in the short term. This nuanced market environment highlights the importance of monitoring central bank policies and global political developments directly influencing forex movements rather than relying solely on traditional commodity currency logic.
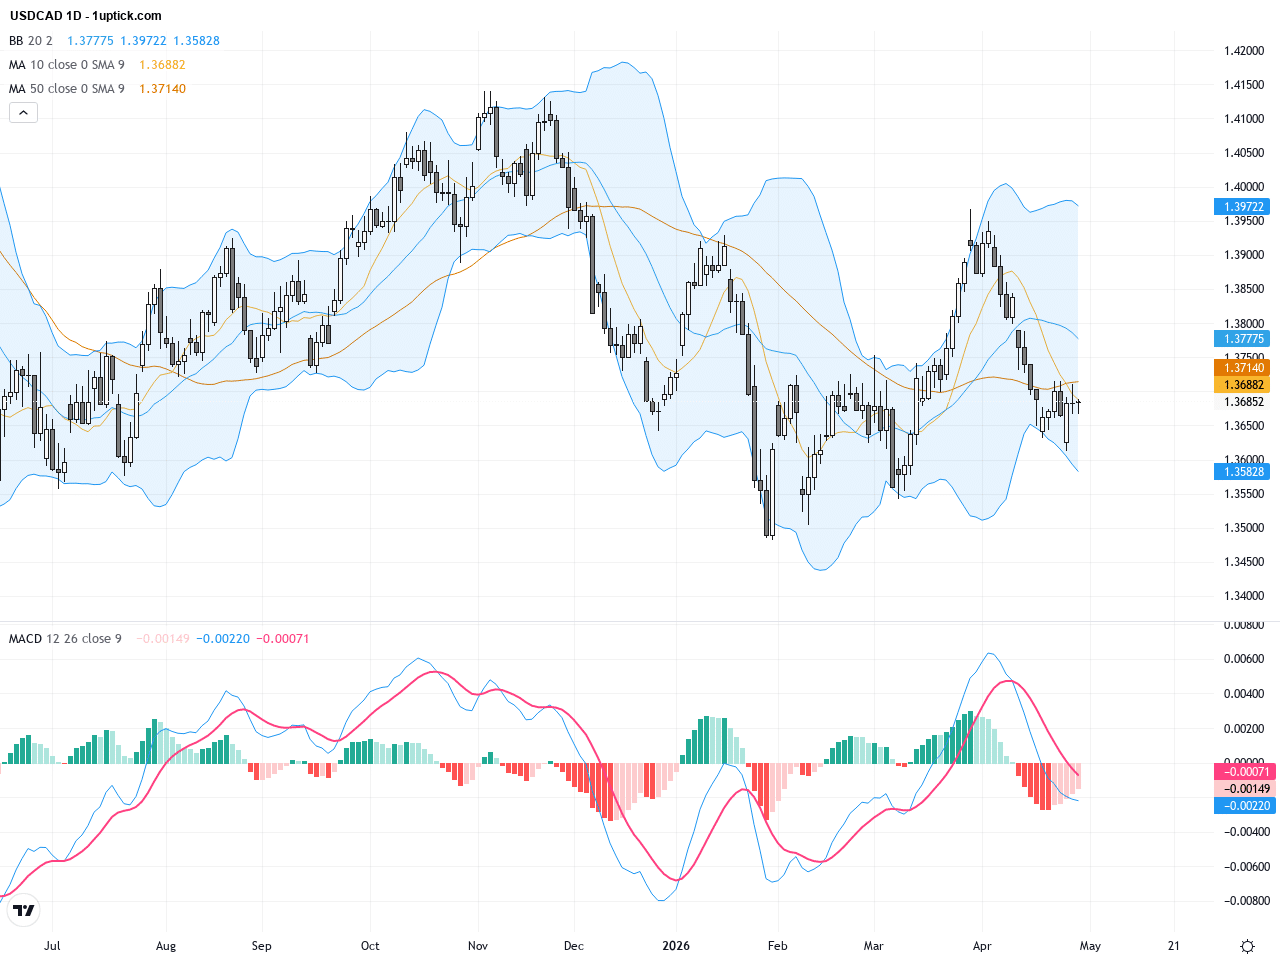
The daily chart reveals a predominant downtrend over the past month, with USDCAD retreating from a high near 1.4140 to around 1.3600 before rebounding recently. The 20-day and 50-day moving averages are sloping downward, indicating sustained medium-term bearishness. Bollinger Bands are narrowing, suggesting decreased volatility, while MACD remains in negative territory but shows a short-term uptick in histogram bars, hinting at a potential bottom reversal.
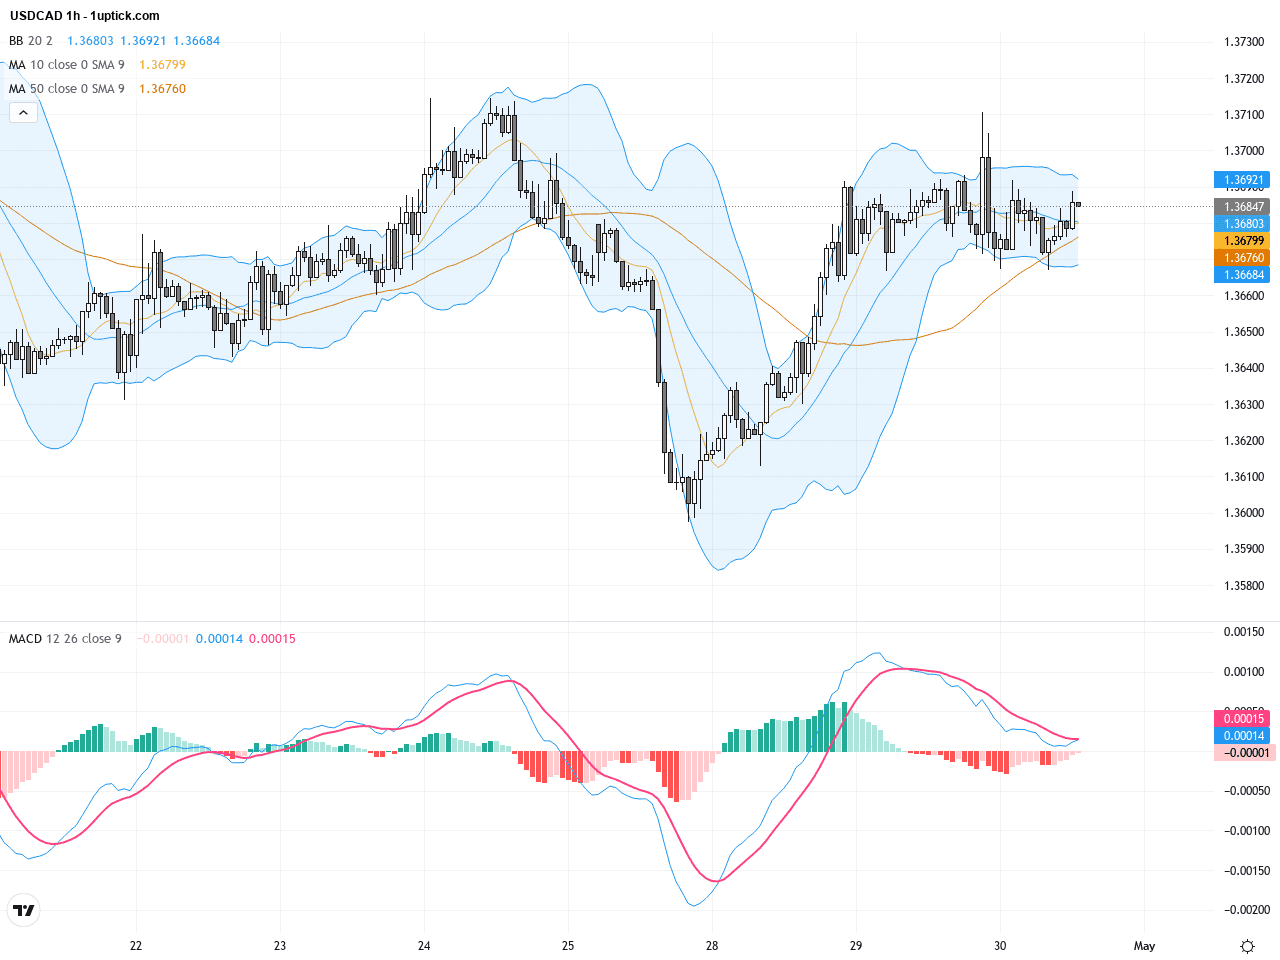
On the hourly chart, USDCAD has formed a short-term upward trend over the last 3-5 days, recovering from 1.3600 to near 1.3685. The fast MA10 has crossed above MA20 indicating bullish momentum. The expanded Bollinger Bands reflect increased trading activity, and the MACD fast line crossing over the slow line confirms a buy signal. A recent bullish engulfing candlestick pattern indicates probable continued upside in the next 24 hours.
Technical Trend: The current trend can be described as cautiously bullish in the short term with medium-term bearish undertones, reflecting a market in consolidation and selective rebound.
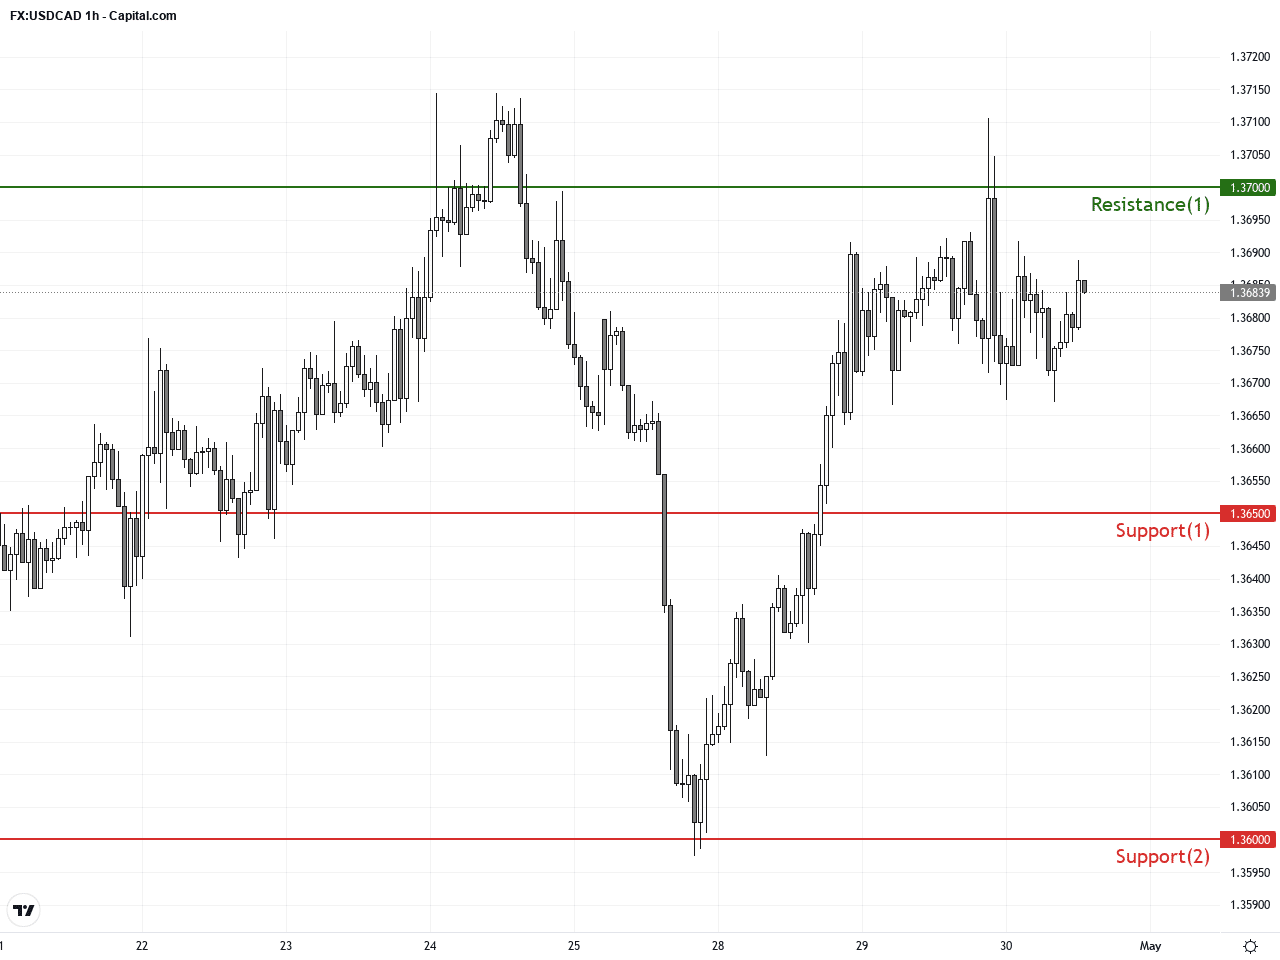
Technically, USDCAD is approaching a crucial resistance near 1.3700. A break above this level could lead to further upside momentum. While the daily chart favors a medium-term bearish bias, short-term indicators like the hourly moving average crossover and MACD bullish signal point to rising momentum. The recent bullish engulfing pattern strengthens the case for a potential short-term rally. Traders should look for confirmation of breakout or pullback setups combined with ongoing fundamental inputs such as oil prices and central bank communications.Today’s economic calendar shows no major US or Canadian economic releases directly impacting USDCAD before the Asian market close. However, later US data releases at 14:30 GMT+1, including Personal Consumption Expenditures (PCE) and GDP figures, carry significant weight for the USD. These will indirectly influence USDCAD moves, so traders should watch market reactions closely upon release to recalibrate positions.
Resistance & Support
The above financial market data, quotes, charts, statistics, exchange rates, news, research, analysis, buy or sell ratings, financial education, and other information are for reference only. Before making any trades based on this information, you should consult independent professional advice to verify pricing data or obtain more detailed market information. 1uptick.com should not be regarded as soliciting any subscriber or visitor to execute any trade. You are solely responsible for all of your own trading decisions.