


 |
| Gold V.1.3.1 signal Telegram Channel (English) |

The UAE Just Rage-Quit OPEC, and the Oil Market Barely Flinched
2026-04-29 @ 02:21
On April 28, 2026, the United Arab Emirates did what every frustrated group-project member has fantasized about since the dawn of civilization: it quit the group chat. Effective May 1, the UAE will no longer be a member of OPEC, the 66-year-old oil cartel that has functioned—depending on your perspective—as either the world’s most consequential commodity cooperative or history’s longest-running argument about who’s pumping too much.
The official statement was diplomat-speak at its finest: the exit ‘aligns with the UAE’s long-term strategic economic vision’ and reflects ‘the urgent needs of the market stemming from disruptions in the Arabian Gulf.’ Translation: ‘We’re tired of asking permission to sell our own oil while the Strait of Hormuz is functionally a war zone.’
And here’s where it gets delicious. The market’s response to this supposedly seismic event? The response is with no response. The biggest OPEC defection in over a decade, and the oil market reacted with the enthusiasm of a cat watching you rearrange furniture. Not alarmed. Not excited. Mildly aware that something moved.
This disconnect between the dramatic headline and the muted reaction is, in fact, the entire story. Because the UAE’s exit isn’t the cause of OPEC’s unraveling—it’s the receipt. The cartel was already broken. The UAE just had the good manners to make it official.
The ‘Big Brain’ Moment: OPEC as a Gym Membership Nobody Uses
Here’s the financial concept that makes the whole thing click: spare capacity illusion.
For decades, OPEC has sold the world on a comforting fiction: that it maintains roughly 5.6 million barrels per day of spare production capacity—a kind of emergency oil reserve that can be turned on like a faucet whenever global supply gets tight. This is the bedrock assumption underlying virtually every oil price model, every central bank inflation forecast, and every Energy Twitter argument since 2010.
Think of it like a gym membership. OPEC has been telling the world: ‘Oh, we could totally bench 300 pounds. We just choose not to. But if things got serious? We’d be there.’ And for years, nobody tested it. Prices stayed manageable, conflicts resolved before things got truly dire, and the fiction held.
Then 2026 happened. The US-Israel conflict with Iran escalated in February. The Strait of Hormuz—through which roughly 20% of global oil trade normally flows—effectively closed. Global supply contracted by 1.8 million barrels per day involuntarily. And when the world turned to OPEC and said, ‘Okay, time to bench 300,’ something awkward happened: most of them couldn’t get the bar off the rack.
Russia showed up to the April technical committee meeting in Vienna with, and I quote from market analysis, ‘no new production plan, no timeline for capacity additions, and no solutions.’ That’s not strategic ambiguity. That’s showing up to a potluck empty-handed and pretending you thought it was a restaurant. Russia’s production infrastructure, hammered by sanctions targeting nearly 70% of its crude exports and starved of capital investment, physically cannot increase output in meaningful timeframes. The gap between OPEC+’s claimed spare capacity and what analysts call ‘effective spare capacity’—the amount that can actually be sustained without degrading in subsequent months—may exceed two million barrels per day. In gym terms, OPEC said it could bench 300, but its actual max is maybe 180, and even that makes it sore for a week.
The UAE looked at this situation and made a perfectly rational calculation: why remain in a gym that can’t spot you when you need it? ADNOC, the national oil company, has been building toward 5 million barrels per day of production capacity by 2027. Under OPEC quotas, that expansion would be constrained by collective agreements. Outside OPEC, the UAE can pump whatever it wants, sell to whoever it wants, and respond to Hormuz disruptions on its own timeline rather than waiting for a consensus vote from 12 countries, half of whom can’t increase production anyway.
The Numbers That Actually Matter
Let’s talk about what the market is really pricing, because this is where most headline-readers get it catastrophically wrong.
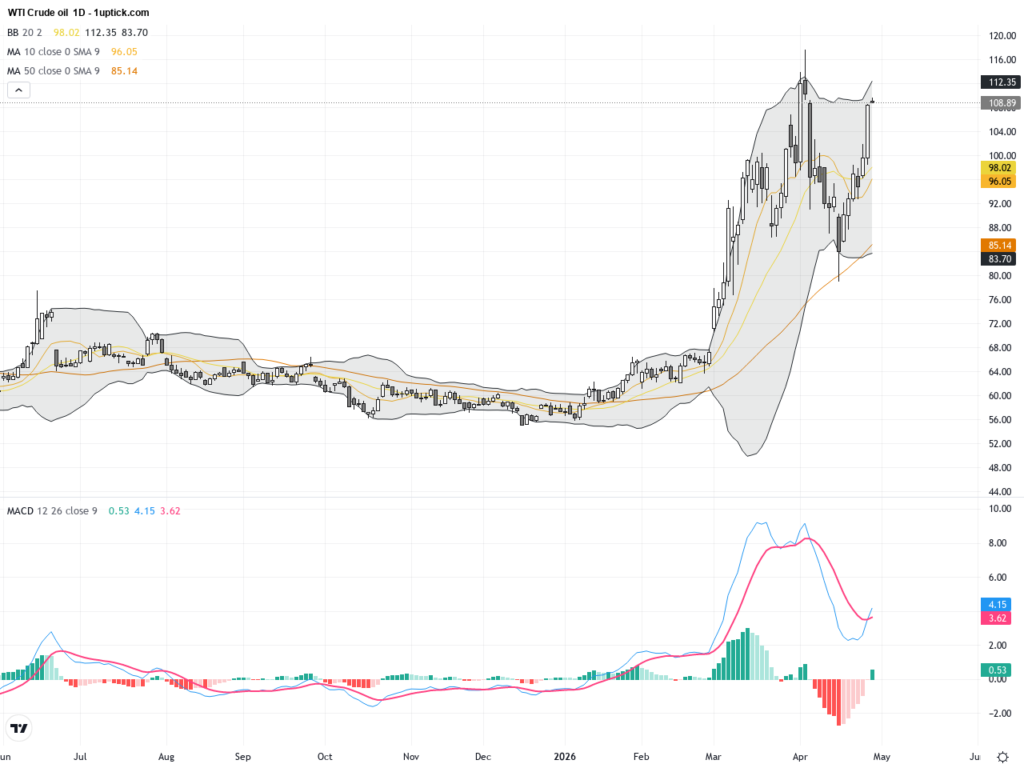
Current oil at ~$98/barrel is not a single price. It’s more like a layer cake of risk premiums stacked on top of a fundamental equilibrium that institutional forecasters peg somewhere between $55 and $65 per barrel. Here’s the decomposition:
Layer 1: Fundamental equilibrium (~$55–65). This is where oil ‘wants’ to be based on supply-demand mechanics alone. The EIA projects global supply growth of 1.6 million barrels per day in 2026 versus demand growth of just 0.9 million. J.P. Morgan explicitly warns that ‘without aggressive OPEC+ action, Brent could spend stretches below $60 through 2026–27 as a surplus approaching 3 million barrels per day builds.’ That’s not a typo. Three million barrels per day of surplus. In a normal world without geopolitical chaos, oil would be trading at levels that would make energy bulls physically ill.
Layer 2: Hormuz disruption premium (~$15–25). The Strait of Hormuz remains functionally constrained despite a nominal ceasefire announced April 8. Ship owners remain cautious, war-risk insurance premiums are still elevated, and confidence in sustained passage hasn’t been restored. Every day that Hormuz traffic stays below normal adds dollars to Brent. Goldman Sachs estimates total Middle East output losses at 14.5 million barrels per day—a number that exceeds global spare capacity by a factor of seven.
Layer 3: OPEC+ dysfunction premium (~$5–10). This is the relatively small but growing component that reflects the market’s realization that OPEC+ cannot function as a supply buffer. The UAE’s exit expands this premium marginally, but the market had already been pricing OPEC+ deterioration since early 2026.
Layer 4: Iranian recovery timeline premium (~$5–10). How long until Iran’s production normalizes? Months, not weeks, per Goldman Sachs. Each month of delay maintains scarcity pricing.
When you understand this decomposition, the UAE’s OPEC exit suddenly looks very different from the headline narrative. The exit primarily affects Layer 3 (OPEC dysfunction) and modestly helps Layer 2 (more supply potentially available to offset Hormuz disruption). But it does virtually nothing to Layers 1 or 4. The market priced it accordingly—a modest decline to $94, not a crash to $65.
The Retail Investor Trap (Or: How to Lose Money Being Right)
Here’s where it gets personal. If you’re a retail investor reading this, the UAE’s OPEC exit probably activated one of two psychological responses:
Response A (The Bear): ‘More supply coming online, OPEC is falling apart, oil is going to $60. I should short energy stocks.’ This person is probably correct about the direction of travel over 6–12 months. They are almost certainly going to lose money in the next 6–12 weeks.
Response B (The Bull): ‘Geopolitical chaos everywhere, Hormuz is still closed, spare capacity is fiction, oil is going to $130.’ This person is probably correct about tail risks. They are almost certainly overestimating the probability of sustained $130 oil.
The actual market environment is a cruel hybrid of both. Fundamental supply-demand dynamics are genuinely bearish—the surplus is coming, the non-OPEC supply wave from the Permian Basin, Guyana, and Brazil is real, and OPEC+’s market share has collapsed from 53% in 2016 to 46% in 2026. But the interim path is littered with geopolitical landmines that can produce face-ripping rallies of 15–25% in a matter of days if US-Iran peace talks collapse or another Hormuz incident occurs.
This is the classic trap of being ‘directionally right but tactically murdered.’ The retail investor who shorts oil at $94 based on the UAE exit and then watches it spike to $118 on a geopolitical headline will likely cover the position at a loss—right before the fundamental thesis plays out and oil falls to $70. The market has an exquisite talent for forcing you out of correct positions at exactly the wrong time. It’s like knowing a restaurant is going to close eventually but showing up every night for the early bird special and getting food poisoning.
What OPEC’s Crumbling Actually Means for Your Portfolio
Let’s move from narrative to actionable implications, because entertainment without utility is just podcasting.
The structural regime shift is real. OPEC’s ability to manage global oil prices through coordinated supply management is functionally over. The UAE’s exit is the first domino, but the logic that drove the UAE out—unilateral optimization beats collective restraint when the collective can’t deliver—applies equally to Kuwait, Iraq, and eventually smaller members. Within 24 months, OPEC may function less as a cartel and more as a trade association: meetings, communiqués, and absolutely no binding production discipline. Saudi Arabia will retain its role as the global swing producer, but it will do so unilaterally rather than through institutional coordination.
Volatility is the new normal. Without OPEC+ functioning as a supply buffer, individual supply shocks flow through to prices more directly. A pipeline disruption in Nigeria, a hurricane in the Gulf of Mexico, or a tanker incident in Hormuz—events that OPEC’s spare capacity once absorbed—will now produce sharper, faster price moves. If your portfolio is calibrated for oil trading in a $70–90 range with occasional modest spikes, recalibrate. The new range is more like $55–130, with regime changes happening on the timescale of tweets rather than quarters.
The energy equity divergence will accelerate. E&P companies with breakeven costs above $60/barrel—particularly those in deep-water, Arctic, or complex infrastructure plays—face increasingly hostile economics as fundamental prices gravitate toward $55–70. Conversely, low-cost producers (Saudi Aramco, ADNOC, Brazilian pre-salt operators) remain robust across nearly any scenario. The midstream and downstream players—pipeline operators, refiners, LNG terminal owners—benefit from volume throughput regardless of commodity price direction and may offer the most resilient risk-adjusted returns in a volatile environment.
The energy transition gets weird. Lower average oil prices ($55–70) should theoretically decelerate the shift to EVs and renewables by making petroleum cheaper relative to alternatives. But higher volatility simultaneously incentivizes large energy consumers—airlines, shipping companies, industrial manufacturers—to diversify away from oil precisely because they can’t predict costs quarter to quarter. The net effect is likely accelerated transition among large sophisticated buyers alongside decelerated transition among price-sensitive consumers. Corporate fleet electrification accelerates. Consumer EV adoption in developing markets slows. The energy transition becomes less of a smooth S-curve and more of a Jackson Pollock painting.
The Iran Variable: Everything Else Is a Rounding Error
All of the analysis above—the supply-demand projections, the spare capacity illusion, the OPEC+ dysfunction, the retail investor psychology—is ultimately subordinate to a single geopolitical variable: what happens with Iran.
If US-Iran peace negotiations succeed and the Strait of Hormuz fully reopens, oil prices will correct sharply toward fundamental equilibrium ($55–65), the supply surplus will materialize aggressively, and the UAE’s OPEC exit will be remembered as a footnote to a broader normalization story. In this scenario, energy bears win decisively but probably later than they expect, as Iranian production recovery takes months even under optimistic assumptions.
If negotiations fail and Hormuz remains constrained or closes again, oil prices could surge to $120–150, inventory draws would accelerate, and the spare capacity fiction would be exposed catastrophically. In this scenario, the UAE’s exit from OPEC becomes irrelevant noise—nobody cares about cartel coordination when physical barrels aren’t getting through a strait.
The third and arguably most likely scenario is something in between: a slow, halting normalization where Hormuz gradually reopens but confidence remains fragile, Iranian production recovers partially but not fully, and prices oscillate in a wide $80–110 range for the remainder of 2026 before gravitating toward lower levels in 2027. This scenario is the hardest to trade, the least satisfying narratively, and the most probable. Markets, like most things in life, resolve ambiguously.
The Bottom Line
The UAE’s OPEC exit is not the earthquake the headlines suggest. It’s more like a building inspector’s report confirming what everyone already suspected: the foundation has been cracking for years, and someone finally wrote it down officially. The cartel model for managing global oil supply is functionally dead, killed not by any single member’s defection but by the accumulated weight of non-OPEC supply growth, chronic underinvestment in actual spare capacity, and a geopolitical environment that has transformed ‘tail risk’ into ‘recurring Tuesday.’
For investors, the signal is not ‘oil goes down’ or ‘oil goes up.’ The signal is: the regime has changed. The comfortable assumptions that have guided energy market participation for decades—OPEC manages supply, spare capacity absorbs shocks, prices oscillate in a predictable band—no longer hold. What replaces them is a messier, more volatile, more fundamentally competitive market where the best returns will accrue to participants who can distinguish between headline noise and structural signal, who can hold directional views while managing tactical risk, and who understand that being right about the destination means nothing if you blow up on the journey.
Or, in simpler terms: the gym’s closing down. Figure out how to exercise on your own.