


 |
| Gold V.1.3.1 signal Telegram Channel (English) |
WTI Crude Oil: Middle East Tensions Fuel Price Volatility Amid Technical Consolidation, May 12, 2026
2026-05-12 @ 06:03
Over the past 24 to 48 hours, WTI crude oil prices have experienced notable volatility, with prices adjusting slightly from the May 11 closing price of $98.07 and continuing to be pushed higher amid escalating tensions in the Middle East. The ongoing developments around Iran have taken center stage, driving trader caution regarding oil price uncertainty.
Recent market news highlights that heightened tensions between Iran and the US in the Strait of Hormuz have raised concerns over potential supply disruptions. This has led to speculation of WTI prices possibly reaching as high as $130 in May 2026. President Trump’s rejection of Iran’s counterproposal to end the conflict, alongside Israeli Prime Minister Netanyahu’s stern stance against Iran, have intensified regional instability. These factors directly pushed WTI prices beyond recent closing levels, returning above the $100 mark and sharply reflecting investor sensitivity to supply risks and geopolitical tensions.
For the average investor, this surge in oil prices is like an unexpected storm—bringing both the opportunity for rapid gains and a clear warning to be mindful of unpredictable geopolitical risks. In such a climate, oil market trading grows more complex, demanding adaptive investment strategies responsive to external events impacting supply and pricing.

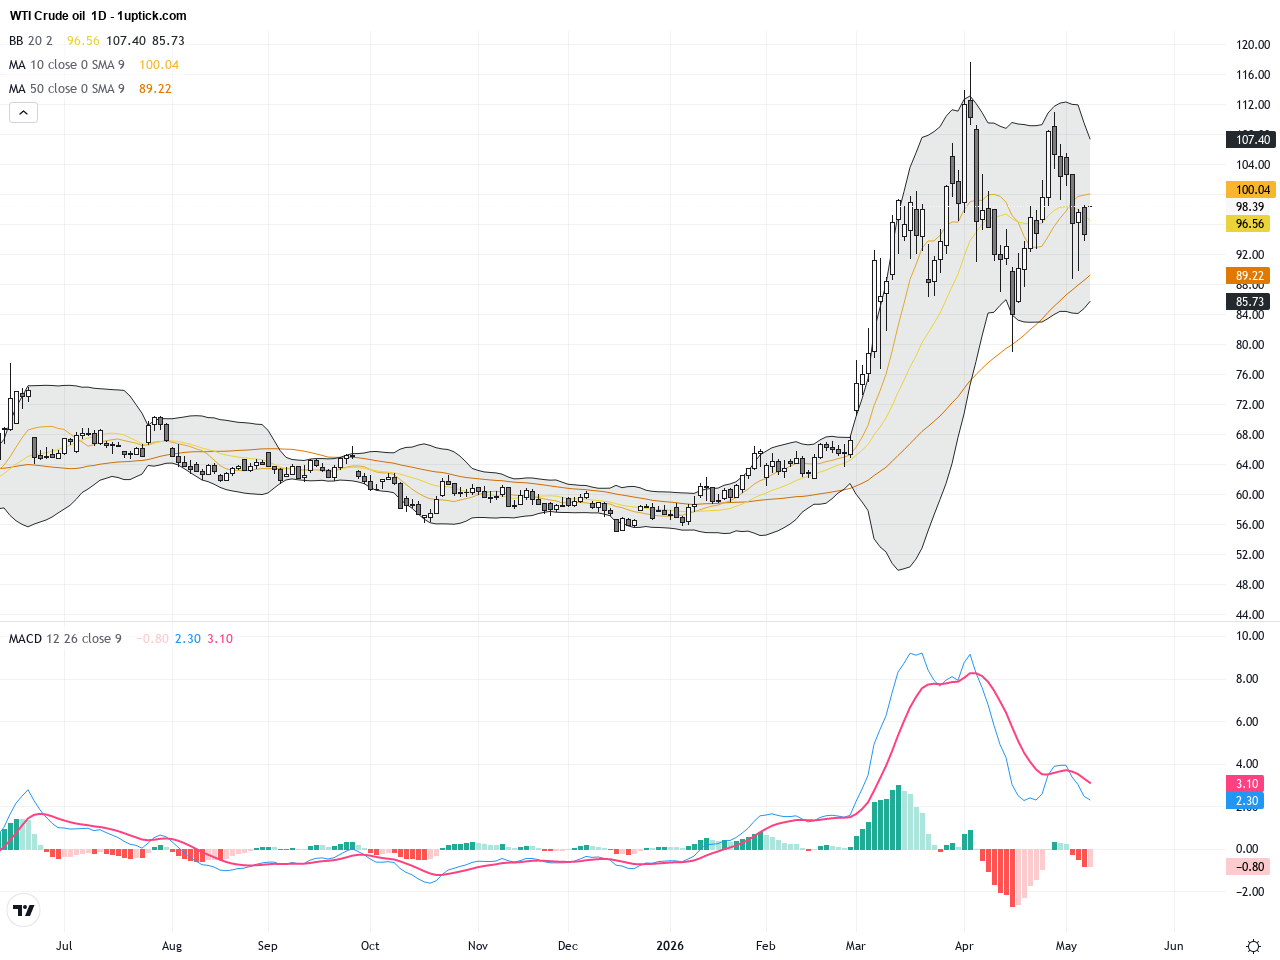
The daily chart reveals a consolidation phase following a peak near $106.88 at the end of April. Prices have gradually tested support in the $95-$98 range. Moving averages are flattening, and the Bollinger Bands are tightening, signaling compression and anticipation of a directional breakout. The MACD is contracting, reflecting indecision between bulls and bears. Overall, the trend shows signs of a tempering momentum with no clear breakout, suggesting investors remain cautious while watching for new directional cues.

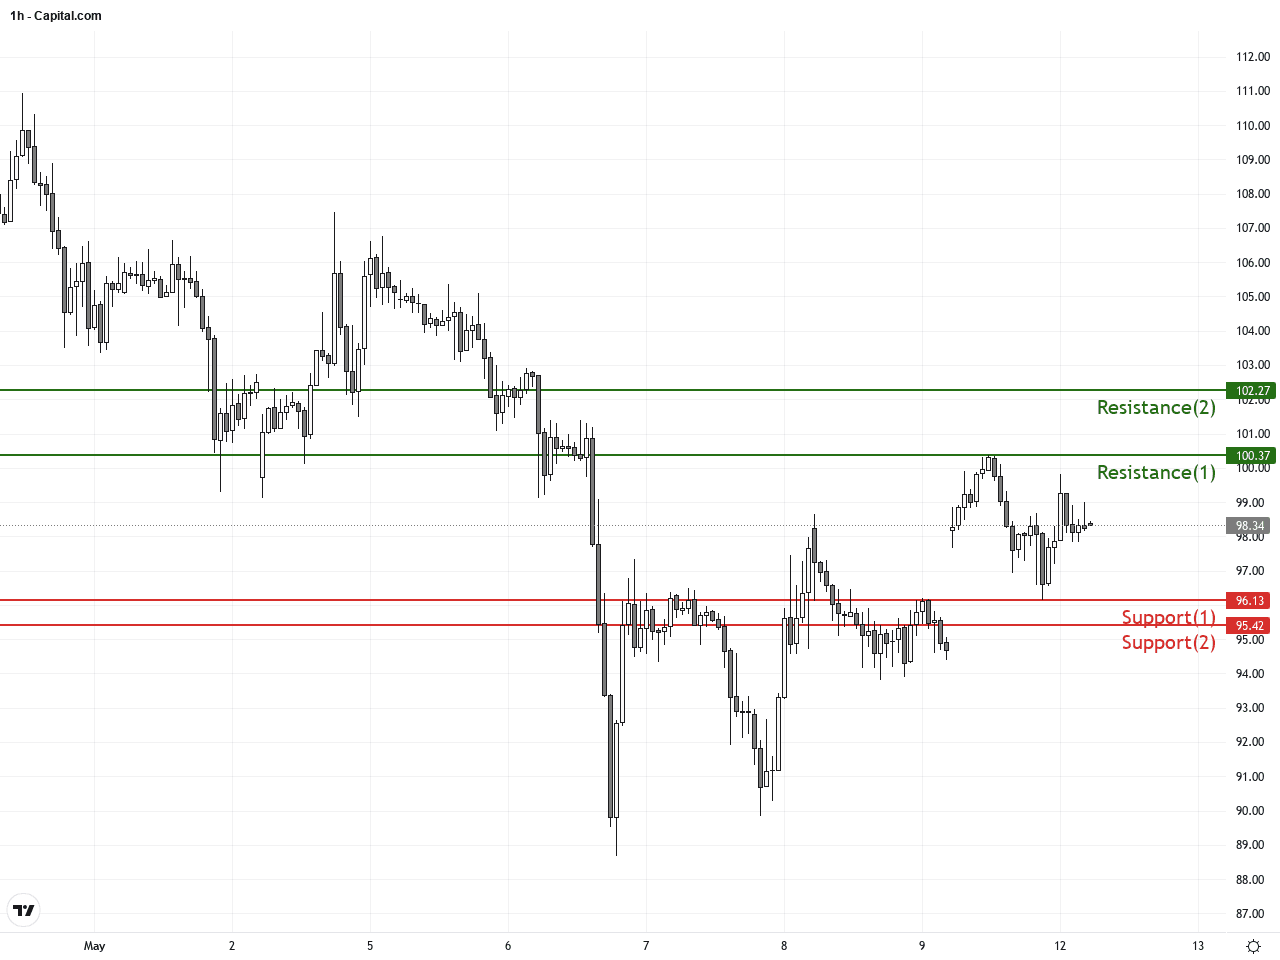
Over the last 3-5 trading days on the hourly chart, WTI price has been oscillating between $96 and $100, with short-term moving averages frequently crossing signaling rapid shifts in momentum. Price has repeatedly rebounded off the Bollinger Band middle line but has struggled to break above the key $100 psychological barrier convincingly. The MACD hovers around zero, while the recent hammer candlestick suggests short-term bullish support and the possibility of continued range-bound trading or slight pullbacks. Traders should watch for a breakout or breakdown to define the next significant move.
Technical Trend: WTI Crude Oil is currently in a ‘Sideways Consolidation’ phase with elevated volatility but no definitive trend direction.
Technically, WTI Crude is trading within a consolidation range with solid support near $95, limiting downside risk in the short term. Keep an eye on the MACD for a potential bullish crossover, which would likely spark a rebound. The recent hammer candlestick reflects buyer attempts to gain control intraday. Key resistance at $100 must be closely monitored along with the support at $95, as a break in either direction will provide clarity on the next trend. This setup offers tactical trading opportunities for nimble traders.There are no significant or direct economic events scheduled today that would impact WTI Crude Oil. Geopolitical developments in the Middle East will remain the primary driver for price fluctuations in the near term.
Resistance & Support
The above financial market data, quotes, charts, statistics, exchange rates, news, research, analysis, buy or sell ratings, financial education, and other information are for reference only. Before making any trades based on this information, you should consult independent professional advice to verify pricing data or obtain more detailed market information. 1uptick.com should not be regarded as soliciting any subscriber or visitor to execute any trade. You are solely responsible for all of your own trading decisions.