


 |
| Gold V.1.3.1 signal Telegram Channel (English) |

USDCAD: Testing Key Resistance as USD/CAD Trading Outlook Remains Cautious, May 14, 2026
2026-05-14 @ 13:01
The USD/CAD pair has shown relative stability over the past 24 to 48 hours, hovering modestly around yesterday’s closing price of 1.37049. The market sentiment remains cautious as traders hold back ahead of the upcoming US-China summit, resulting in a lack of decisive directional movement.
Recent market news highlights sustained pressure on the Canadian dollar, while the US dollar remains firm supported by recent US inflation data, keeping the pair around the 1.3700 level. The US Federal Reserve’s rate decision has continued to bolster the US dollar, and the latest Bank of Canada minutes indicated a moderately hawkish stance, influencing the currency dynamics to some extent. Overall, the US dollar continues to attract capital amid bullish momentum, while the Canadian dollar shows weakness amid declining risk appetite.
For the average investor, this period represents a ‘breather’ before major market events. The US dollar’s strength reflects confidence in US economic data and policy, whereas the Canadian dollar, closely tied to energy prices, appears more vulnerable amid shifts in global risk sentiment. With the US-China summit and subsequent potential market volatility on the horizon, investors should remain cautious and monitor policy developments and macroeconomic indicators closely, as these could drive the next directional trend for the pair.

The daily chart illustrates USDCAD consolidating between roughly 1.3650 and 1.3750 following a pullback from the recent yearly high at 1.41405. The 50-day moving average near 1.37464 continues to act as resistance, while the 200-day average is above at 1.38137. Bollinger Bands have tightened, indicating reduced volatility. The MACD histogram shows fading momentum suggesting that the pair may be waiting for a directional trigger in the medium term.
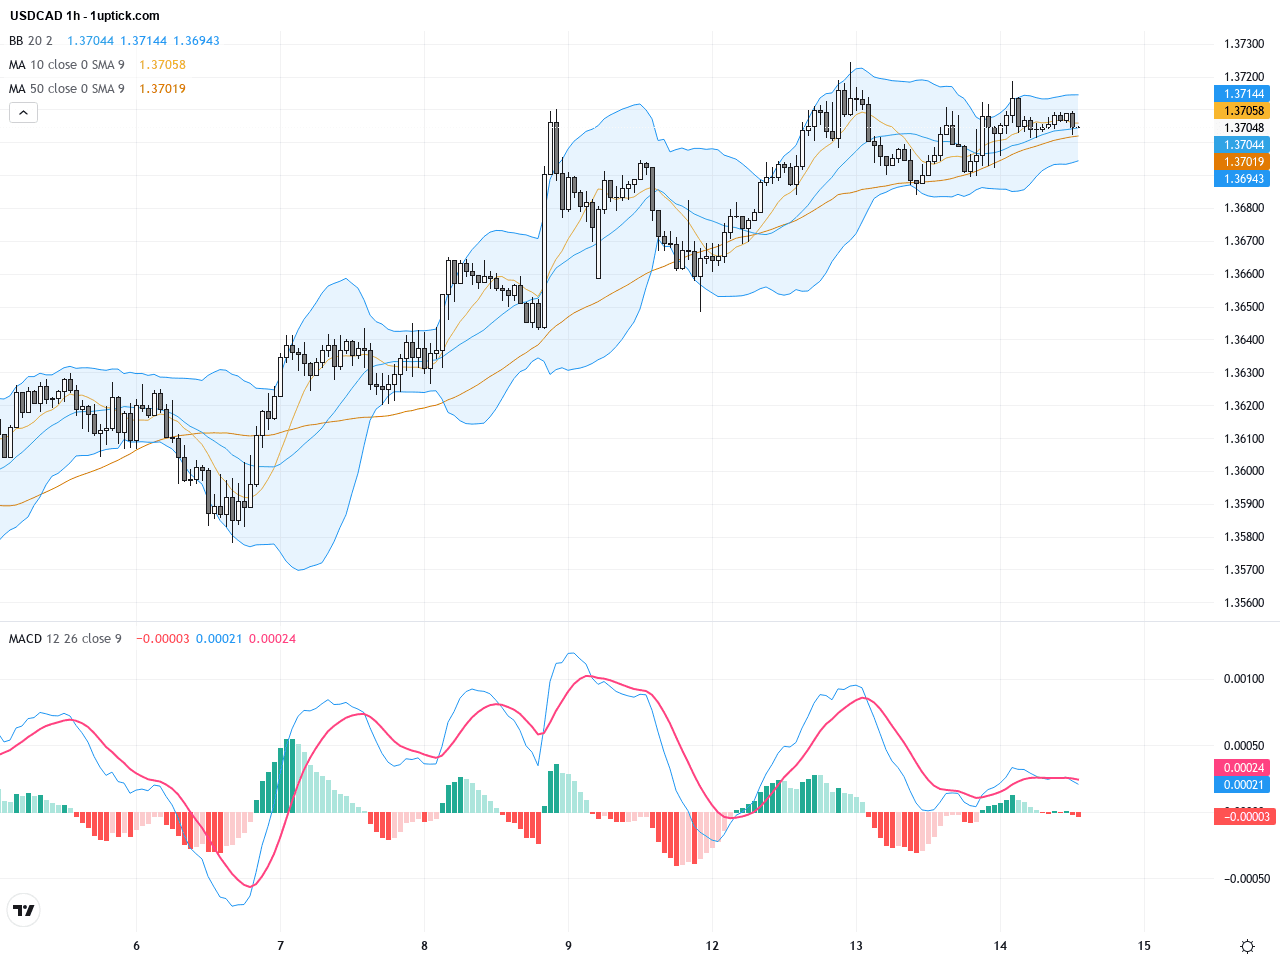
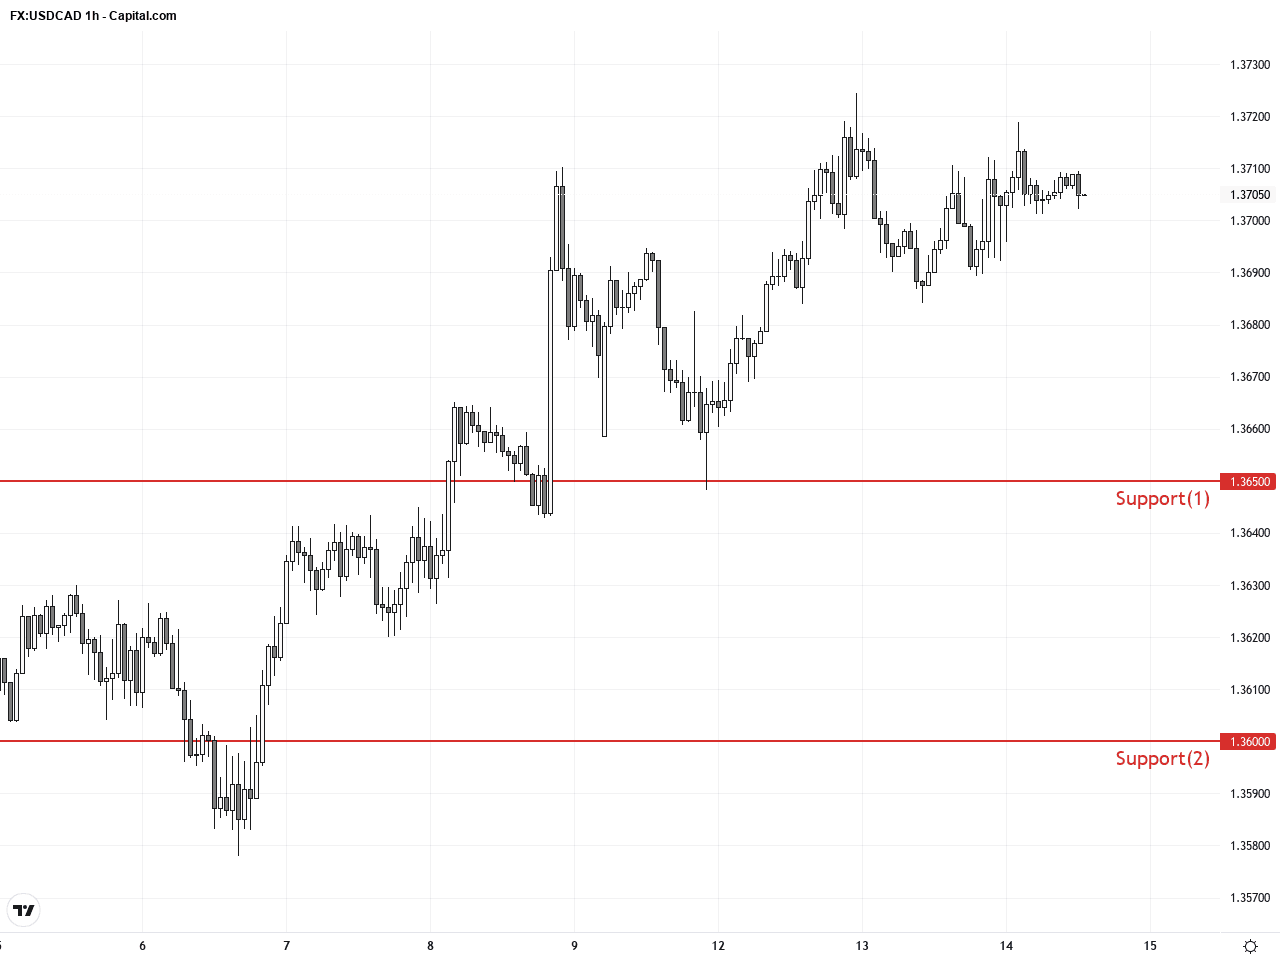
On the 4-hour chart covering the past 3-5 days, USDCAD fluctuates between 1.3650 and 1.3720. Short-term moving averages are intertwined, and the slightly widening Bollinger Bands imply growing short-term volatility. The MACD recently formed a bearish crossover, and RSI remains neutral, hinting at possible slight downside over the near term. The appearance of a bearish engulfing candlestick pattern reinforces the potential for a short-term pullback. Traders should watch whether immediate support levels hold.
Technical Trend: USDCAD is currently in a cautious consolidation phase without a clear directional trend, reflecting a watchful and indecisive market environment.
Technically, USDCAD on the daily chart is forming a symmetrical triangle consolidation, with price approaching the upper resistance border. A breakout, especially on higher volume, could trigger renewed upward momentum. However, the recent bearish engulfing on the 4-hour chart suggests a short-term reversal risk. MACD divergence on the daily timeframe signals waning momentum. Traders should exercise caution, look for confirmed breakout signals, and manage risk accordingly.Today’s economic calendar highlights Canadian wholesale trade data for March, forecasted to grow 1.5% month-over-month, down from 2% previously. Additionally, a cluster of US data releases at 14:30 GMT+1, including retail sales and import prices, may influence USD strength. Given that both the US and Canada are involved, these reports could spark volatility in USDCAD. From the Hong Kong perspective (HKT), these events will occur around 21:30, making it a key session for traders to monitor potential market moves.
Resistance & Support
The above financial market data, quotes, charts, statistics, exchange rates, news, research, analysis, buy or sell ratings, financial education, and other information are for reference only. Before making any trades based on this information, you should consult independent professional advice to verify pricing data or obtain more detailed market information. 1uptick.com should not be regarded as soliciting any subscriber or visitor to execute any trade. You are solely responsible for all of your own trading decisions.