 |
| Gold V.1.3.1 signal Telegram Channel (English) |
AUDUSD: Key Technical Reversal Signals Point to Bullish Momentum with Crucial Support and Resistance Levels, May 18, 2026
2026-05-18 @ 06:01
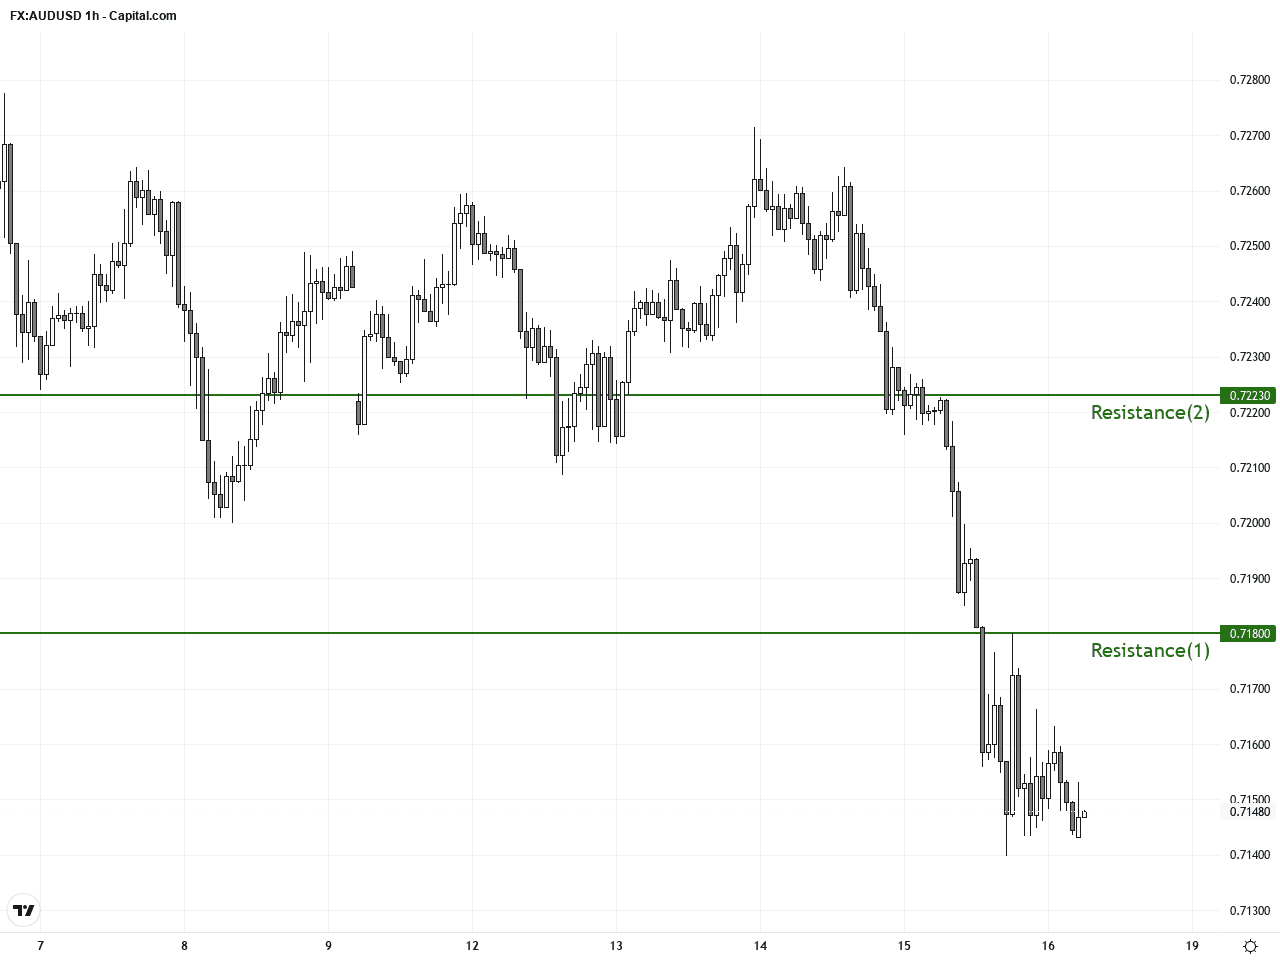
Over the past 24 to 48 hours, the Australian Dollar against the US Dollar (AUD/USD) has exhibited notable volatility, retreating from yesterday’s close of 0.72233 to around 0.71468. This pullback was driven by several factors, primarily the sustained strength of the US dollar and growing uncertainty around Australia’s economic outlook.
The recent market turbulence was triggered directly by comments from the US President, which pressured not only the DAX 40 index and copper prices but also risk-sensitive currencies like the AUD. The US dollar’s rally was fueled by hotter than expected inflation data that diminished expectations for Federal Reserve rate cuts, alongside a more hawkish US interest rate outlook that pushed investors into the dollar as a safe haven.
On the Australian front, the Reserve Bank of Australia’s (RBA) firm stance on higher interest rates amid rising oil prices and inflation risks, coupled with China’s weak recovery dampening demand prospects, weighed on the AUD. Given China is Australia’s largest trading partner, concerns over its growth trajectory have direct negative implications for the AUD/USD pair.
For everyday investors, this scenario can be understood as a global tug-of-war over risk sentiment. US policy and data are boosting the dollar’s value while apprehensions over Australia’s growth prospects increase selling pressure on the AUD. Going forward, if US inflation remains stubbornly high and geopolitical or energy market risks persist, the AUD/USD pair may continue to face downward pressure.
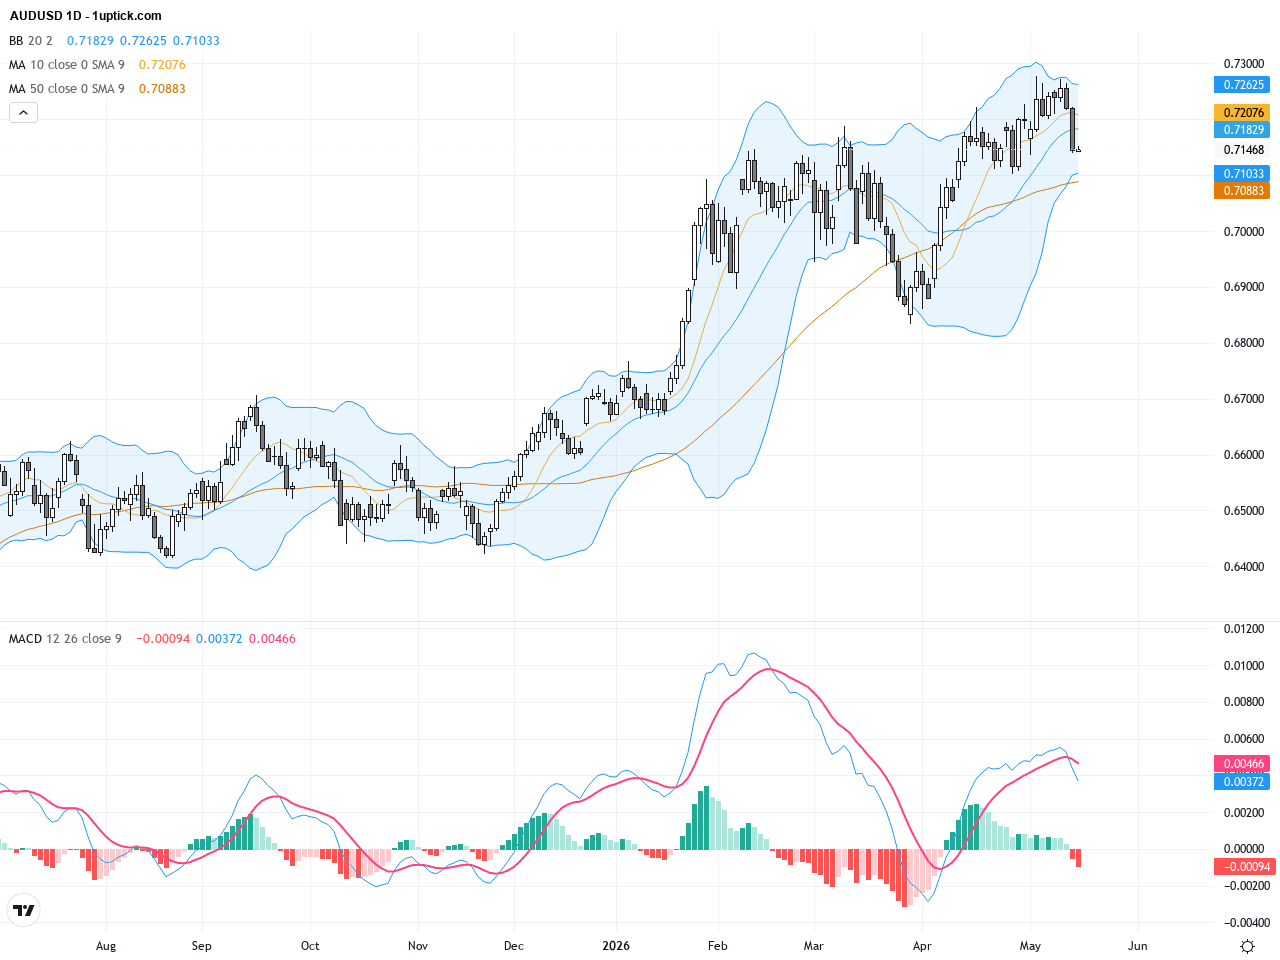
The daily chart shows AUDUSD fluctuating within a range between approximately 0.7085 and 0.7277. The 50-day moving average near 0.70852 serves as key support, while the 200-day moving average around 0.67668 maintains a long-term uptrend. Recently, a breakout from the mid-term downtrend has signaled a reversal, with Bollinger Bands shifting from contraction to expansion indicating rising volatility. The MACD histogram turning from negative to positive suggests the reemergence of bullish momentum. Overall, the daily chart points toward a transition from corrective phase to a developing uptrend, favoring long-term buyers.
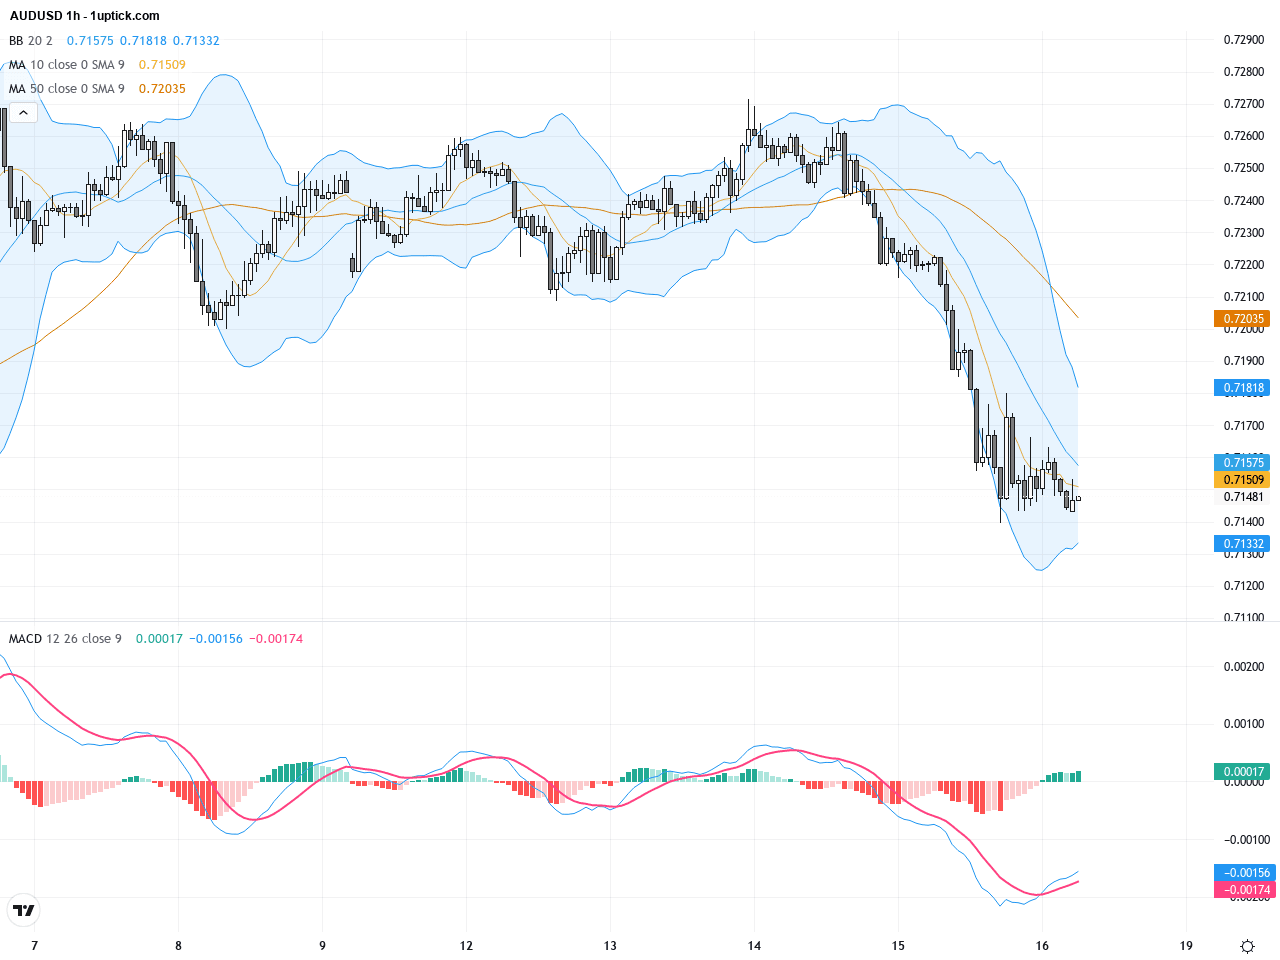
In the last 3-5 days visible on the hourly chart, AUDUSD has shown increased volatility. Prices remain above the intermediate moving averages; a golden cross of short-term over long-term averages has formed. An early-stage inverse head and shoulders pattern is identifiable from late April to mid-May, signaling potential upside breakout. The most recent bullish engulfing candlestick, formed late on May 17, implies positive momentum for the next 24 hours. The MACD lines continue to rise with increasing volume, indicating that short-term traders should watch for breakout opportunities.
Technical Trend: The trend exhibits clear reversal signals, currently showing a cautiously bullish stance.
Technically, AUDUSD is showing signs of a bullish reversal with completion of its corrective phase. The daily MACD golden cross indicates strengthening momentum. Hourly chart patterns such as the inverse head and shoulders, together with a bullish engulfing candle, point to the potential continuation of upward momentum. Given persistent pressure from a stronger USD, traders are advised to monitor key resistance breakouts and consider staggered entries to manage risk effectively.There are no significant or directly relevant economic events scheduled today that will impact AUDUSD. Price movements will mainly be driven by technical factors and market sentiment, as traders digest ongoing geopolitical risks and central bank commentary.
Resistance & Support
The above financial market data, quotes, charts, statistics, exchange rates, news, research, analysis, buy or sell ratings, financial education, and other information are for reference only. Before making any trades based on this information, you should consult independent professional advice to verify pricing data or obtain more detailed market information. 1uptick.com should not be regarded as soliciting any subscriber or visitor to execute any trade. You are solely responsible for all of your own trading decisions.