 |
| Gold V.1.3.1 signal Telegram Channel (English) |
GBPUSD: Key Bullish Reversal Pattern Signals Potential Sterling Support, May 20, 2026
2026-05-20 @ 13:01
Over the past 24 to 48 hours, the GBP/USD currency pair has experienced notable volatility, starting near yesterday’s close at 1.33904 and initially rebounding before retreating. The British Pound was primarily influenced by a combination of weak UK employment data and political turmoil, both adding layers of uncertainty to the financial market and intensifying risk-off sentiment.
Meanwhile in the U.S., hotter-than-expected April Consumer Price Index (CPI) figures alongside diplomatic progress from the Trump-Xi summit lent support to the U.S. Dollar Index (DXY), bolstering its strength. This dynamic put short-term pressure on GBP/USD, as investors gear up for upcoming U.S. labor market data that could further sway dollar valuations.
For the average investor, this currency market turbulence reflects multiple crosscurrents: the UK economy faces headwinds from slowing hiring and a rising unemployment rate, dampening expectations for near-term Bank of England rate hikes; concurrently, stronger U.S. economic indicators increase the dollar’s appeal, limiting pound gains. As a result, the GBP/USD pair is likely to remain pressured in the near term, urging investors to stay vigilant on global economic and geopolitical developments while adapting their investment approach accordingly.

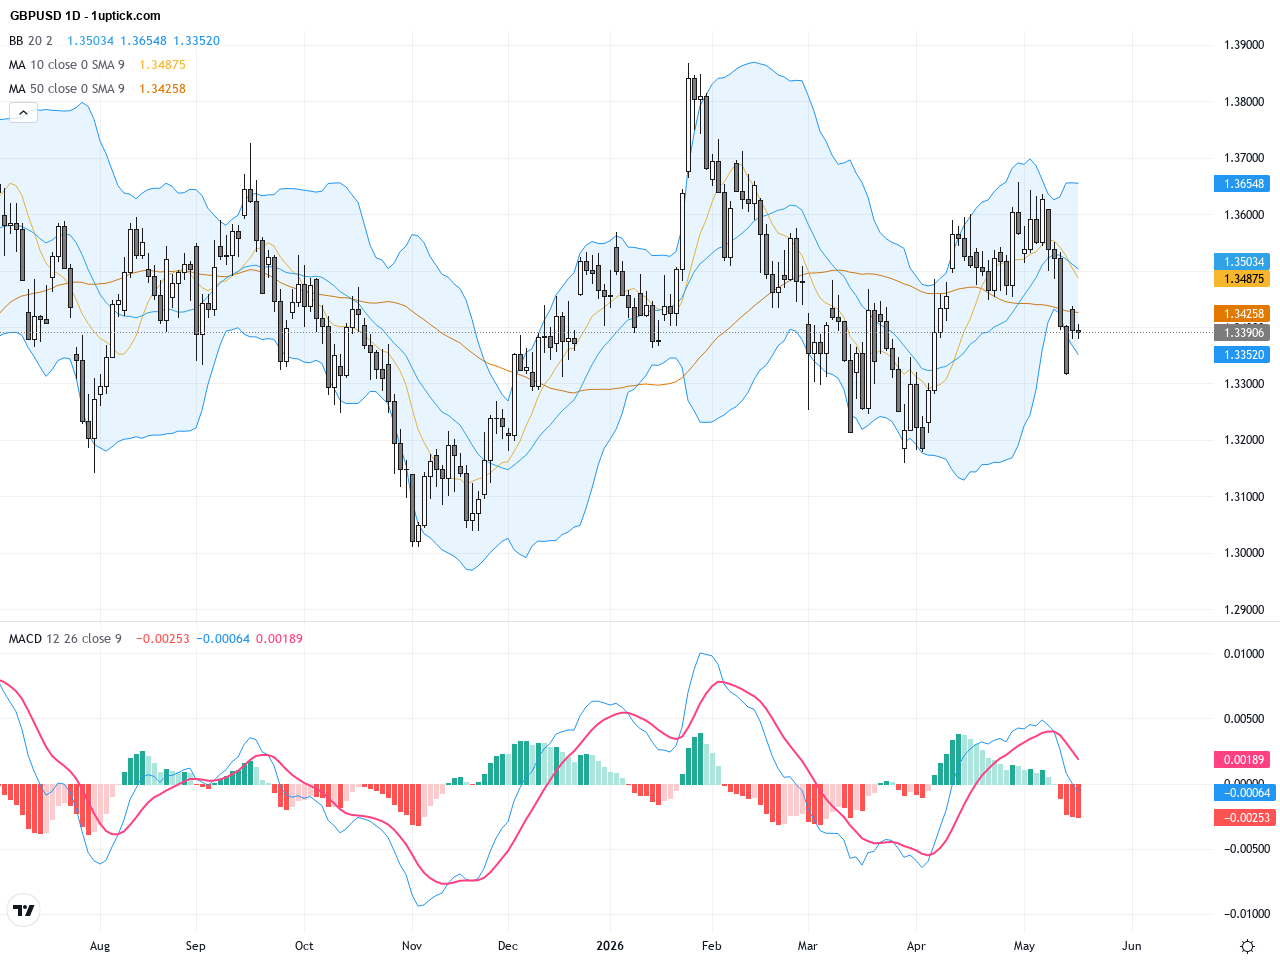
The daily chart reveals an overall downtrend for GBPUSD since the start of the year, with recent price consolidating around the 1.3400 level. Bollinger Bands are narrowing, and price is hovering near the 20-day and 50-day moving averages, implying balanced supply and demand. The MACD is oscillating near the zero line, indicating no clear momentum. Watch for potential moving average crossovers signaling medium-term directional shifts.
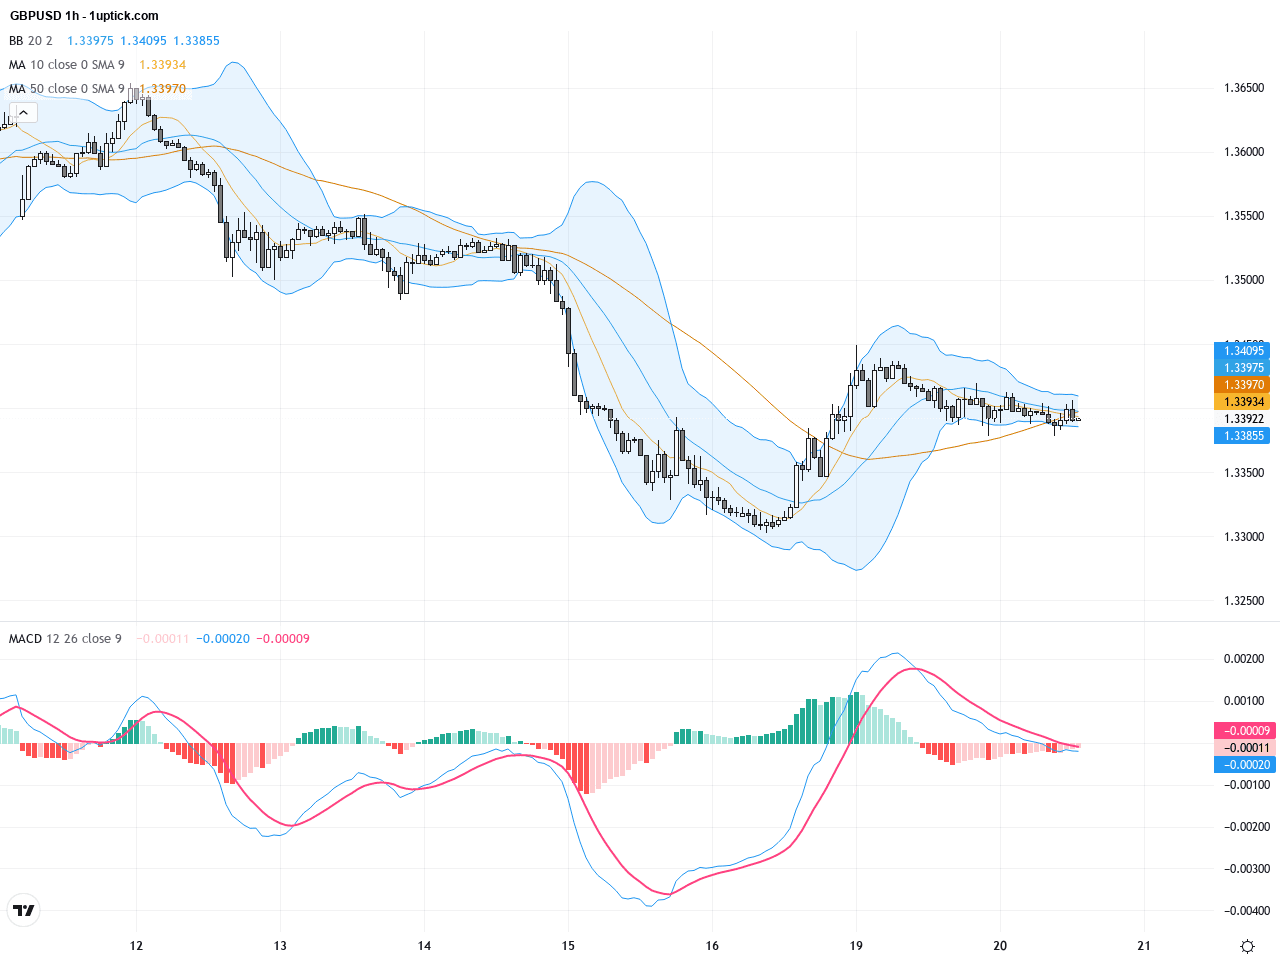
The last five days on the hourly chart show GBPUSD descending from 1.3410 to a low of 1.3365, forming a potential double bottom reversal pattern. The 20-hour moving average supports price, while Bollinger Bands slightly widen indicating expanding volatility. Recent candlesticks include a bullish engulfing pattern, suggesting increased chances of a short-term rebound. The MACD histogram shifting from negative to positive supports strengthening bullish momentum.
Technical Trend: GBPUSD is currently in a cautiously bullish consolidation phase, exhibiting a volatile sideways pattern as the market seeks a clear direction.
Technically, GBPUSD shows critical bullish reversal clues with solid support forming after a weakening trend on the daily chart, confirmed by the bullish engulfing candlestick on the hourly chart. The MACD zero-line crossing and expanding Bollinger Bands indicate a probable short-term rally. Market concerns over UK labor and political risks remain, which may amplify volatility. Monitoring volume and key technical levels is advised for trend confirmation.Today, key UK inflation data including Consumer Price Index (CPI), Core CPI, and Retail Price Index (RPI) are scheduled for release at 08:00 GMT+1. Forecasts expect a slight easing compared to previous readings. If data aligns or beats expectations, it may bolster sterling gains. Beyond these, there are no other significant direct events likely to impact GBPUSD today. Traders should watch closely the UK morning session for clues on BoE’s policy outlook.
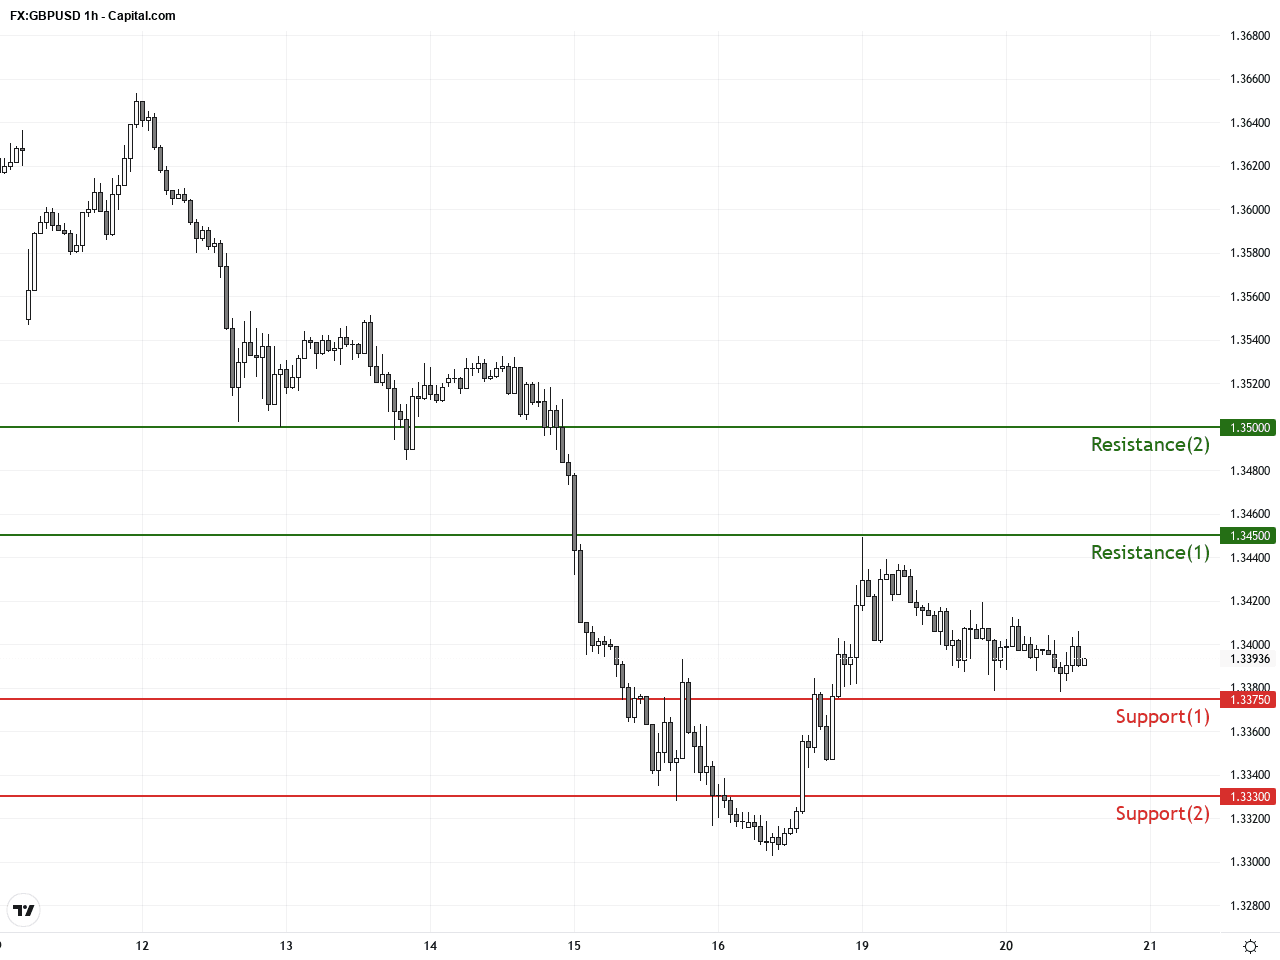
Resistance & Support
The above financial market data, quotes, charts, statistics, exchange rates, news, research, analysis, buy or sell ratings, financial education, and other information are for reference only. Before making any trades based on this information, you should consult independent professional advice to verify pricing data or obtain more detailed market information. 1uptick.com should not be regarded as soliciting any subscriber or visitor to execute any trade. You are solely responsible for all of your own trading decisions.