


 |
| Gold V.1.3.1 signal Telegram Channel (English) |

USDCAD: Key Resistance Tests Set the Tone for Bullish Trading Outlook, May 26, 2026
2026-05-26 @ 13:01
Over the past 24 to 48 hours, the US Dollar to Canadian Dollar (USDCAD) pair has experienced notable volatility, with yesterday’s closing price at 1.38112. The primary drivers behind a slight dip in the US dollar were growing optimism over a potential Iran deal and swings in oil prices.
Specifically, investors closely tracked progress in a peace agreement between Iran and the US, which bolstered the Canadian dollar amid expectations that reopening the Strait of Hormuz would enhance Canadian energy exports. At the same time, fluctuations in oil prices, which rose on this news, generally benefited the Canadian dollar and pressured the US dollar.
For the average investor, this means recent market sentiment has been heavily influenced by geopolitical developments. These external factors can rapidly sway currency movements, causing the previously strong dollar to pull back. Given the strong correlation between the Canadian dollar and oil prices, any shifts in the oil market or geopolitical progress are likely to immediately impact the USDCAD exchange rate.

The daily chart shows USDCAD in a generally steady uptrend, rallying from the month’s low near 1.34813 to a recent peak around 1.38112. The price remains above the 200-day moving average (~1.38059), signaling a sustained medium- to long-term bullish bias. Bollinger Bands are slightly expanding, indicating increasing volatility, with momentum poised to extend the upward move as MACD approaches a golden cross.
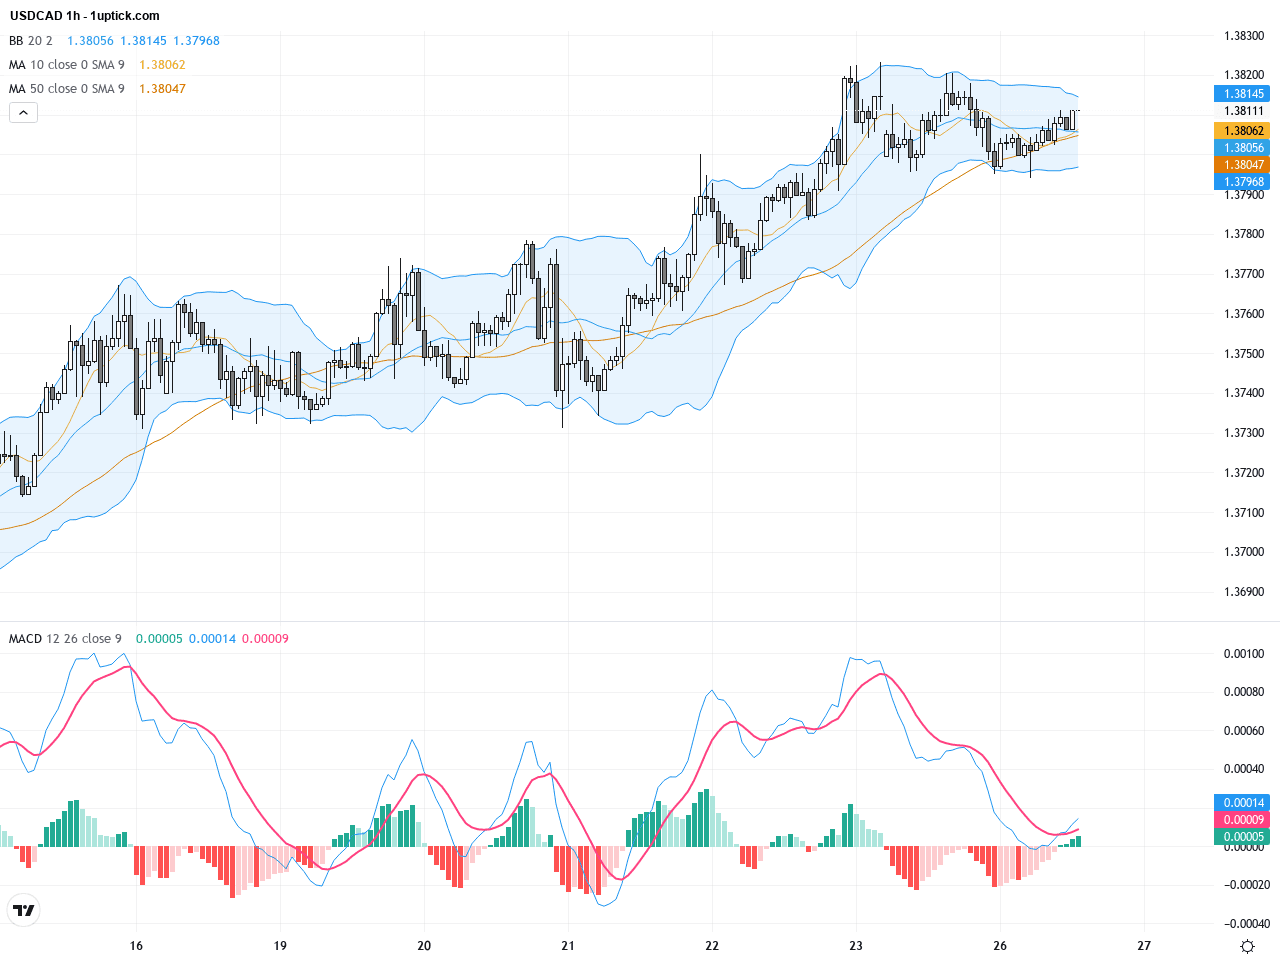
On the hourly chart over the last 3 to 5 days, USDCAD has oscillated mostly between 1.374 and 1.381, with short-term moving averages aligned bullishly. Bollinger Bands show signs of expansion after a squeeze, suggesting a possible breakout soon. The MACD line crossing above the signal line, accompanied by expanding histogram bars, confirms rising upward momentum. A break above resistance near 1.381 could trigger further gains.
Technical Trend: The prevailing trend is ‘Decisively Bullish.’ Price action remains above key moving averages with momentum indicators supporting further upside, though watch for resistance breakthroughs.
Technically, USDCAD’s immediate momentum is driven by a bullish MACD crossover and expanding Bollinger Bands. The daily price remains anchored above the critical 200-day moving average, sustaining an overall bullish structure. A notable ascending triangle has formed near the 1.381 resistance zone—if broken decisively, it may propel the pair toward yearly highs. Recent bullish engulfing candlestick suggests strength in the next 24 hours to continue higher.Today’s economic calendar in GMT+1 highlights key US data releases later tonight, including the S&P/Case-Shiller Home Price Indices and Consumer Confidence Index, scheduled between 21:00 and 23:00 HKT. No major events are expected during current HK trading hours that could significantly move USDCAD intraday. Traders should monitor these releases as they may influence price action into the US session.
Resistance & Support

The above financial market data, quotes, charts, statistics, exchange rates, news, research, analysis, buy or sell ratings, financial education, and other information are for reference only. Before making any trades based on this information, you should consult independent professional advice to verify pricing data or obtain more detailed market information. 1uptick.com should not be regarded as soliciting any subscriber or visitor to execute any trade. You are solely responsible for all of your own trading decisions.