









 |
| Gold V.1.3.1 signal Telegram Channel (English) |
USDJPY: Technical Breakout and Key Support-Resistance Levels Signal Continued Uptrend, May 29, 2026
2026-05-29 @ 11:01
Over the past 24 to 48 hours, USD/JPY exhibited a modest upward trend, closing yesterday around 159.31, slightly higher than the previous day. The movement was primarily driven by news of the US-Iran ceasefire extension, which boosted risk appetite and supported the US dollar. Compared to earlier volatility in the dollar index, the USD/JPY pair experienced moderate fluctuations influenced by shifting geopolitical tensions, with the dollar’s early gains curbed by disappointing US economic data but later recovering on renewed hopes for peace.
Put simply, for everyday investors, this price action indicates that despite ongoing geopolitical concerns, the continuation of the ceasefire has helped stabilize market sentiment and increased demand for the dollar, supporting USD/JPY prices. If you hold dollar or yen assets, this recent movement signals improved risk appetite and stronger dollar demand, creating a relatively stable outlook. The market has also been paying attention to the yen’s liquidity drain due to holidays and potential Bank of Japan interventions, adding some volatility to the USD/JPY pair.
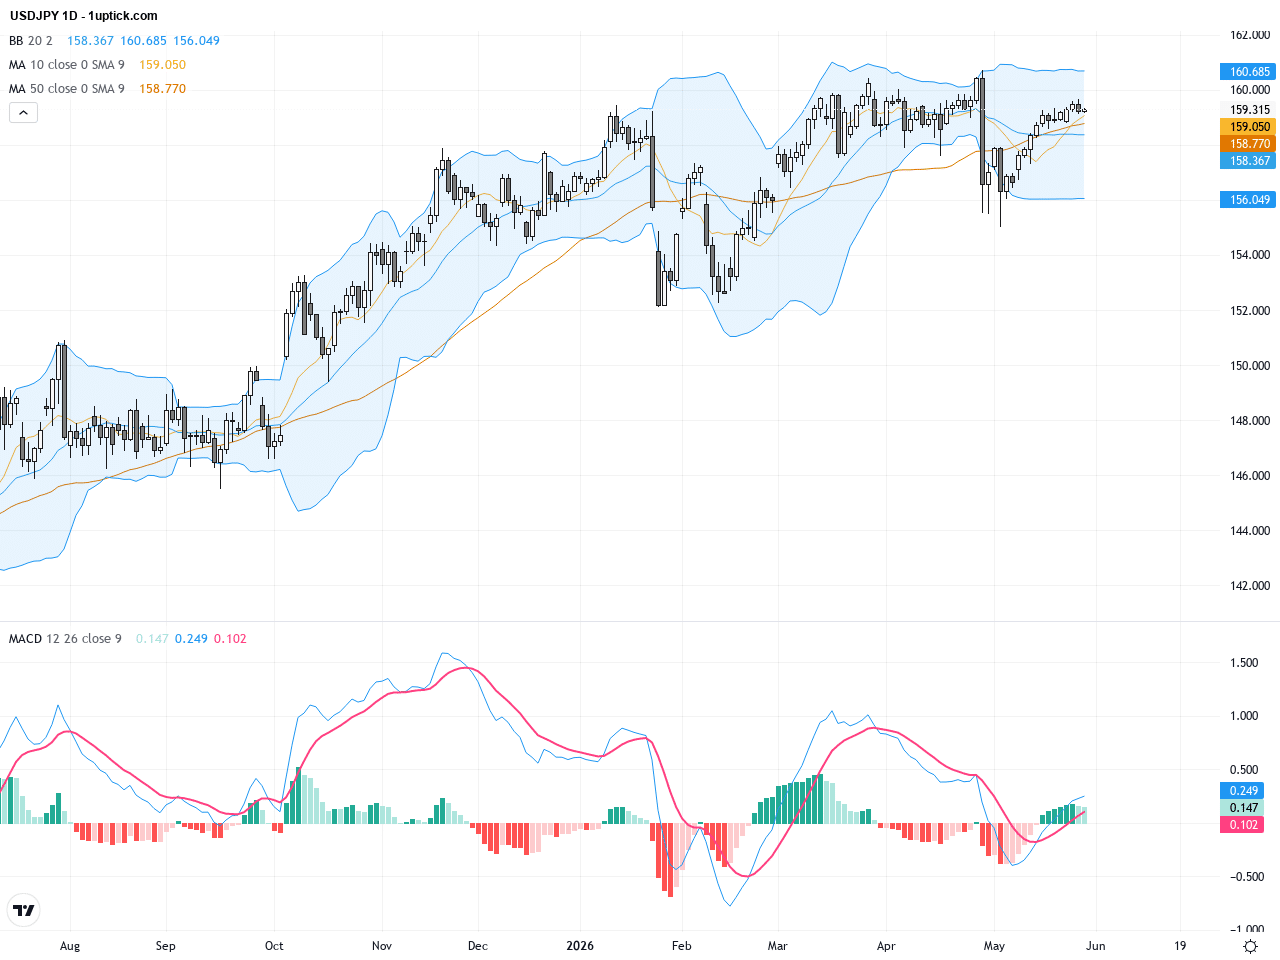
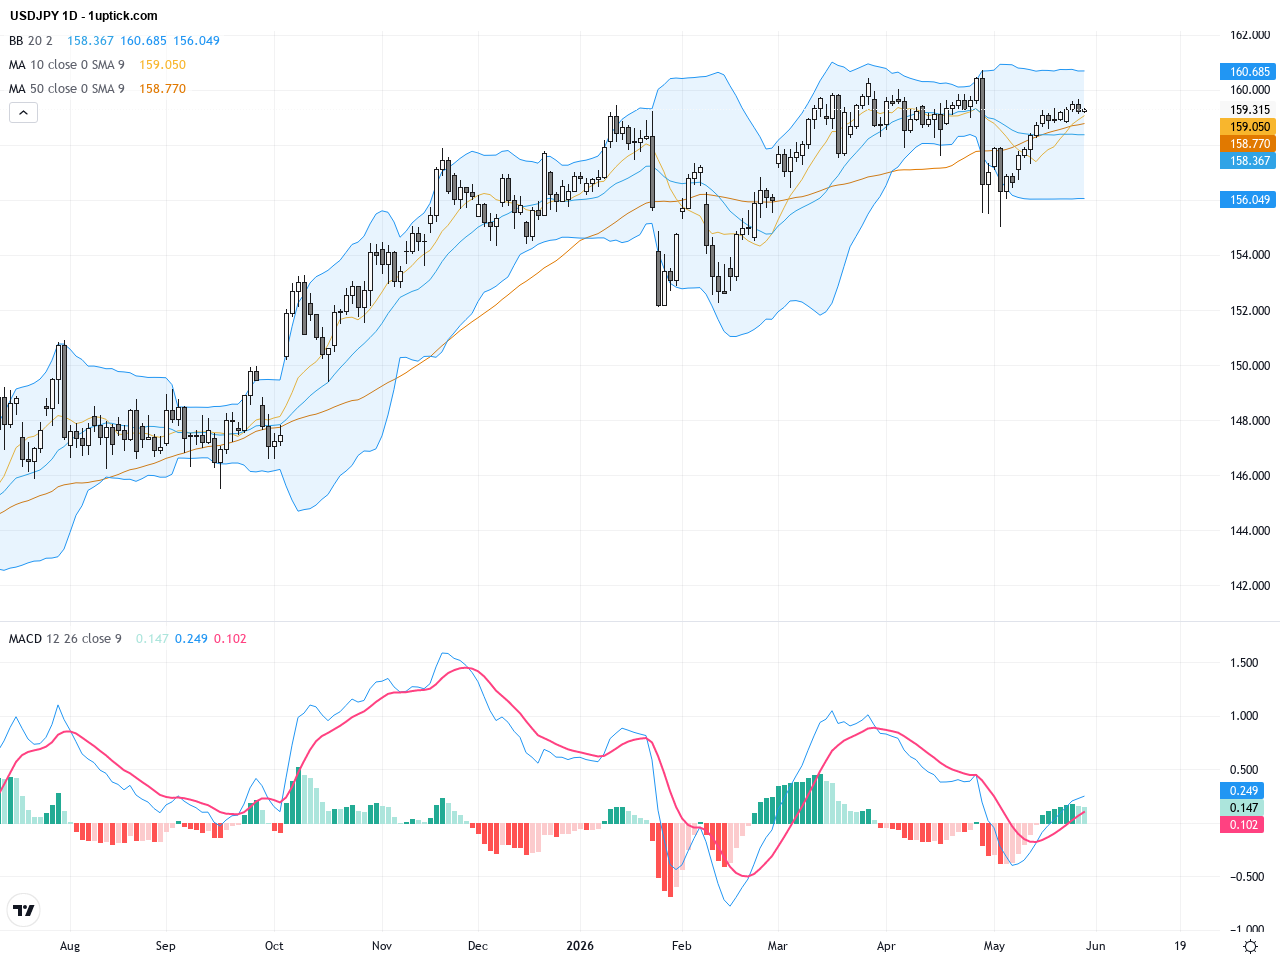
The daily chart shows USDJPY in a steady upward trajectory over recent months, decisively breaking above the 200-day moving average near 154.95 and maintaining position above the 50-day average at approximately 158.77, reinforcing medium to long-term bullish momentum. Bollinger Bands have widened, indicating increased volatility, while MACD histogram expands above zero, signaling strong buying pressure. Price has pushed from mid-156 to above 159 in a series of progressively higher highs and lows, forming a bullish flag continuation pattern.
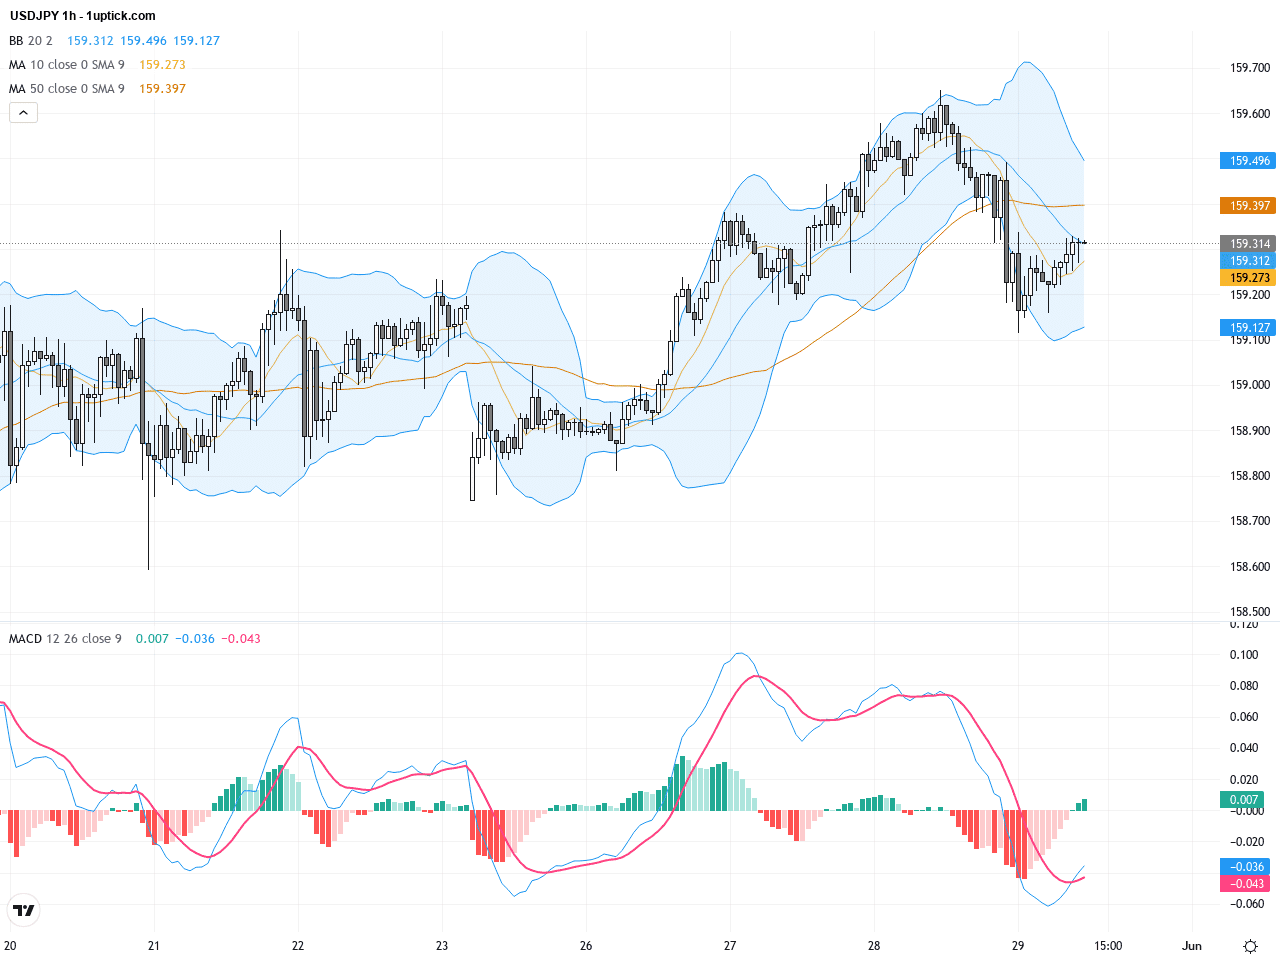
On the hourly chart, USDJPY demonstrates a clear uptrend over the past 3-5 days, trading between 159 and 159.5, with short-term moving averages aligned bullishly—especially the 5 and 10-hour averages providing firm support. An MACD bullish crossover and RSI near 70 suggest potential short-term overbought conditions, signaling a possible brief correction, yet buying interest remains intact. The recent bullish engulfing candlestick hints at sustained upside momentum within the next 24 hours.
Technical Trend: A clearly bullish trend showing steady upward movement, best described as decisively bullish.
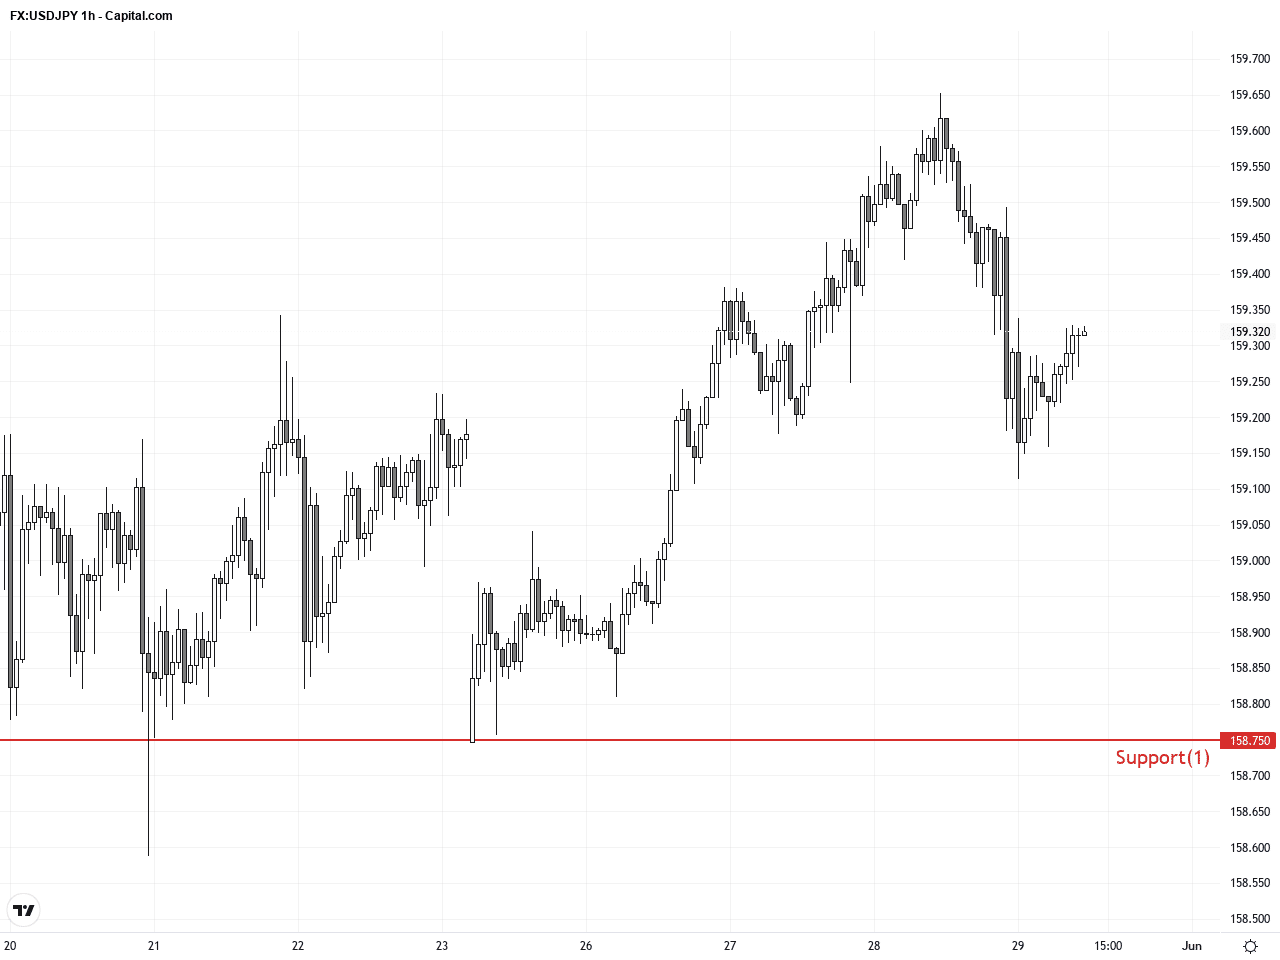
From a technical standpoint, USDJPY recently established a bullish flag pattern supported by key moving averages like the 50- and 200-day MAs. Daily MACD is positive with expanding Bollinger Bands demonstrating strong momentum. The hourly 5-10 MA golden crossover combined with an RSI approaching overbought suggests caution for a possible short-term dip, yet the overall trend remains bullish. Crucial resistance lies between 159.8 and 160.7; a breakout beyond these levels could push the pair toward yearly highs. Traders should monitor bullish engulfing candles and breakout confirmations for high-probability entries.Today’s GMT+1 economic calendar focuses heavily on Japanese data including May core CPI, unemployment rate, industrial production, and retail sales. Core CPI forecast sits at 1.5% y/y; a figure below that may weaken the yen and benefit USDJPY gains. Strong retail sales and industrial production data will further support the pair’s uptrend. While other US and EU releases are scheduled, their direct impact on USDJPY is minimal. Hence, the Japanese data releases are the key drivers for the currency pair’s short-term outlook today.
Resistance & Support
The above financial market data, quotes, charts, statistics, exchange rates, news, research, analysis, buy or sell ratings, financial education, and other information are for reference only. Before making any trades based on this information, you should consult independent professional advice to verify pricing data or obtain more detailed market information. 1uptick.com should not be regarded as soliciting any subscriber or visitor to execute any trade. You are solely responsible for all of your own trading decisions.