
 |
| Gold V.1.3.1 signal Telegram Channel (English) |

XAUUSD Gold Trading Outlook: Rebound Amid Oil Price Retreat with Key Technical Patterns, June 5, 2026
2026-06-05 @ 05:05
Over the past 24 to 48 hours, the gold (XAUUSD) market has experienced notable volatility. Gold closed at $4475.03 on June 4, 2026, slightly up from the previous day’s close of $4434.71. Multiple intertwined factors have influenced price movements recently. The retreat in oil prices provided support for gold, especially with Brent crude falling approximately 3.3%, sparking traders’ hopes that US economic policies might ease inflation pressures, prompting a rebound in gold prices.
Meanwhile, rising US-Iran tensions and increased oil prices fueled inflation fears, weighing on gold at certain periods and causing some downward pressure. The market is also cautiously awaiting the US payroll report, adding uncertainty among investors. Furthermore, a recent European Central Bank report highlighted that gold has overtaken US Treasurys as the world’s top central bank reserve asset, boosting gold’s long-term appeal. Overall, the gold market in the last two days reflects global economic policy uncertainties coupled with geopolitical turbulence. For average investors, gold’s role as a safe-haven asset is increasingly prominent amidst these factors, but short-term price swings remain sharp, calling for careful trading strategies.
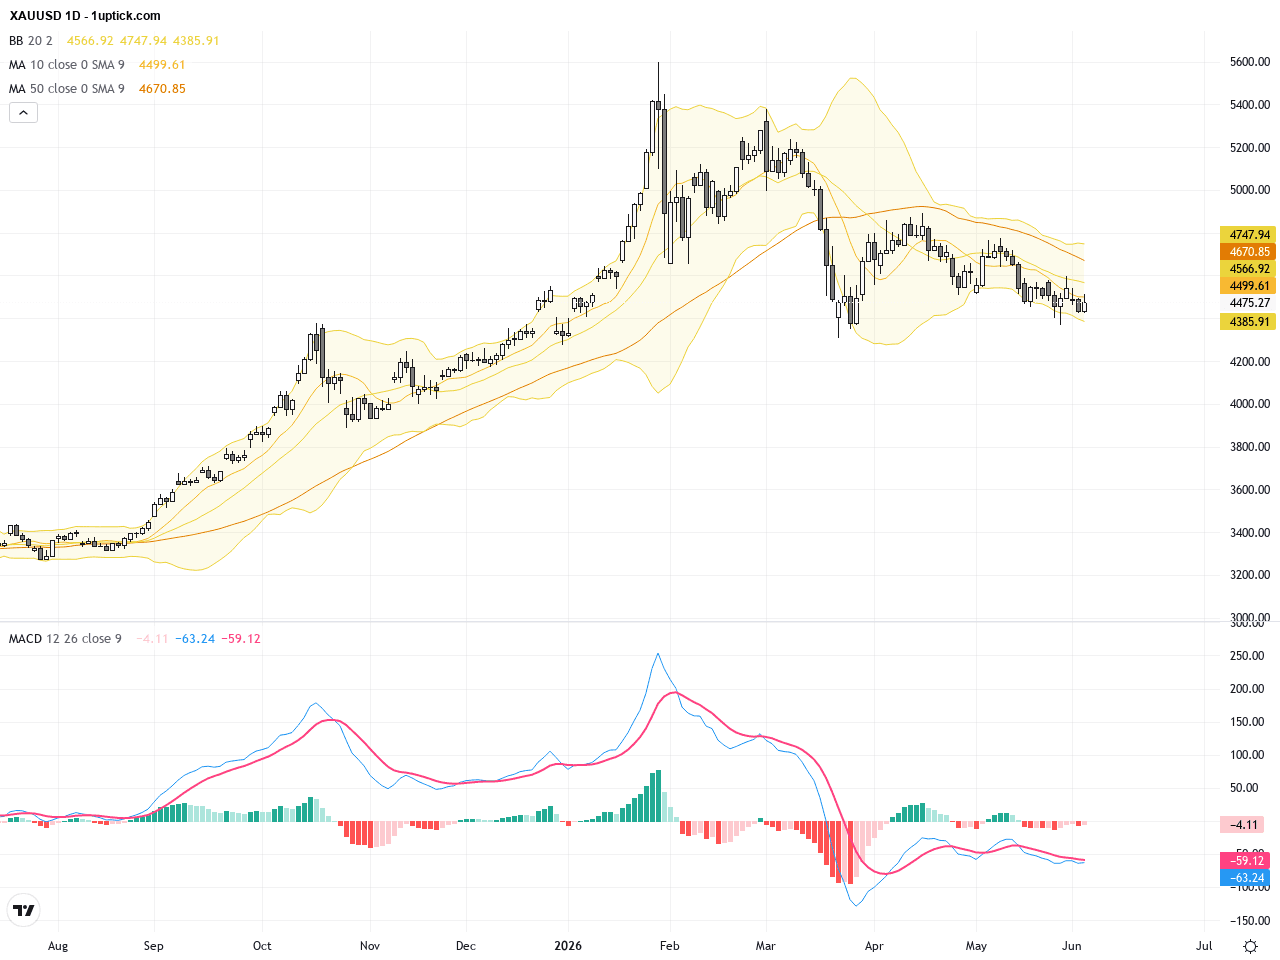
The daily chart of XAUUSD shows a recent wave of volatility with price oscillating between highs near 4512 and lows around 4475. Moving averages are converging, indicating potential consolidation and a pause in momentum. Bollinger Bands are narrowing, suggesting reduced volatility and balance between buyers and sellers. The MACD indicator hints at a subtle bullish crossover, signaling possible upcoming upward momentum, but confirmation is needed.
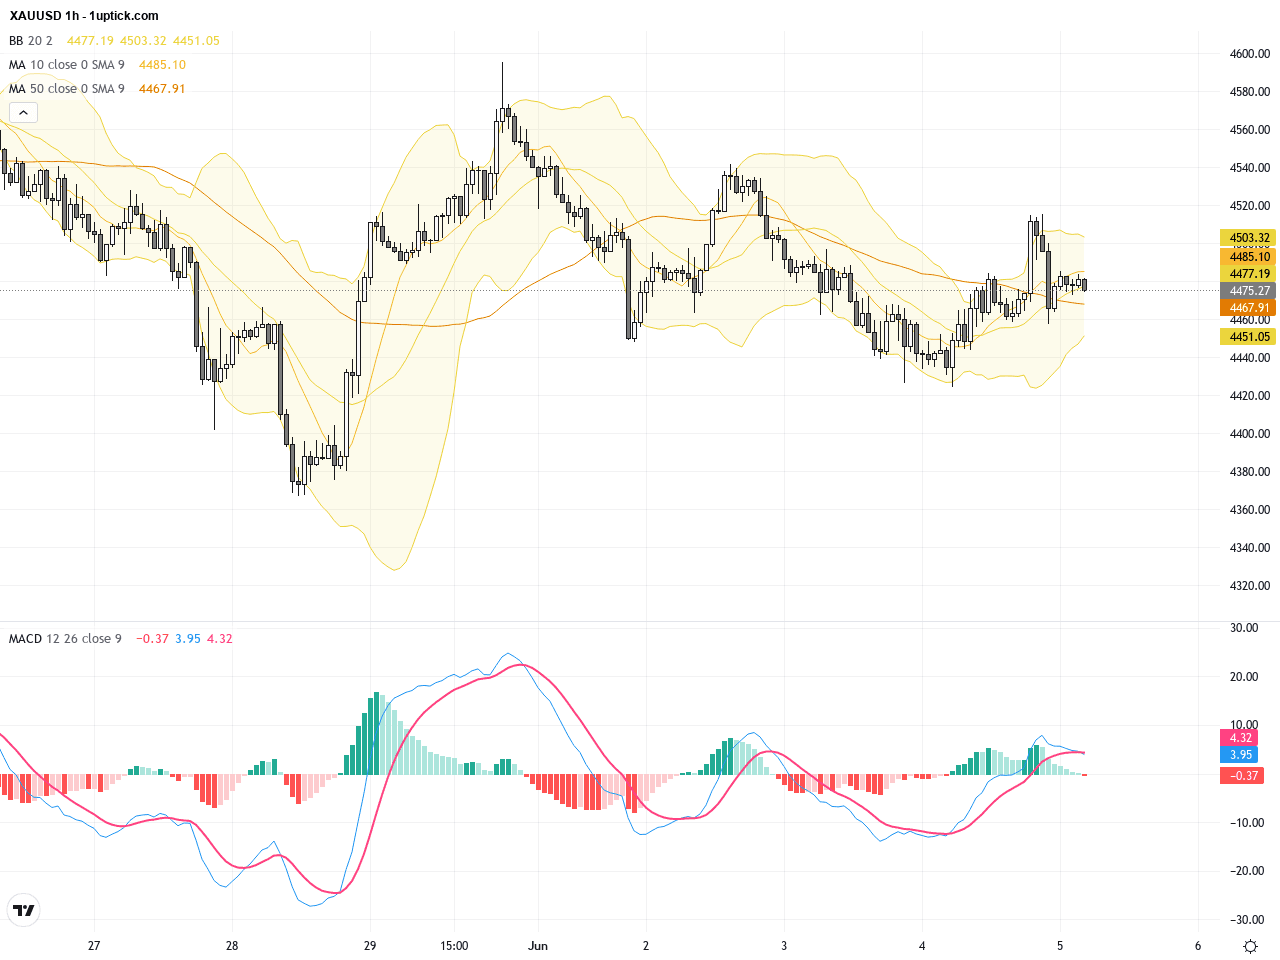
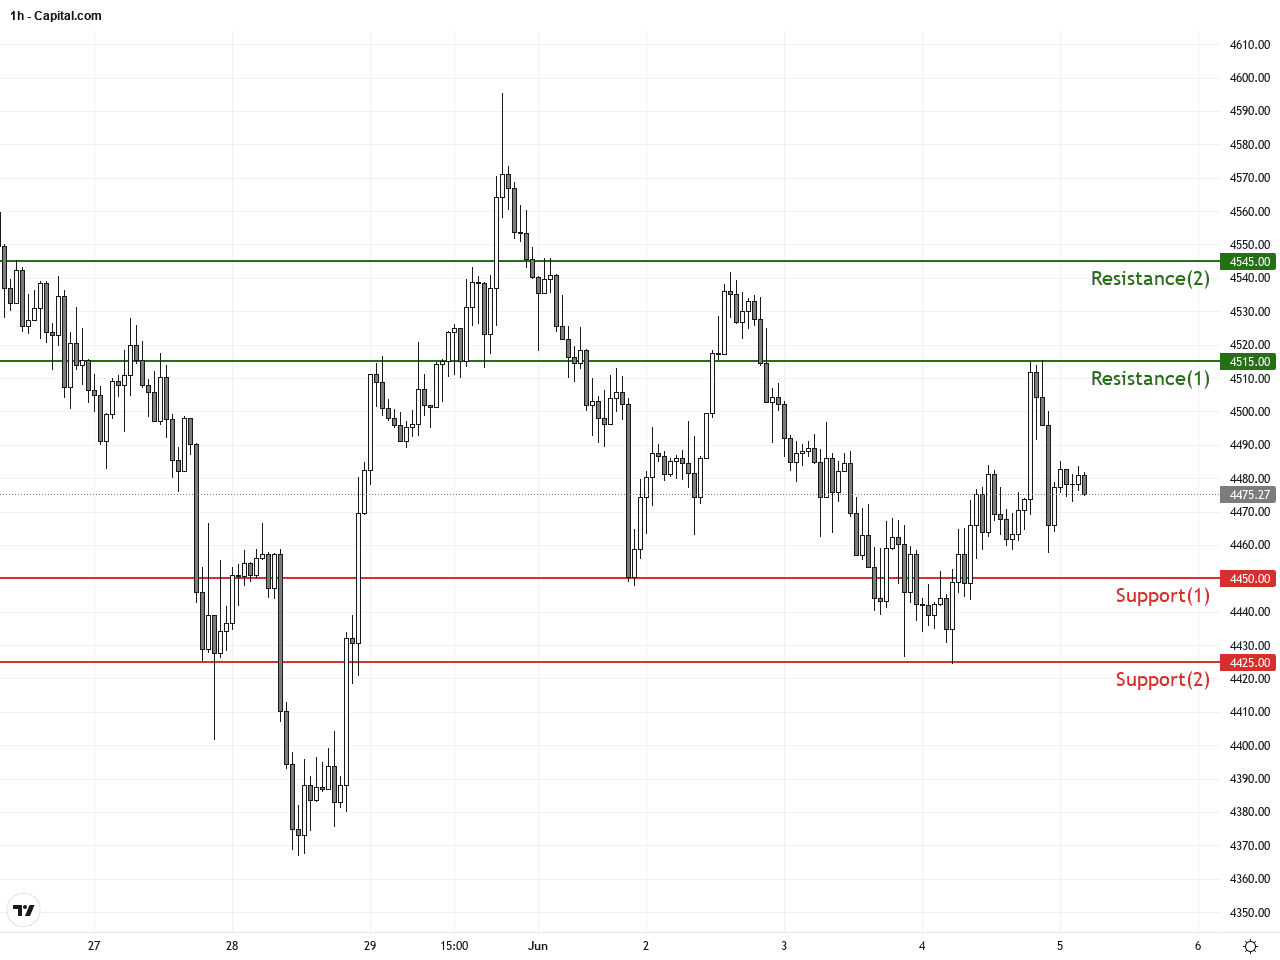
On the hourly chart, across the past five days, XAUUSD experienced a sharp rise from 4450 to 4515 followed by a retracement into a range-bound trading between these levels. Short-term moving averages are entangled with Bollinger Bands tightening, indicating a lack of clear direction. The MACD suggests waning momentum. A rectangle consolidation pattern is forming, where a breakout above 4515 resistance or a breakdown below 4450 support will dictate the near-term trend.
Technical Trend: XAUUSD is currently in a cautious sideways consolidation with potential for a breakout on the upside.
Technically, XAUUSD is in a cautious sideways consolidation phase. The daily chart’s MACD and tightening Bollinger Bands indicate a higher probability for a rebound. However, mixed signals from oil prices and the US dollar create a tug of war. The hourly consolidation pattern near critical resistance at 4515 points to a potential breakout scenario which traders should watch closely. Recent candlestick formations suggest indecision, urging caution in directional bets.Today’s GMT+1 economic calendar presents no significant or direct economic events expected to affect XAUUSD. Releases such as Australia’s trade balance and Sweden’s CPI data will not directly influence gold prices. Crucial US labor and inflation data are due tomorrow. Hence, traders should focus on market sentiment drivers beyond today’s scheduled data for gold price movement.
Resistance & Support
The above financial market data, quotes, charts, statistics, exchange rates, news, research, analysis, buy or sell ratings, financial education, and other information are for reference only. Before making any trades based on this information, you should consult independent professional advice to verify pricing data or obtain more detailed market information. 1uptick.com should not be regarded as soliciting any subscriber or visitor to execute any trade. You are solely responsible for all of your own trading decisions.