


 |
| Gold V.1.3.1 signal Telegram Channel (English) |

EURUSD: Critical Technical Pattern Signals Risk of Further Decline with Key Trading Outlook, June 8, 2026
2026-06-08 @ 09:01
Over the past 24 to 48 hours, the EUR/USD currency pair has shown notable volatility with strong price swings. The closing price yesterday settled at 1.15336, showing a slight rise compared to before, yet the overall market sentiment remains weak. Key drivers behind this movement include rising geopolitical tensions and higher international oil prices, both adding downward pressure on the euro.
According to the latest report titled “EUR/USD risks deeper decline as three-wave recovery appears complete,” the return of US dollar strength has curtailed attempts at euro recovery. While the euro sought support around the 1.1600 level, persistent global uncertainties and firm US monetary stance have prompted investors to favor the dollar as a safe haven, placing the euro under intensified downward pressure.
For the average investor, this market behavior means that those holding or considering buying euros should closely monitor the dollar’s trajectory and geopolitical developments. These external factors directly influence the euro exchange rate, and a stronger dollar could pose bigger challenges to the euro’s value, impacting international trade and revenues for European exporters.
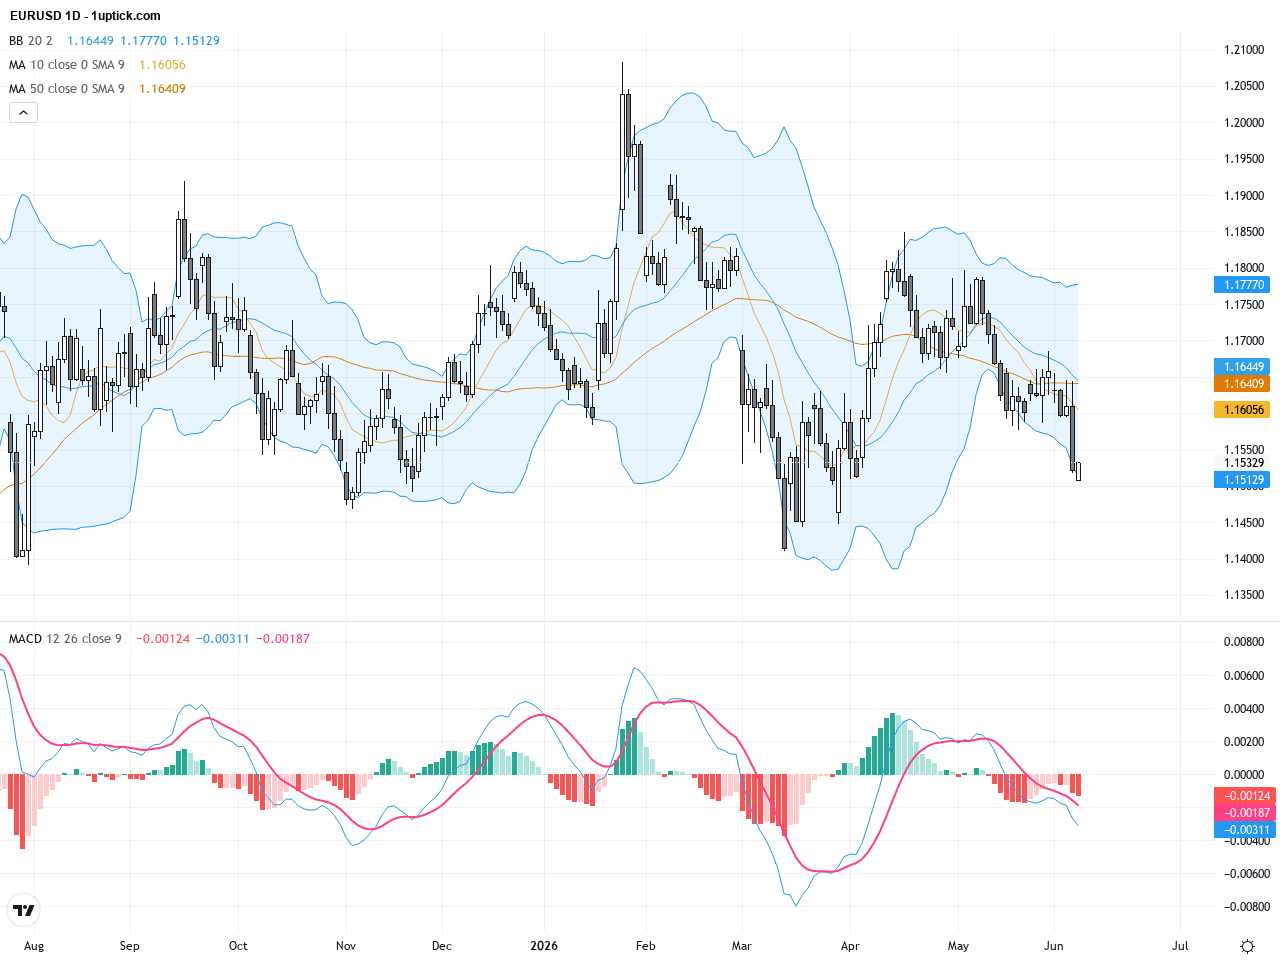
The daily chart shows EURUSD trending downward from a recent high near 1.18. The moving averages align bearishly with price repeatedly rejected by mid-term MA resistance zones, signalling weakening bullish momentum. Bollinger Bands are expanding, reflecting increased volatility. The MACD indicator shows a bearish crossover with sustained negative histogram bars, indicating ongoing selling pressure and a continuation of the downtrend.
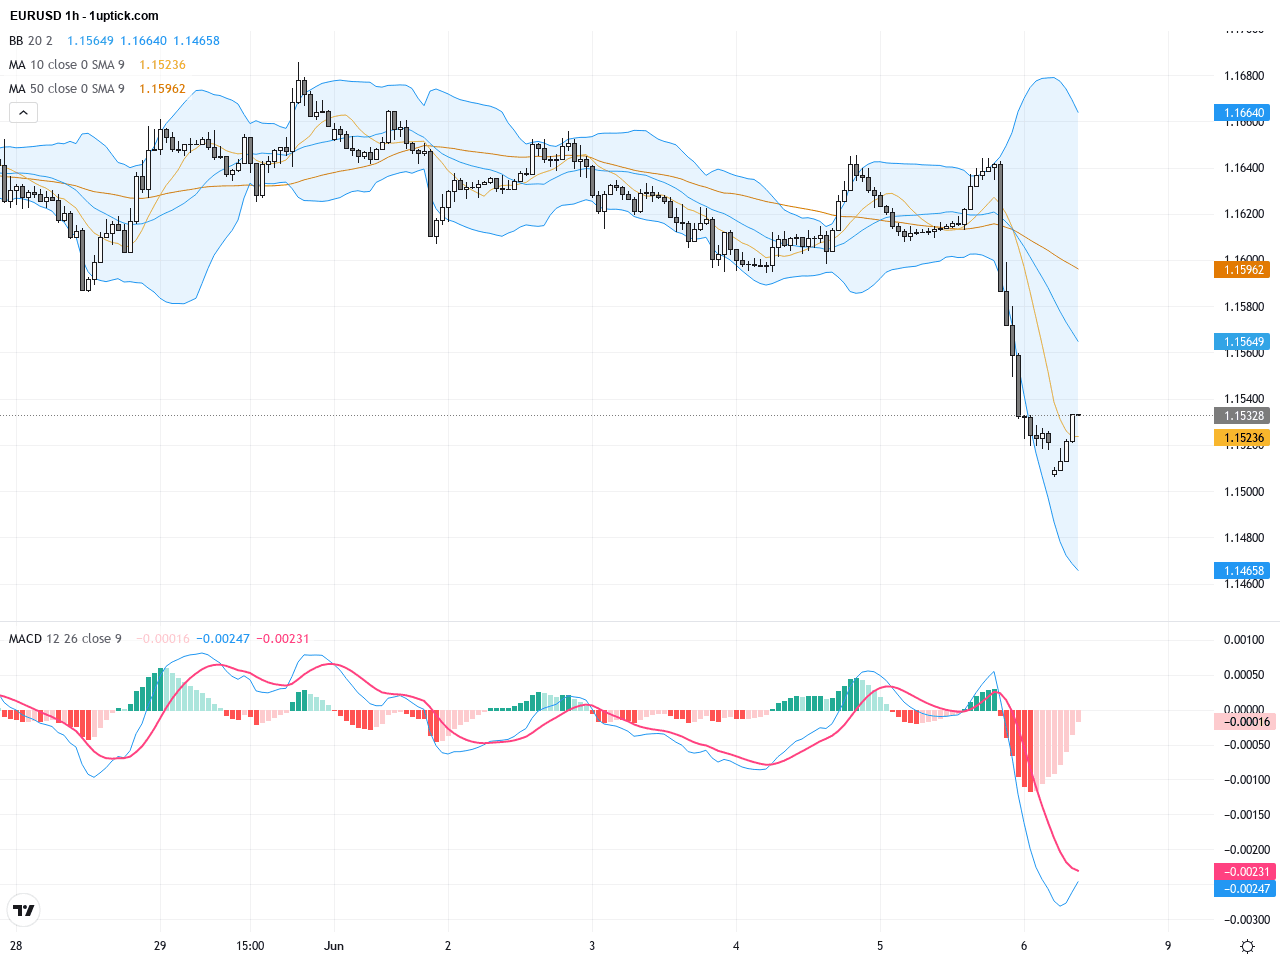
In the last 3 to 5 days on the hourly chart, EURUSD has oscillated between 1.15 and 1.16, forming a double-top pattern accompanied by declining volume. Short-term moving averages have crossed downward, and MACD is expanding into negative territory. The Bollinger Band middle line acts as resistance, with repeated failed breakouts accelerating pullbacks. These technical cues suggest a near-term potential for downward pressure.
Technical Trend: The current trend is cautiously bearish, characterized by a continuing downtrend with short-term consolidation.
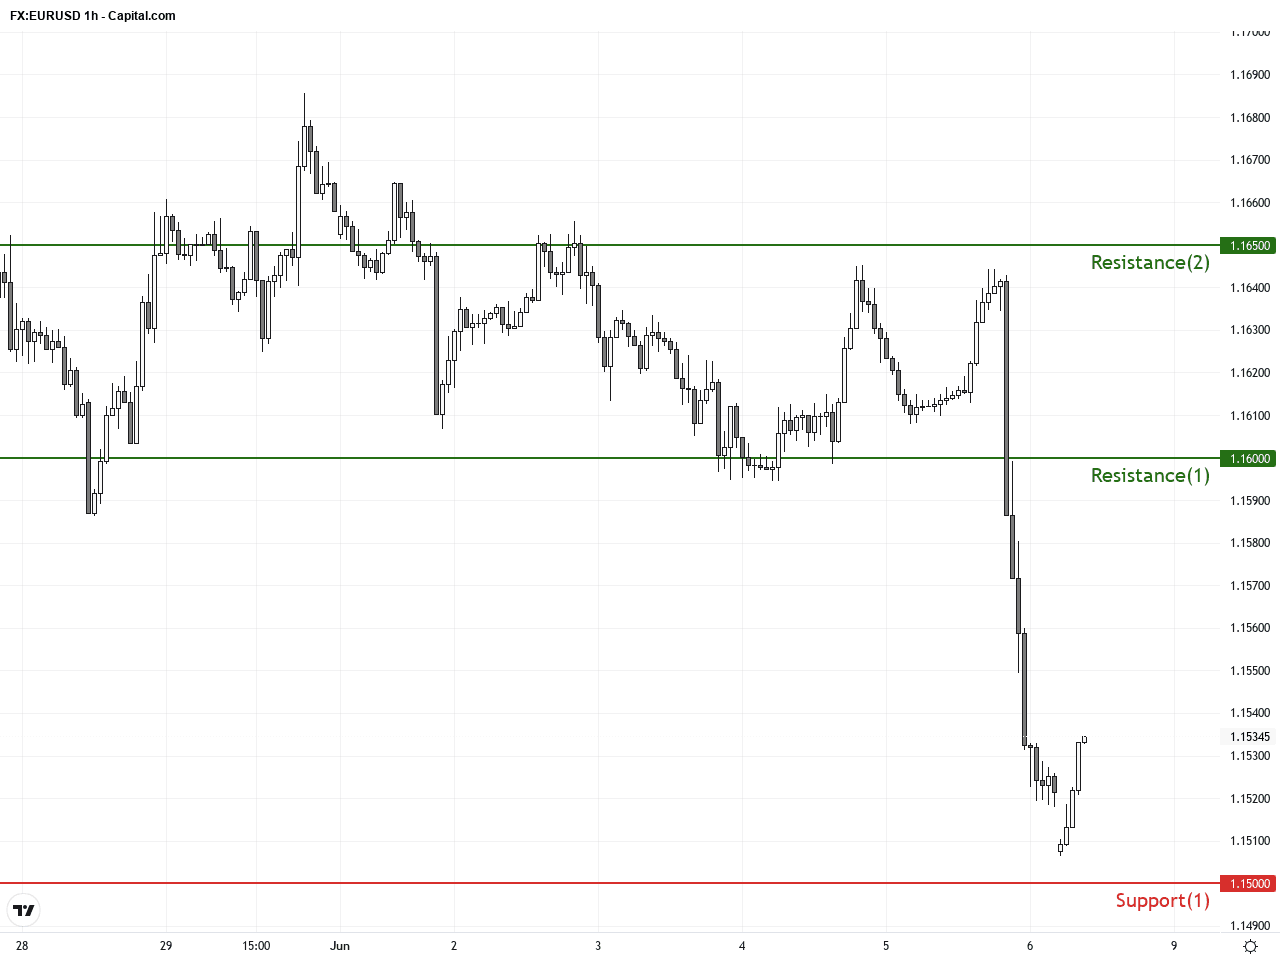
Technically, EURUSD appears to have finished its three-wave rebound and is now retreating. The daily MACD bearish crossover indicates strong selling pressure at higher levels. The hourly chart confirms weakening momentum with a double-top and short-term moving average crossover. Traders should watch the 1.1500 support closely; a break below this level could accelerate bearish momentum. Stay alert to geopolitical news that may trigger further volatility.There are no significant or directly relevant economic events scheduled today in the GMT+1 time zone that would impact EURUSD. Market focus remains on geopolitical developments and oil price movements, with technicals and sentiment likely to dominate price action in the short term.
Resistance & Support
The above financial market data, quotes, charts, statistics, exchange rates, news, research, analysis, buy or sell ratings, financial education, and other information are for reference only. Before making any trades based on this information, you should consult independent professional advice to verify pricing data or obtain more detailed market information. 1uptick.com should not be regarded as soliciting any subscriber or visitor to execute any trade. You are solely responsible for all of your own trading decisions.