


 |
| Gold V.1.3.1 signal Telegram Channel (English) |

USDCAD: Triangular Consolidation Pattern Signals Impending Breakout – Key Support and Resistance Levels, June 9, 2026
2026-06-09 @ 13:01
Over the past 24 to 48 hours, the USD/CAD currency pair has slightly declined from yesterday’s closing price of 1.39517 to around 1.39442. This movement is mainly driven by the Canadian dollar’s rebound from late March lows coupled with weak oil prices capping further gains. Although strong U.S. nonfarm payroll data boosted the U.S. dollar’s momentum, the Canadian economy’s performance and market conditions have provided some resilience to the loonie.
According to recent market news, the Canadian dollar’s appreciation has been restrained by ongoing weakness in oil prices, Canada’s key export commodity, while the U.S. dollar gained strength amid a mild dip in the U.S. 10-year Treasury yield and robust employment figures. Investors face a subtle tug-of-war between the dollar and the loonie, where despite the dollar’s strength, the Canadian dollar finds support due to oil price pressures and the Bank of Canada’s dovish stance.
For the average investor, the price action in this period reflects the market’s real-time response to the economic outlook and policy expectations for both the U.S. and Canada. Tracking USD/CAD requires attention not only to U.S. economic data but also to oil price trends and the Bank of Canada’s monetary policy stance, which together shape near-term volatility risk and trading opportunities.
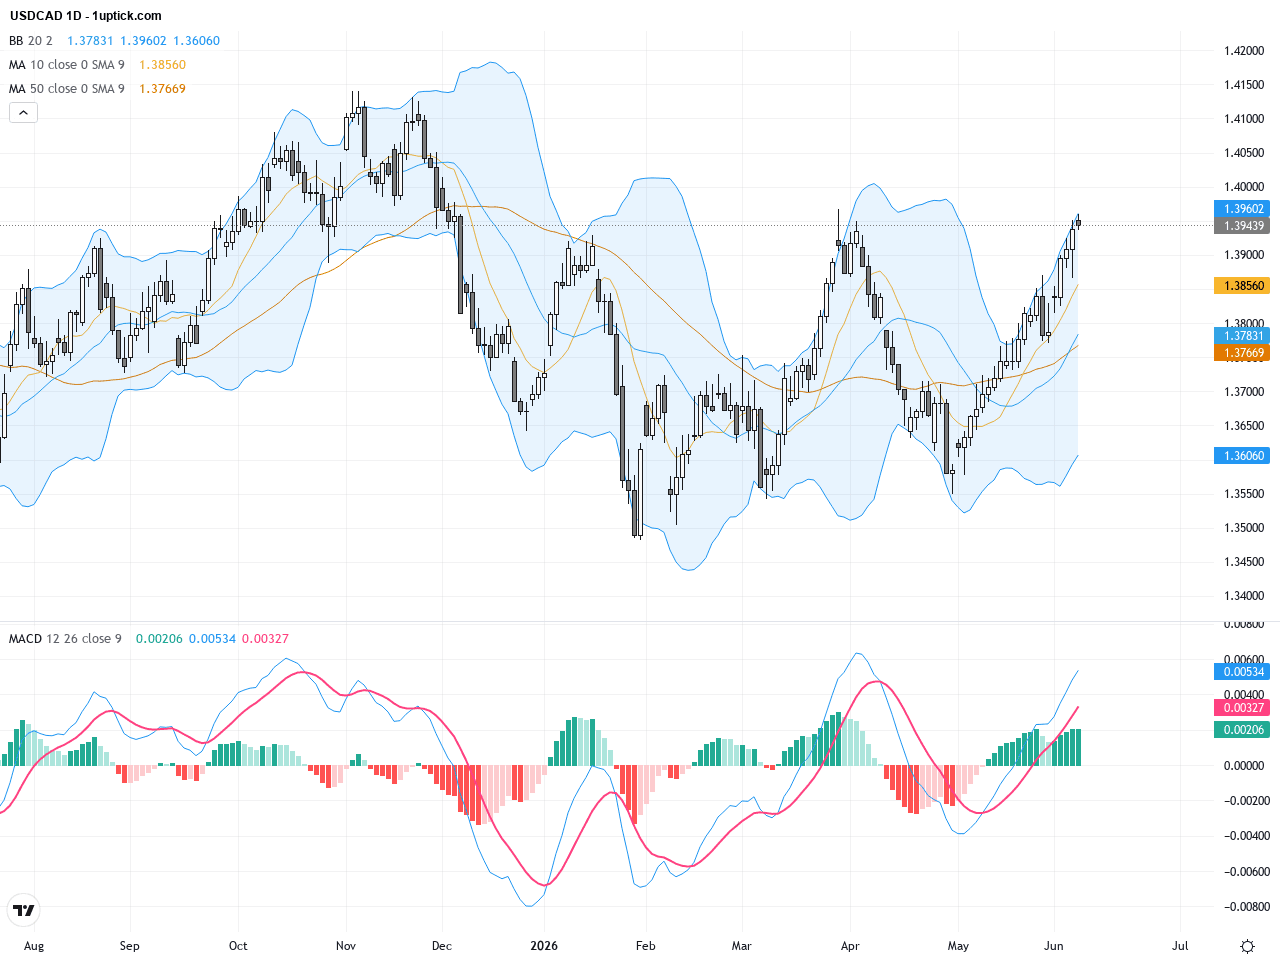
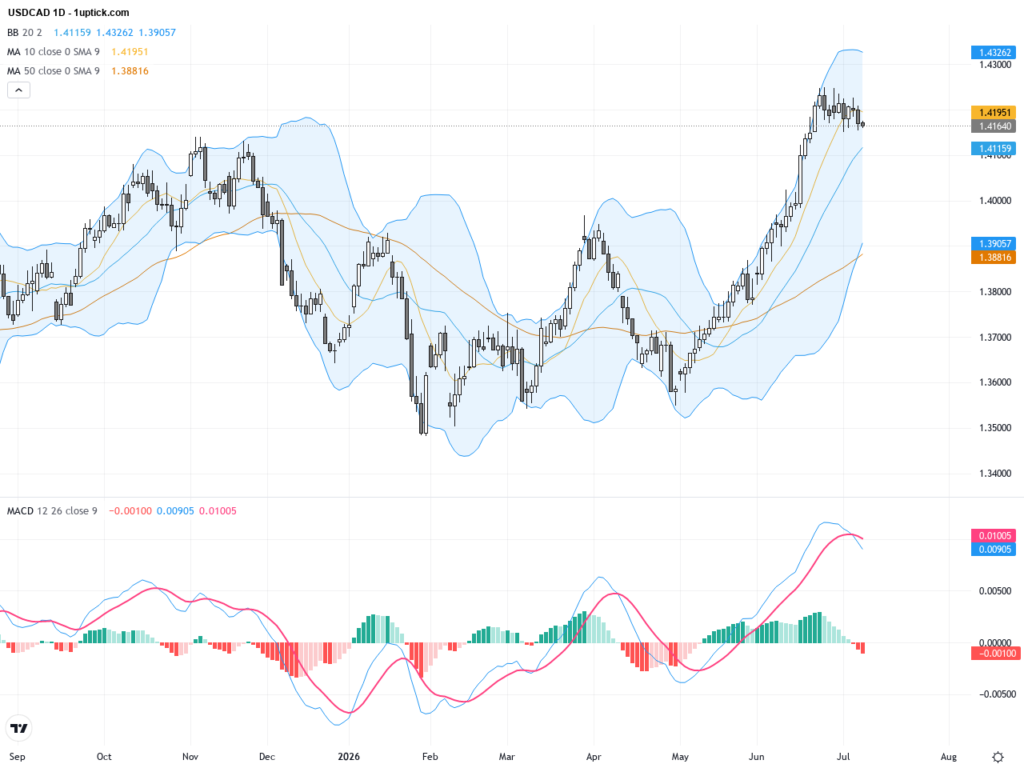
The USDCAD daily chart reveals a sustained uptrend since the start of the year, with price currently consolidating in a well-defined triangular pattern around the 1.39 level. Both the 50- and 200-day moving averages are aligned bullishly, supporting the medium- to long-term uptrend. However, the RSI on the daily timeframe is approaching overbought territory, signaling potential short-term retracement. Bollinger Bands are converging with price testing the upper band, hinting at a possible breakout. The MACD remains in positive territory but shows diminishing histogram bars, indicating momentum may be slowing and warranting caution.
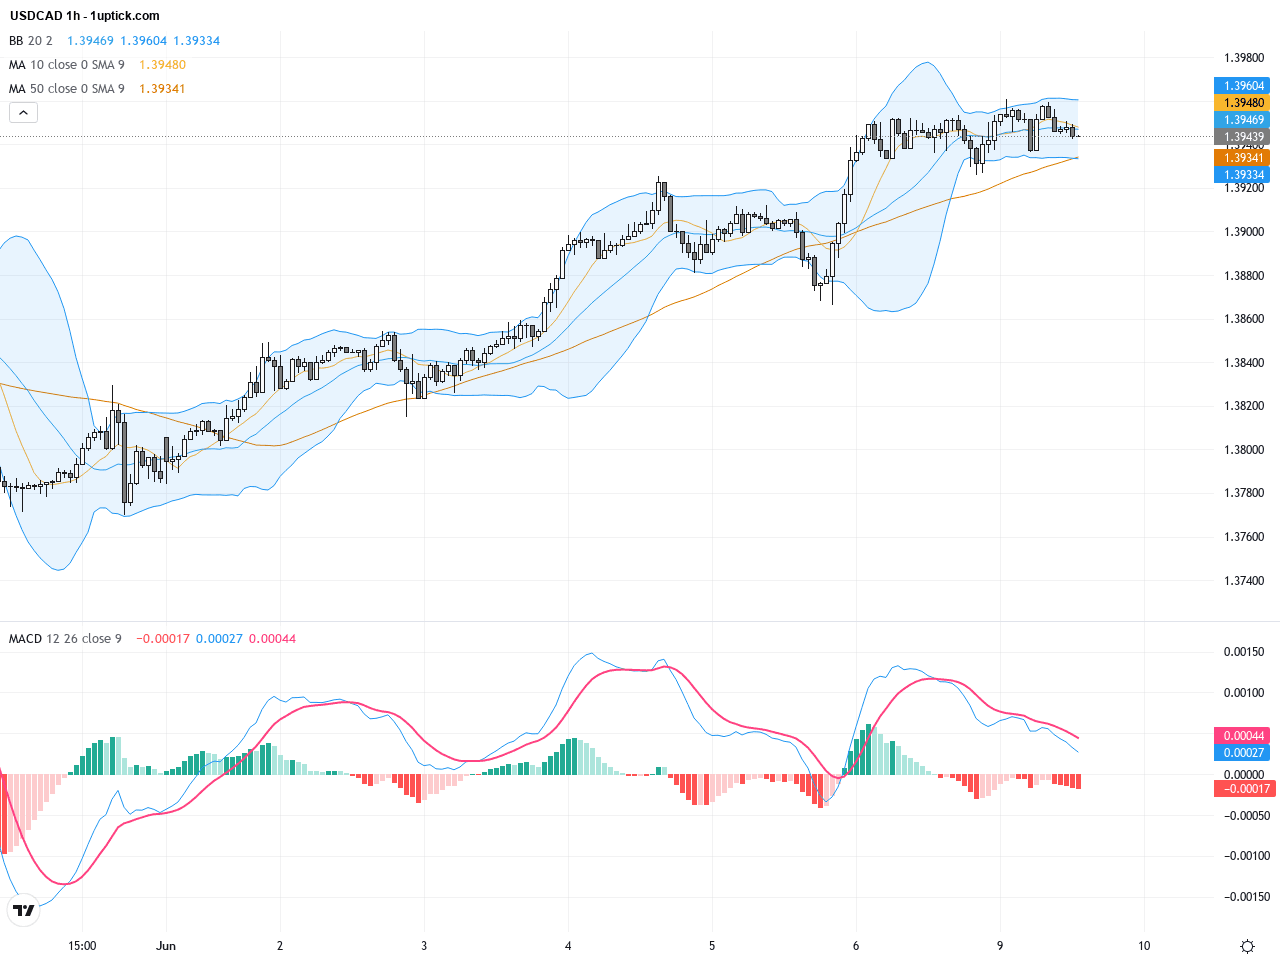
On the hourly chart over the past 3-5 days, USDCAD has been oscillating within a tight range between 1.39 and 1.396, forming a clear sideways channel. Short-term moving averages such as the 20MA and 50MA are intertwined, reflecting indecision. A nascent inverse head and shoulders pattern is emerging with the left shoulder around 1.388, head near 1.395, and the right shoulder currently developing—completion of this pattern typically signals a bullish continuation. Bollinger Bands centerline is being tested repeatedly, while the MACD shows frequent bullish crossovers indicating short-term buying pressure. The recent engulfing candlestick pattern underscores possible short-term reversal potential.
Technical Trend: The current trend is cautiously bullish, in a consolidation phase awaiting breakout
Technically, USDCAD is currently consolidating within a critical triangular pattern on the daily chart, awaiting a decisive breakout to define the next directional move. The hourly chart reveals an emerging inverse head and shoulders formation that, if confirmed, would suggest a strong push higher. Indicators like MACD and RSI show slowing momentum but have yet to turn bearish, suggesting a balanced battle between bulls and bears. The recently formed engulfing candlestick pattern adds weight to potential short-term reversal signals. Traders should monitor key technical levels closely and use candlestick cues to identify optimal entry or exit points in this cautiously optimistic setup.Today’s economic calendar in GMT+1 time shows no major events directly impacting USDCAD. However, China’s May trade balance and export figures exceeded expectations, which could indirectly influence global commodity prices and, in turn, the Canadian dollar. Later, Canada’s April trade balance is forecast to improve slightly, which if better than expected, might lend support to the CAD and restrain USDCAD upward movement. The US also releases trade and inventory figures later in the day, which may have modest short-term effects on the dollar. Overall, today’s economic data events have a limited direct impact on USDCAD with fundamental focus remaining on prior US employment data and oil price trends.
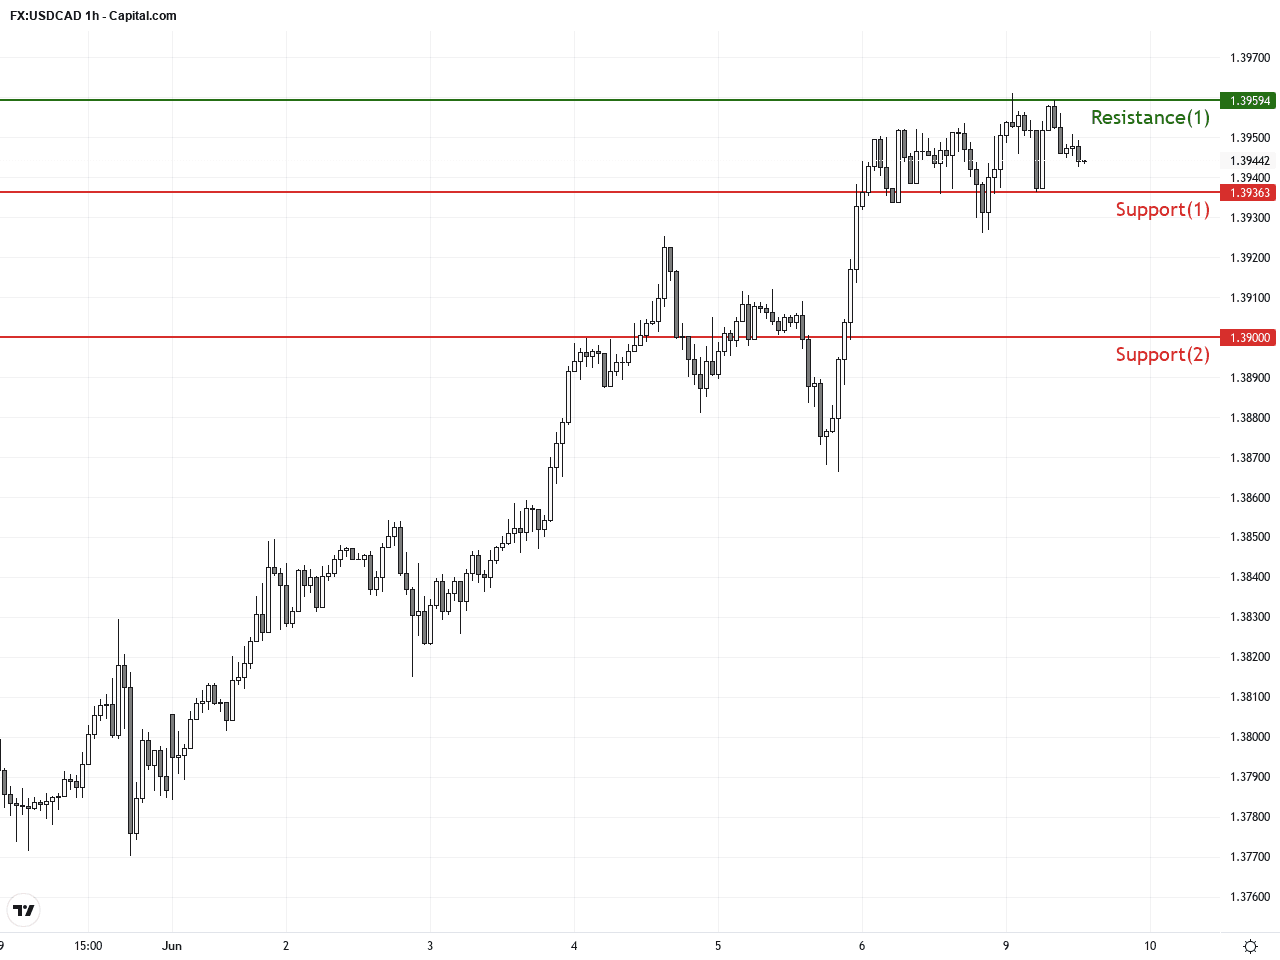
Resistance & Support
The above financial market data, quotes, charts, statistics, exchange rates, news, research, analysis, buy or sell ratings, financial education, and other information are for reference only. Before making any trades based on this information, you should consult independent professional advice to verify pricing data or obtain more detailed market information. 1uptick.com should not be regarded as soliciting any subscriber or visitor to execute any trade. You are solely responsible for all of your own trading decisions.