

 |
| Gold V.1.3.1 signal Telegram Channel (English) |
USDCAD: Breakout Above 1.40 Signals Strong Dollar Amid Oil Price Collapse, June 16, 2026
2026-06-16 @ 13:01
Over the past 24 to 48 hours, the USD/CAD pair experienced notable volatility driven primarily by developments in Middle East peace talks and a sharp drop in oil prices. The pair closed yesterday at 1.40108, with intraday movements ranging from 1.39819 to 1.40166. Market optimism about a potential US-Iran ceasefire led to a significant sell-off in oil, dropping over 8.5%, easing concerns about energy costs and stabilizing the USD/CAD around the 1.3990 level, eventually pushing it just above the key 1.40 resistance.
Recent market news highlights that the possibility of a peace agreement between the US and Iran energized investor sentiment and impacted foreign exchange markets, strengthening the US dollar against the Canadian dollar. Former US President Trump’s prediction that the conflict could end by the weekend boosted risk appetite, slightly reducing the US dollar’s safe-haven demand, but the dollar maintained its strength due to falling energy prices.
For the average investor, this market movement is akin to seeing a hopeful light after uncertainty, shifting market sentiment quickly to optimism. The US dollar benefited from its close linkage to energy prices, with declining oil prices paired with peace prospects serving as the main drivers behind USD/CAD gains in recent sessions.

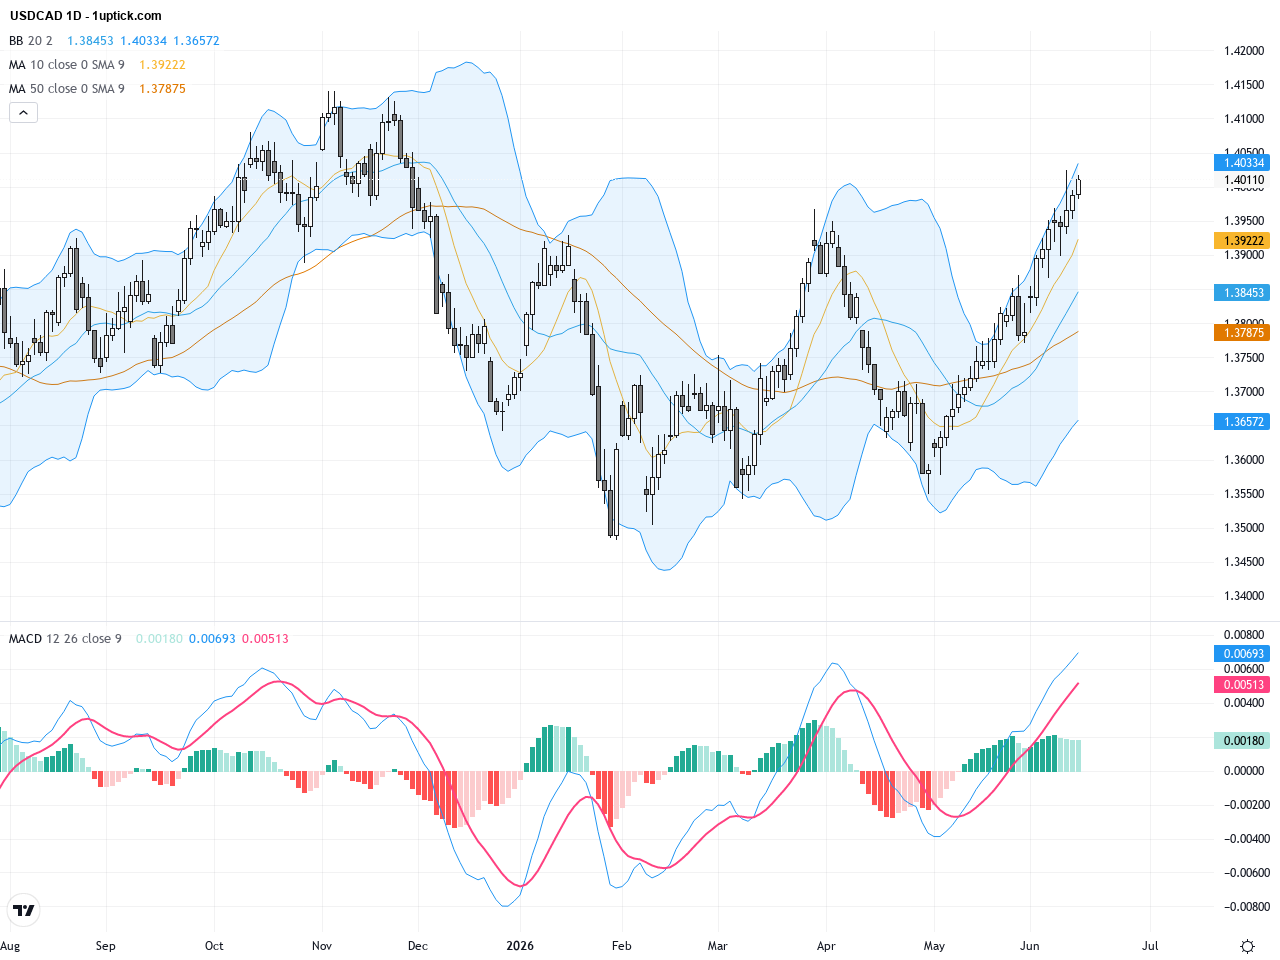
The daily chart of USDCAD reveals a clear uptrend starting from around 1.375, culminating in a recent breakout above the significant 1.40 resistance level. The moving averages are bullishly aligned, with the 50-day SMA near 1.375 and the 200-day SMA around 1.379, and price trading comfortably above both. Bollinger Bands show expansion, indicating heightened volatility and continuation potential. The MACD indicator remains bullish, with the fast line above the slow, confirming strong momentum. No reversal patterns are present, solidifying the overall bullish bias in the longer timeframe.

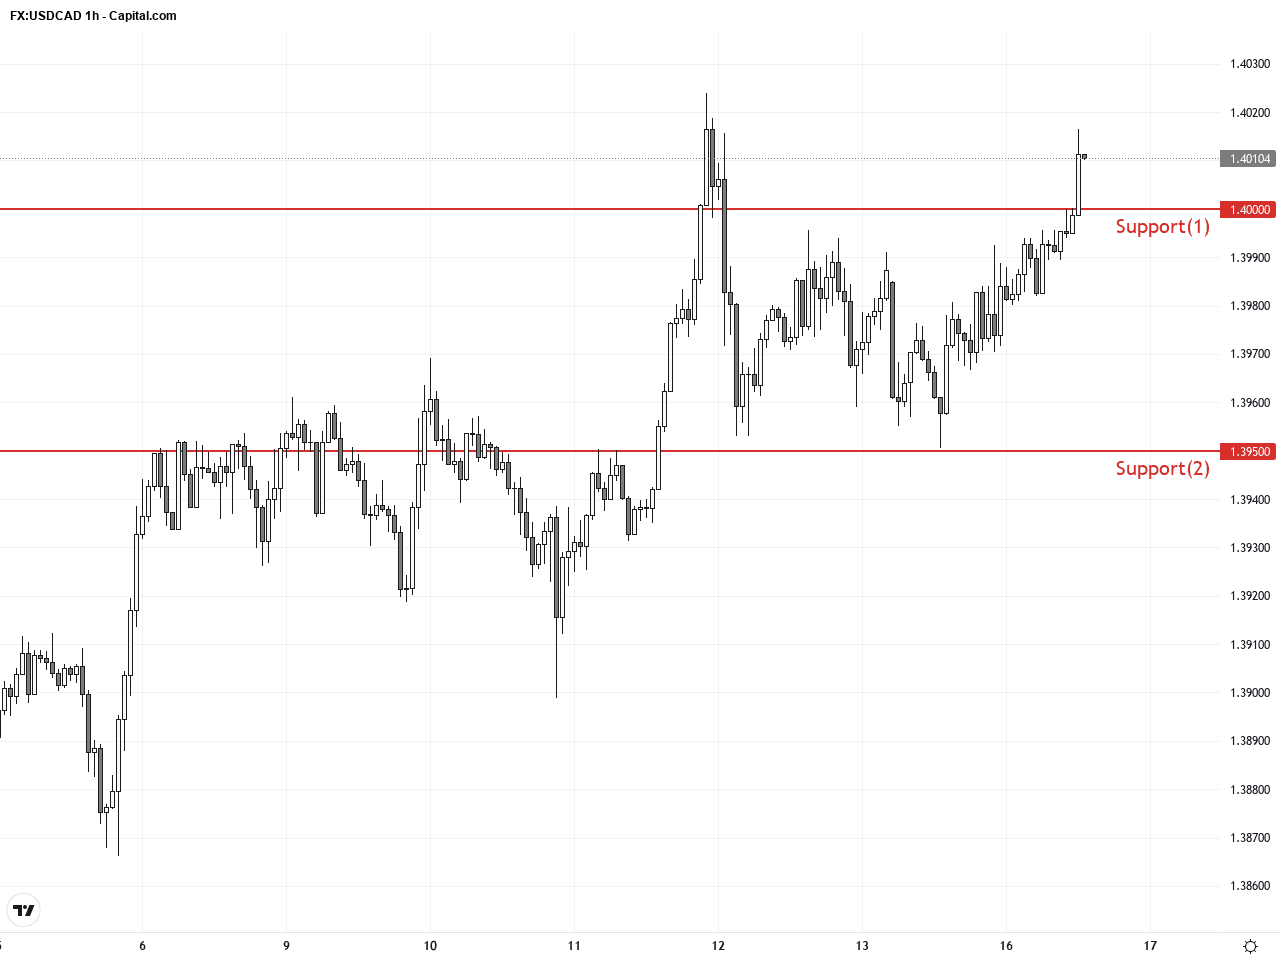
On the hourly chart covering the past 3-5 days, USDCAD shows a steady upward move oscillating between 1.398 and 1.405. Bollinger Bands are expanding slightly, reflecting increasing volatility. The MACD is on the verge of a bullish crossover, and short-term moving averages (20 and 50 SMA) are trending upward. The most recent candlestick is a bullish engulfing pattern, which is a strong sign of sustained buying pressure for at least the next 24 hours, suggesting potential for continued gains beyond 1.405.
Technical Trend: Current trend is decisively bullish, reflecting sustained upward momentum and strong buyer interest.
Technically, USDCAD has decisively broken and held above the key daily resistance at 1.40. The Bollinger Bands show widening alongside a bullish MACD crossover, confirming strong upward momentum. The hourly bullish engulfing candle reinforces a short-term continuation scenario with price supported above moving averages. Given the geopolitical news easing and oil price pressure reducing CAD demand, the technical setup strongly favors USD strength in the near term. Traders should watch for entry opportunities on dips as the momentum signals a high-probability trade in favor of further gains.Today’s economic calendar does not feature any major data directly impacting USDCAD. Canadian releases include May housing starts and manufacturing sales, where stronger numbers could support CAD. US economic indicators such as the New York Empire State Manufacturing Index and industrial production are also scheduled; weaker-than-expected data might weigh on the USD. Overall, no significant event is poised to disrupt the current price trend today, leaving market-driven factors such as geopolitics and oil prices as the primary movers.
Resistance & Support
The above financial market data, quotes, charts, statistics, exchange rates, news, research, analysis, buy or sell ratings, financial education, and other information are for reference only. Before making any trades based on this information, you should consult independent professional advice to verify pricing data or obtain more detailed market information. 1uptick.com should not be regarded as soliciting any subscriber or visitor to execute any trade. You are solely responsible for all of your own trading decisions.