








 |
| Gold V.1.3.1 signal Telegram Channel (English) |

USDCAD Nears Seven-Month High, Breaking Key 1.41 Resistance with Bullish Trading Outlook, June 18, 2026
2026-06-18 @ 13:01
Over the past 24 to 48 hours, the USDCAD pair has seen a slight pullback, trading just below yesterday’s closing price of 1.41011, hovering around 1.4100 during Asian trading hours, ending a five-day winning streak. This movement closely correlates with the recent fading of risk aversion in the market, as the US dollar softened amid reduced safe-haven demand, allowing the Canadian dollar to inch higher.
Several recent market developments have driven USDCAD fluctuations. Ahead of the Federal Open Market Committee (FOMC) meeting, traders took a cautious stance, minimizing aggressive positioning; meanwhile, the International Energy Agency’s (IEA) downward revision of oil price forecasts pressured the commodity-linked Canadian dollar. However, positive domestic data, such as a 5.5% increase in Canadian home sales in May, provided solid fundamental support for CAD. These mixed factors resulted in a tug-of-war between the US dollar and the Canadian dollar during this period.
In summary, the recent USDCAD price action reflects the delicate balance between shifting global risk sentiment and commodity market dynamics. For average investors, the current pullback signals a shift from intense risk-off to steadier confidence, making it crucial to closely watch the upcoming FOMC policy direction and oil price movements, as both will continue to shape the exchange rate’s trajectory.

The daily chart shows a clear uptrend in USDCAD, with price moving steadily from around 1.38 and crossing above both the 50-day and 200-day moving averages, now holding above 1.41. Bollinger Bands have tightened, indicating decreasing volatility, while the MACD histogram enlarges suggesting growing bullish momentum. This long-term trend has been developing over recent weeks, aligning with a sustained rise pattern, confirming a bullish medium-term setup.
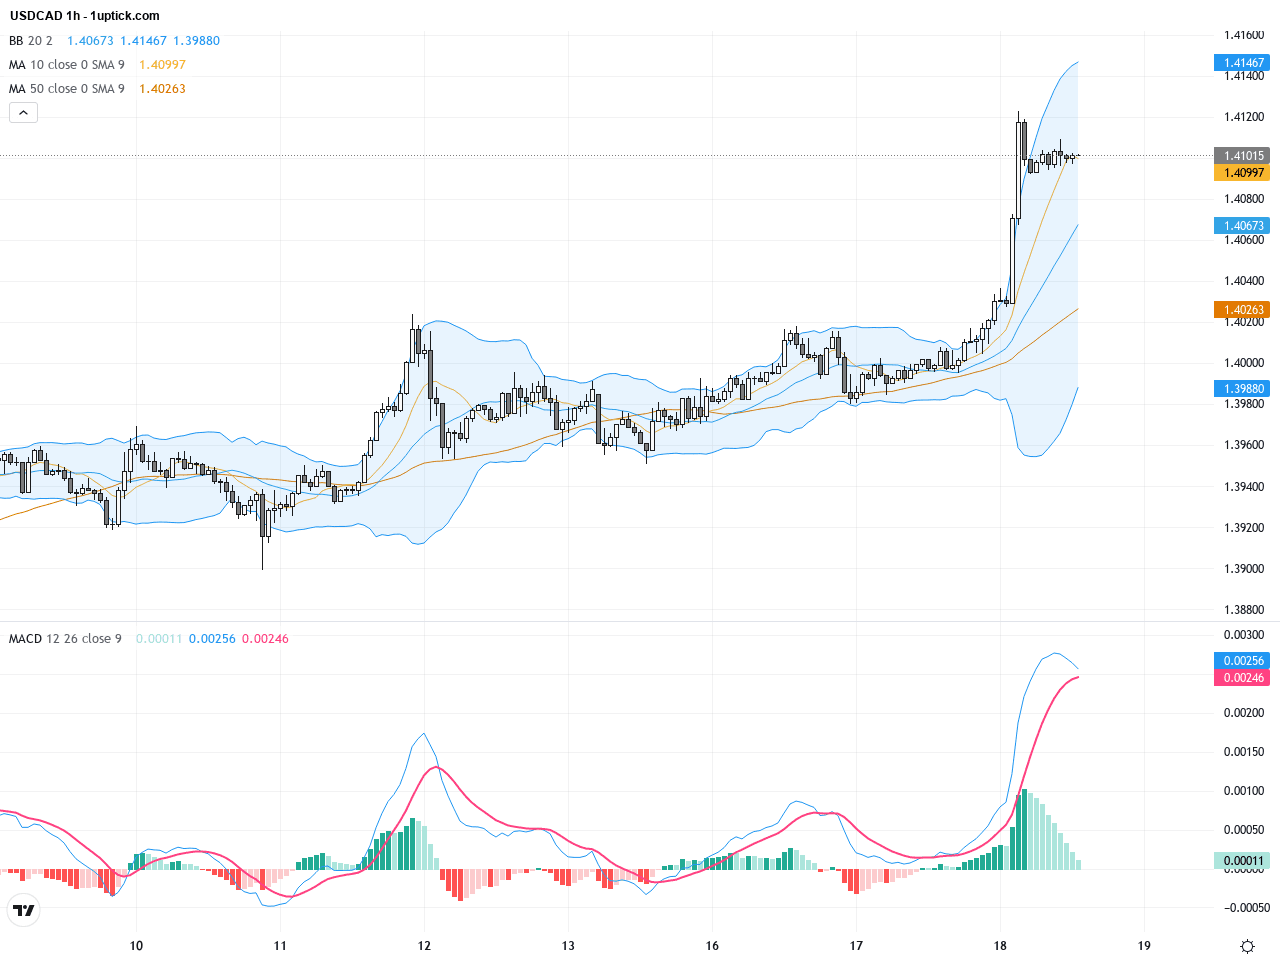
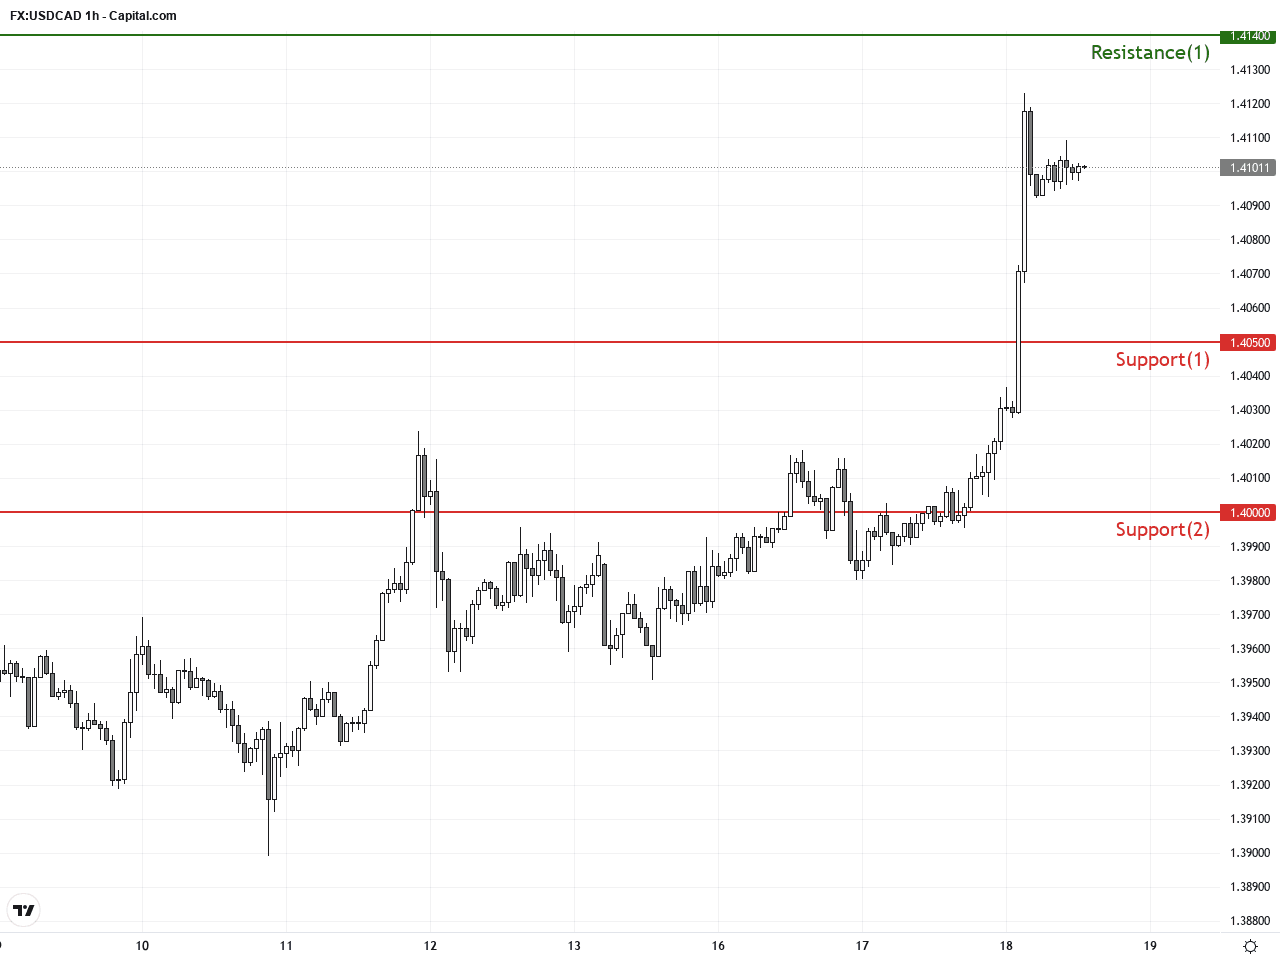
The hourly chart highlights active price movement over the last 3 to 5 days, especially after breaking above 1.4050 which accelerated gains forming a bullish flag breakout. Price action hovers near the upper Bollinger Band with MACD showing a golden cross, signaling strong short-term buying pressure. Recent candlesticks include large bullish engulfing bars, implying follow-through buying in the next 24 hours, but traders should remain cautious of potential short-term pullbacks.
Technical Trend: Decisively Bullish
Technical insights reveal that MACD indicators are bullish on both daily and hourly charts, with RSI in the mid-to-high range, showing no immediate overbought conditions. The daily chart’s break above 1.41 is a pivotal point that, if sustained, could lead to testing the 1.4140 yearly high next. The bullish flag breakout on the hourly chart offers a high-probability setup for short-term traders. Additionally, the recent bullish engulfing candlestick supports ongoing momentum, although setting stop losses is advisable to protect against sudden reversals.Regarding today’s GMT+1 economic calendar, there are no major events directly impacting USDCAD. Attention remains on the upcoming FOMC meeting. Later US data releases such as the Philadelphia Fed Index and weekly jobless claims might influence the US dollar’s tone; better-than-expected results would favor USD strength and likely push USDCAD lower. No significant Canadian data is scheduled, making the pair’s movement reliant on US indicators and global risk sentiment today.
Resistance & Support
The above financial market data, quotes, charts, statistics, exchange rates, news, research, analysis, buy or sell ratings, financial education, and other information are for reference only. Before making any trades based on this information, you should consult independent professional advice to verify pricing data or obtain more detailed market information. 1uptick.com should not be regarded as soliciting any subscriber or visitor to execute any trade. You are solely responsible for all of your own trading decisions.