


 |
| Gold V.1.3.1 signal Telegram Channel (English) |

AUDUSD Technical and Fundamental Analysis: Eyes on 0.7000 Support Amid USD Strength, June 19, 2026
2026-06-19 @ 06:01
Over the past 24 to 48 hours, the Australian Dollar against the US Dollar (AUD/USD) experienced notable volatility, closing yesterday around 0.70119, slightly lower than the previous day. The market was influenced by several factors, notably the Reserve Bank of Australia (RBA) widely expected to hold interest rates steady at 4.35%, putting near-term pressure on the AUD.
The surge in the US dollar, driven by strong US employment data, weighed heavily on the AUD/USD pair. The robust Nonfarm Payrolls report heightened expectations that the Federal Reserve will maintain a tight monetary policy stance, boosting safe-haven demand for the USD and weighing on risk currencies like the Aussie.
For the average investor, this scenario is akin to the domestic central bank pausing rate hikes while a larger economy adopts a more hawkish stance, funneling funds towards US assets. Consequently, holders of AUD face currency depreciation risks and should closely monitor US economic data and central bank signals, as these factors critically influence AUD/USD price dynamics.

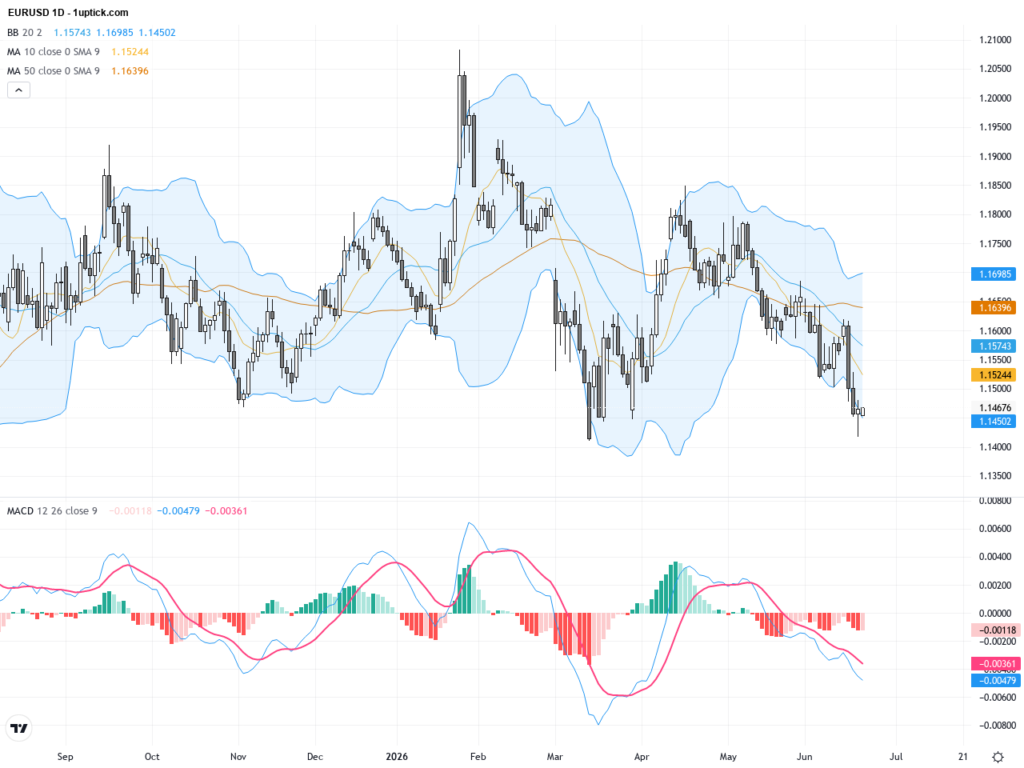
The daily chart illustrates AUDUSD in a clear downtrend channel, sliding from a high of 0.72776 downward and falling below the key 50-day moving average at 0.71453, yet holding above the 200-day MA at 0.69008. Bollinger Bands have narrowed, indicating reduced volatility, but the MACD remains negative and expanding, confirming strong bearish momentum. This overall daily timeframe pattern suggests sustained downward pressure with critical attention needed on the 0.7000 support level to gauge potential rebounds or further declines.
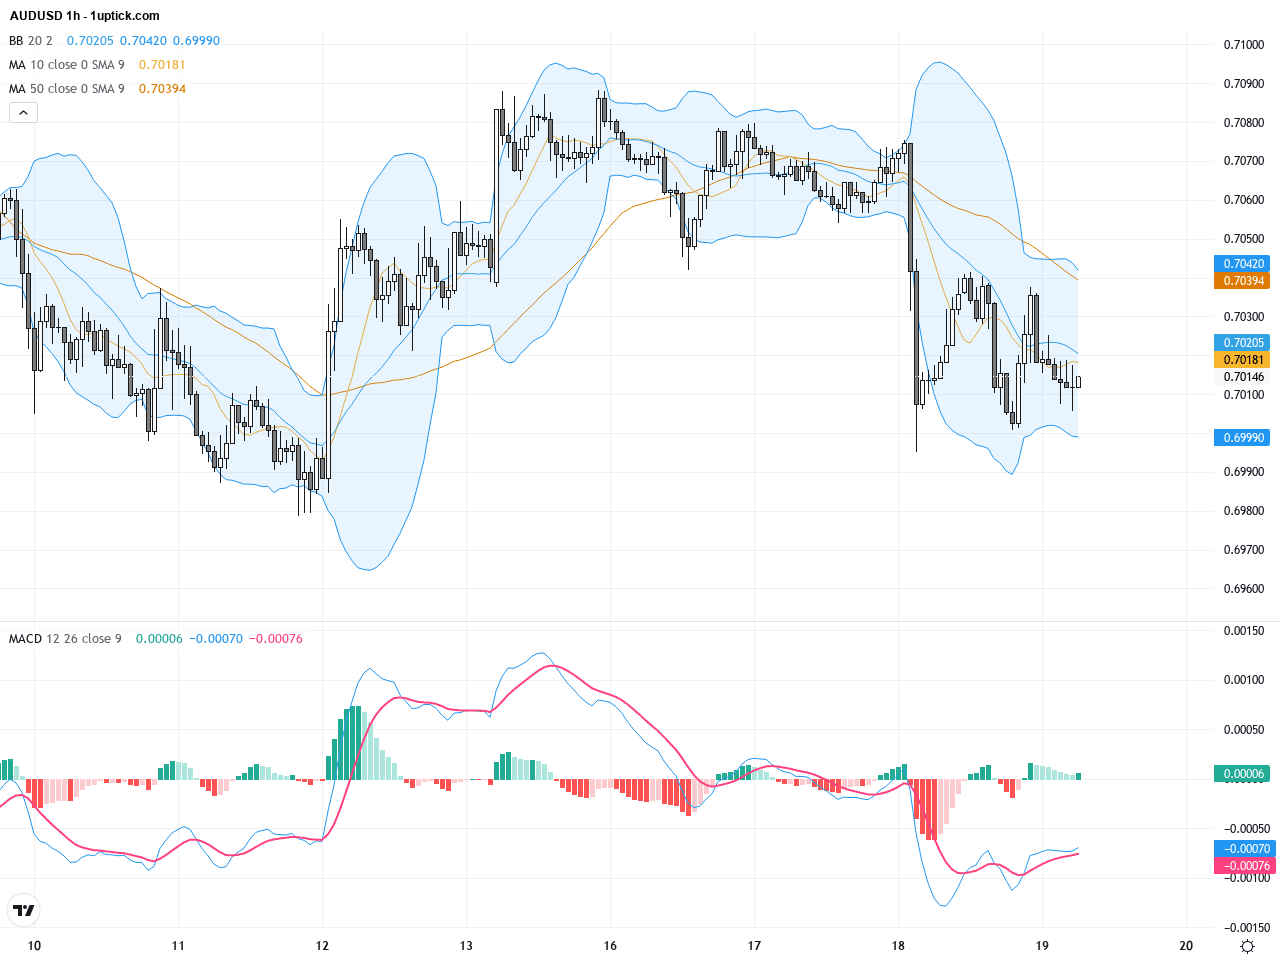
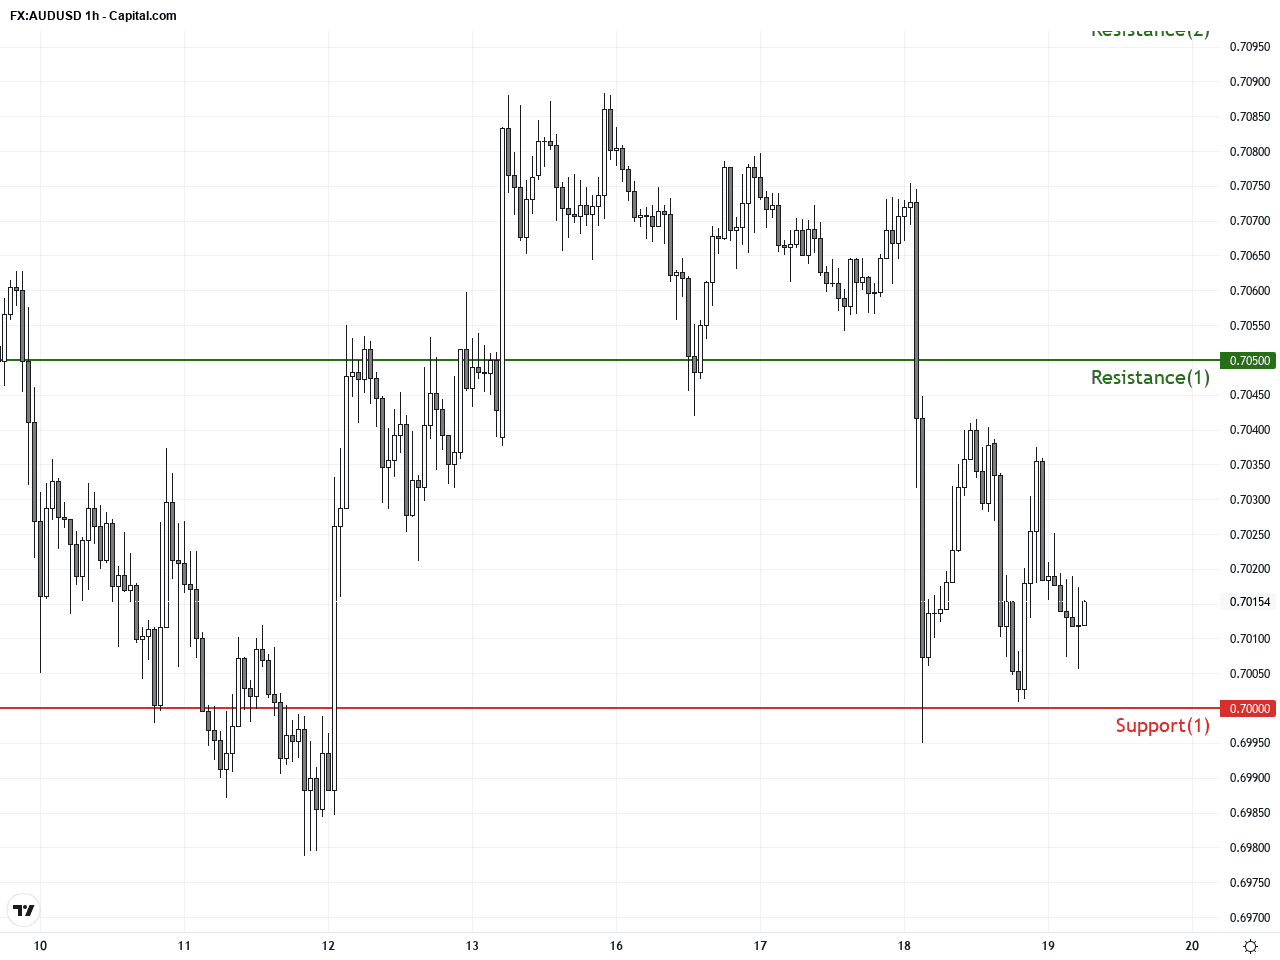
The hourly chart over the last 3-5 days reveals price oscillating between 0.7000 and 0.7040, facing resistance near the upper Bollinger Band with signs of divergence on the MACD and an RSI approaching overbought territory. Recent candlestick formations include a bearish engulfing pattern with a long upper wick, signaling increasing selling pressure in the short term. Moving averages have not yet formed a decisive crossover, indicating potential for further consolidation or pullback around the 20-hour MA area.
Technical Trend: Cautiously Bearish Consolidation
Technical indicators point to AUDUSD being in a bearish alignment on the daily chart, with MACD confirming persistent downside momentum. The recent bearish engulfing candle on the hourly chart combined with RSI nearing overbought levels indicates short-term pullback risks. Caution is advised for longs near 0.7000 support, with attention to any breakout moves that could signal trend reversals or continuation setups.Today’s GMT+1 economic calendar presents no significant events directly impacting AUD or USD. Key releases such as New Zealand GDP and UK employment figures came in line with expectations, suggesting limited influence on AUDUSD. Thus, current price movement is more likely driven by monetary policy expectations and broader US dollar strength rather than direct economic data. Traders should focus on technical signals and currency correlations today.
Resistance & Support
The above financial market data, quotes, charts, statistics, exchange rates, news, research, analysis, buy or sell ratings, financial education, and other information are for reference only. Before making any trades based on this information, you should consult independent professional advice to verify pricing data or obtain more detailed market information. 1uptick.com should not be regarded as soliciting any subscriber or visitor to execute any trade. You are solely responsible for all of your own trading decisions.