









 |
| Gold V.1.3.1 signal Telegram Channel (English) |
USDJPY Surges to 40-Year Highs: Technical Patterns and Trading Outlook Analysis, July 24, 2026
2026-07-24 @ 11:01
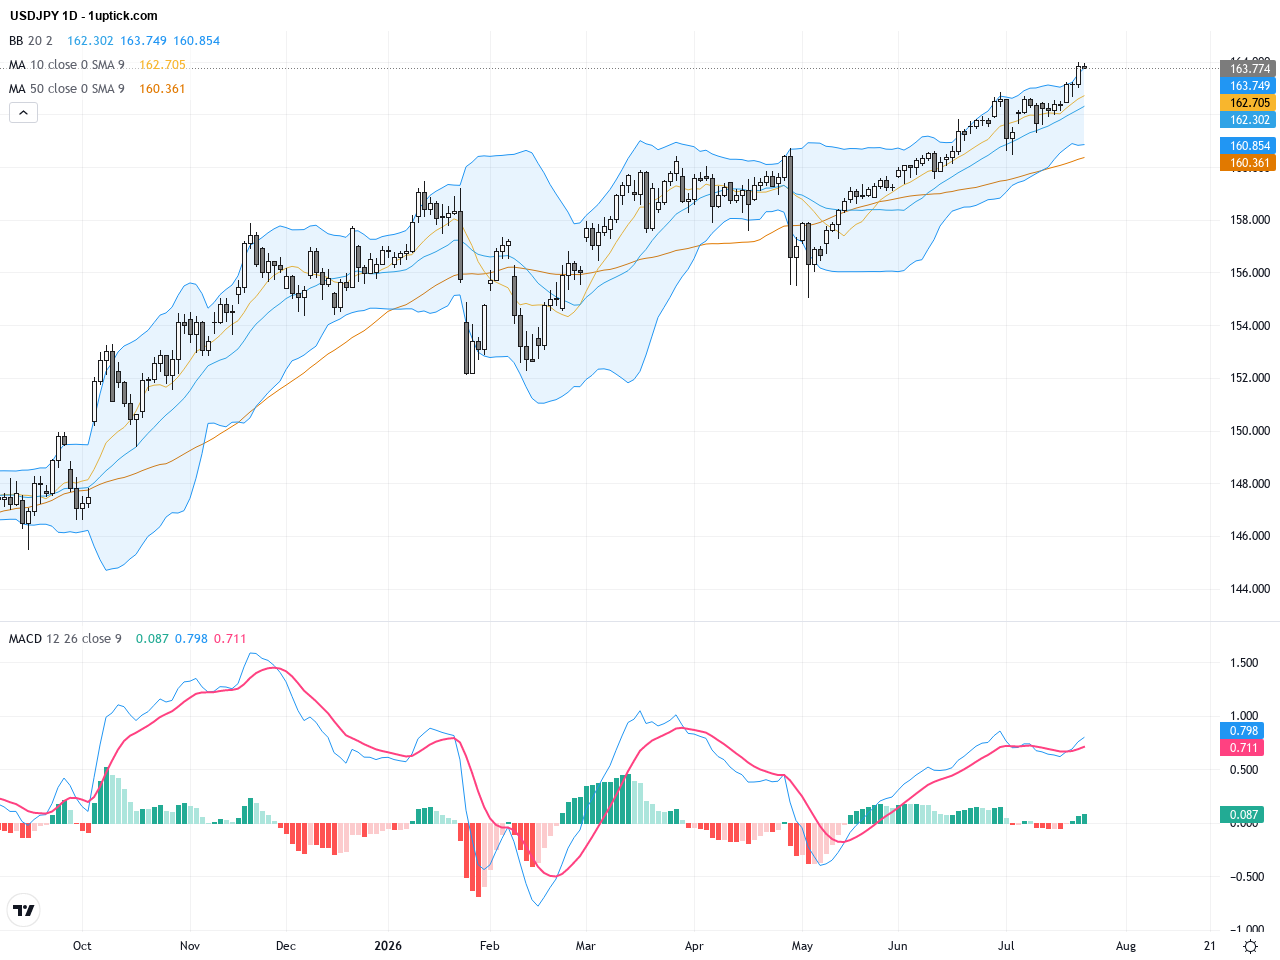
Over the past 24 to 48 hours, USD/JPY hovered steadily between 163.70 and 164.00, closing yesterday at 163.774, continuing its recent strong momentum. The market was primarily influenced by news that Japan’s $1.8 trillion pension giant may repatriate funds, raising concerns about reduced demand for the dollar, strengthening the yen. Adding to this, the Bank of Japan’s surprise acceleration of monetary tightening significantly narrowed the US-Japan interest rate gap, reinforcing yen strength and keeping USD/JPY volatile near historic highs.
For the average investor, this scenario means when a massive capital pool like Japan’s pension fund decides to pull back its overseas investments, it directly reduces demand for the dollar and pressures its value. Coupled with the BOJ’s shift to a more aggressive rate hike stance, yen yields become more attractive, fueling a firm rebound. This indicates that USD/JPY is likely to stay volatile around elevated levels, with potential for a stronger yen rebound ahead. Traders should watch Japan’s policy moves and global capital flows closely when planning their positions.
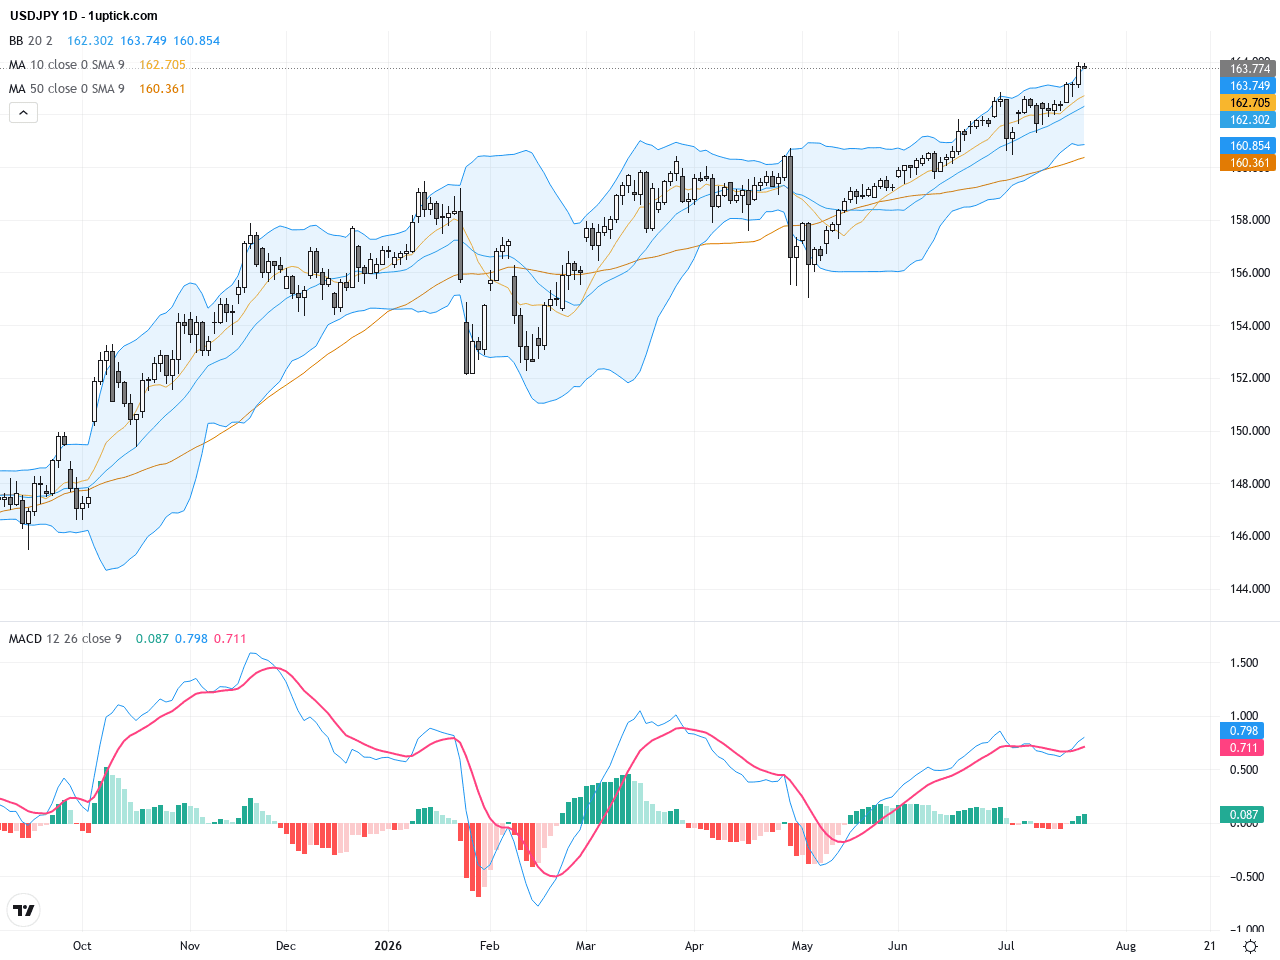
The daily chart shows USDJPY’s steady rally from its year low around 145.86, maintaining a clear uptrend above both the 50-day and 200-day moving averages, signaling a strong bullish bias. The expanding Bollinger Bands indicate increasing volatility, and the MACD remains bullish with the fast line above the slow line at elevated levels, reinforcing trend strength. A recent breakout above key resistance has solidified the current uptrend. Overall, the daily technical setup underscores sustained bullish momentum with further upside potential.
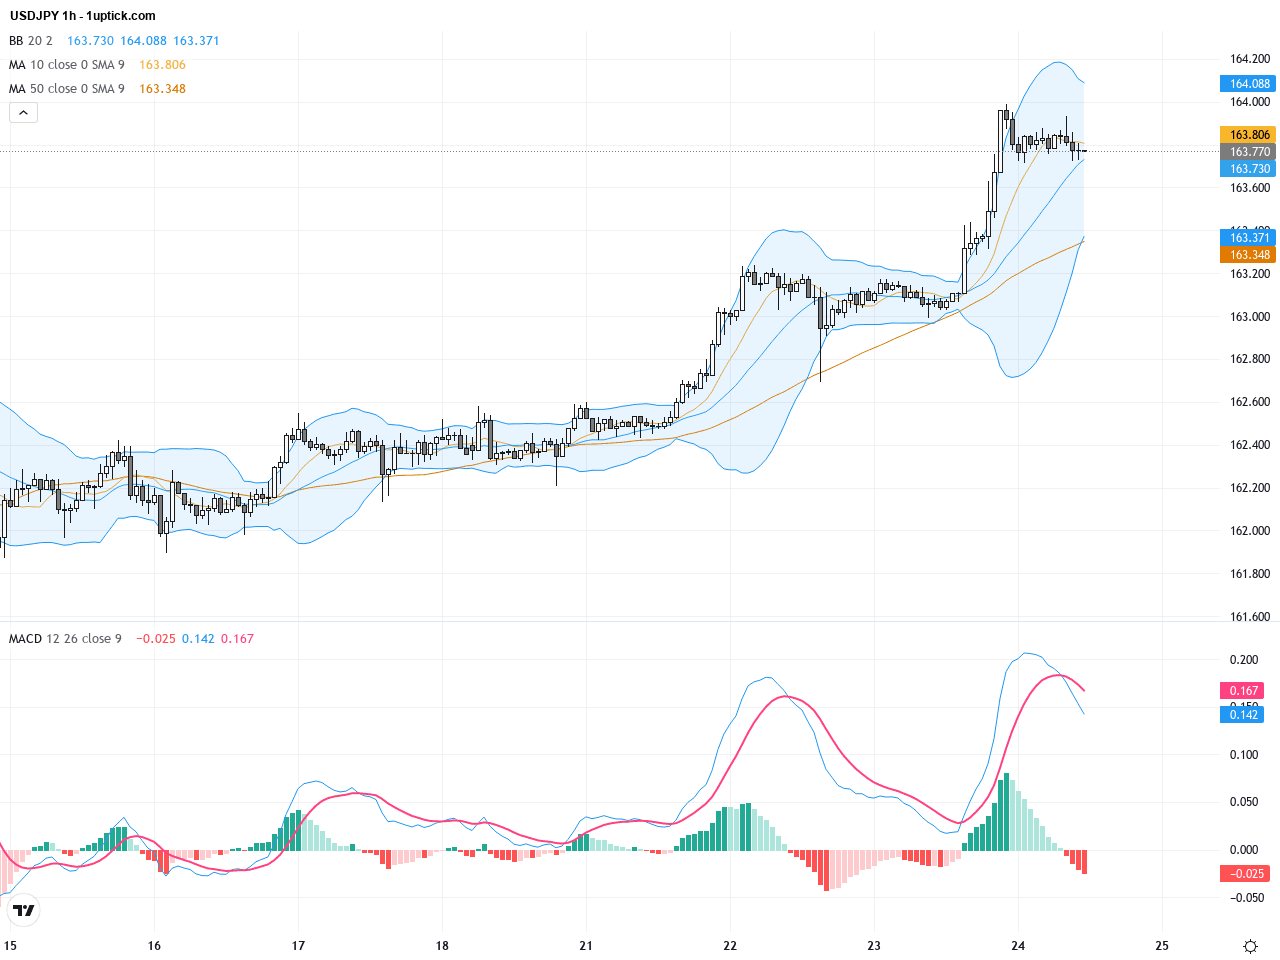
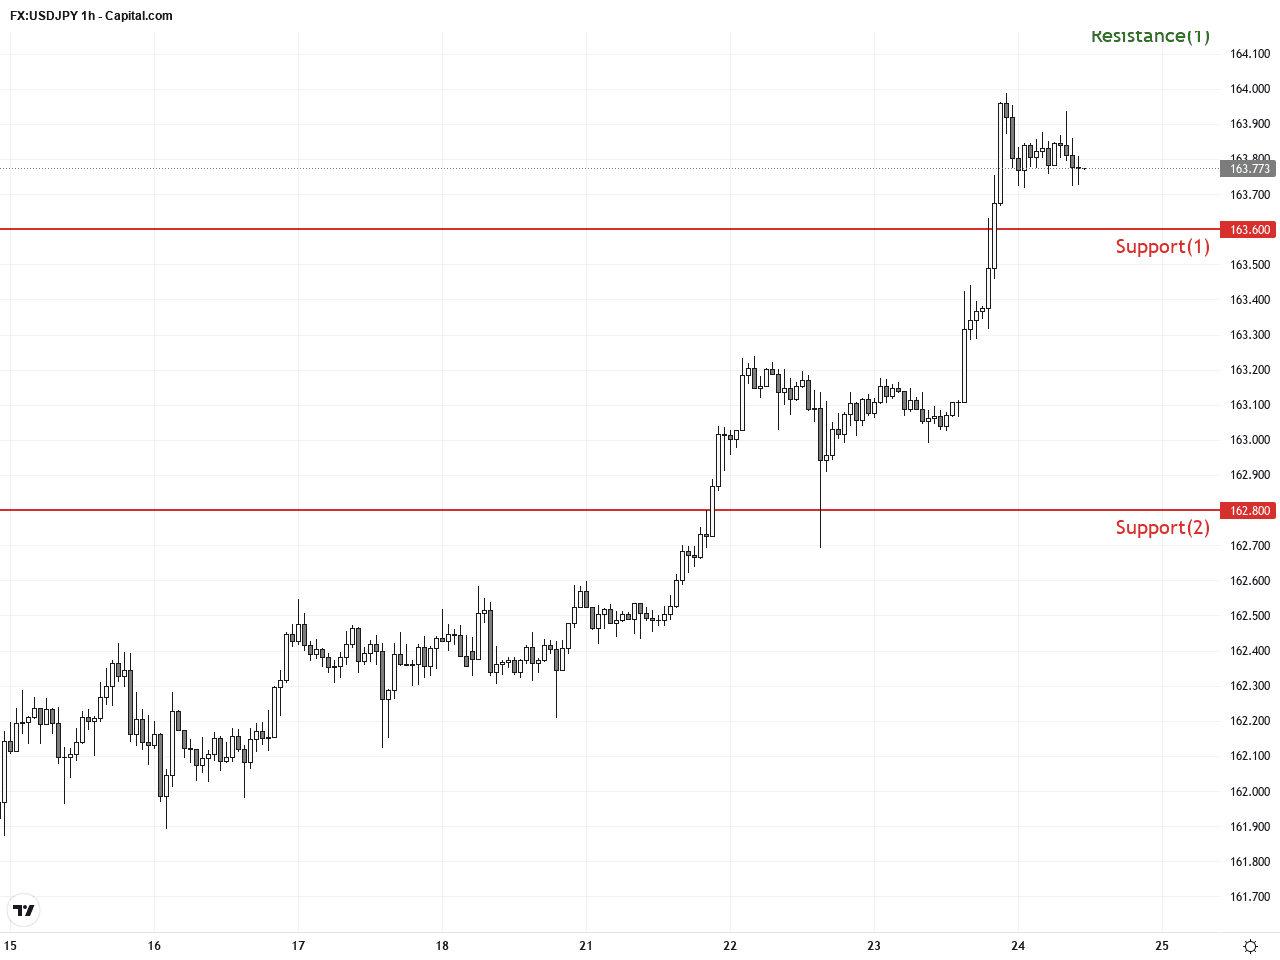
On the hourly chart, USDJPY has experienced heightened volatility over the last 3-5 days, trading within an ascending channel. The price frequently tests the upper Bollinger Band followed by minor retracements, suggesting short-term profit taking. The MACD recently generated a bullish crossover, signaling rising momentum. A bullish flag pattern is forming, indicating a possible breakout continuation. Critical short-term support lies near 163.60. Holding this support could sustain the upward movement in the near term.
Technical Trend: Decisively bullish with strong continuation momentum.
Technical insights confirm a dominant bullish trend in USDJPY, supported by MACD and moving averages on the daily timeframe. The recent breakout above previous resistance confirms medium to long-term strength. Meanwhile, the hourly chart’s flag consolidation flags cautious optimism for a continuation. Recent candlestick patterns, including bullish engulfing and hammer formations, further suggest positive short-term momentum. While bullish, traders should manage risk prudently given possible volatility spikes.Today’s GMT+1 economic calendar highlights Japan’s key releases at 01:30, including the June Consumer Price Index (CPI) at 1.7% year-on-year, slightly above previous 1.5%, and Core CPI steady at 1.6%. Additionally, the July preliminary Manufacturing PMI came in at 54.7, marginally below the expected 55. These data points reinforce moderate inflation and ongoing economic activity in Japan, potentially supporting the yen. Stronger-than-expected figures could pressure USDJPY downside, signaling a possible short-term yen strength against the dollar.
Resistance & Support
The above financial market data, quotes, charts, statistics, exchange rates, news, research, analysis, buy or sell ratings, financial education, and other information are for reference only. Before making any trades based on this information, you should consult independent professional advice to verify pricing data or obtain more detailed market information. 1uptick.com should not be regarded as soliciting any subscriber or visitor to execute any trade. You are solely responsible for all of your own trading decisions.