







 |
| Gold V.1.3.1 signal Telegram Channel (English) |
XAUUSD: Gold Price Faces Key Resistance at 4220 Amid Fed Rate Hike Concerns, July 14, 2026
2026-07-14 @ 05:03
Over the past 24 to 48 hours, gold (XAUUSD) experienced a notable price decline, with yesterday’s closing price at $3,999.2 per ounce, slipping below the $4,000 threshold and pulling back from recent levels. This drop was primarily driven by rising oil prices fueling inflation fears, pushing the odds of a September Fed rate hike above 50%. This, in turn, lifted US Treasury yields, diminishing gold’s appeal as a safe-haven asset.
Market participants are also closely watching upcoming Consumer Price Index (CPI) data and Fed official Warsh’s testimony, which could signal important shifts in monetary policy, leading to increased volatility in investment strategies. Additionally, renewed tensions in the Middle East, particularly around the Hormuz Strait, have raised geopolitical risks, intensifying concerns that the Federal Reserve may maintain high interest rates for an extended period to combat persistent inflation. These intertwined developments have contributed to gold’s volatile and downward trend this week.
For the average investor, the last two days’ drop in gold prices reflect concerns that rising oil prices are driving inflation pressures higher, prompting markets to worry about more aggressive and prolonged Federal Reserve tightening. This serves as a reminder that gold’s role as a safe haven is currently challenged by macroeconomic data and policy uncertainty amid ongoing geopolitical disruptions.
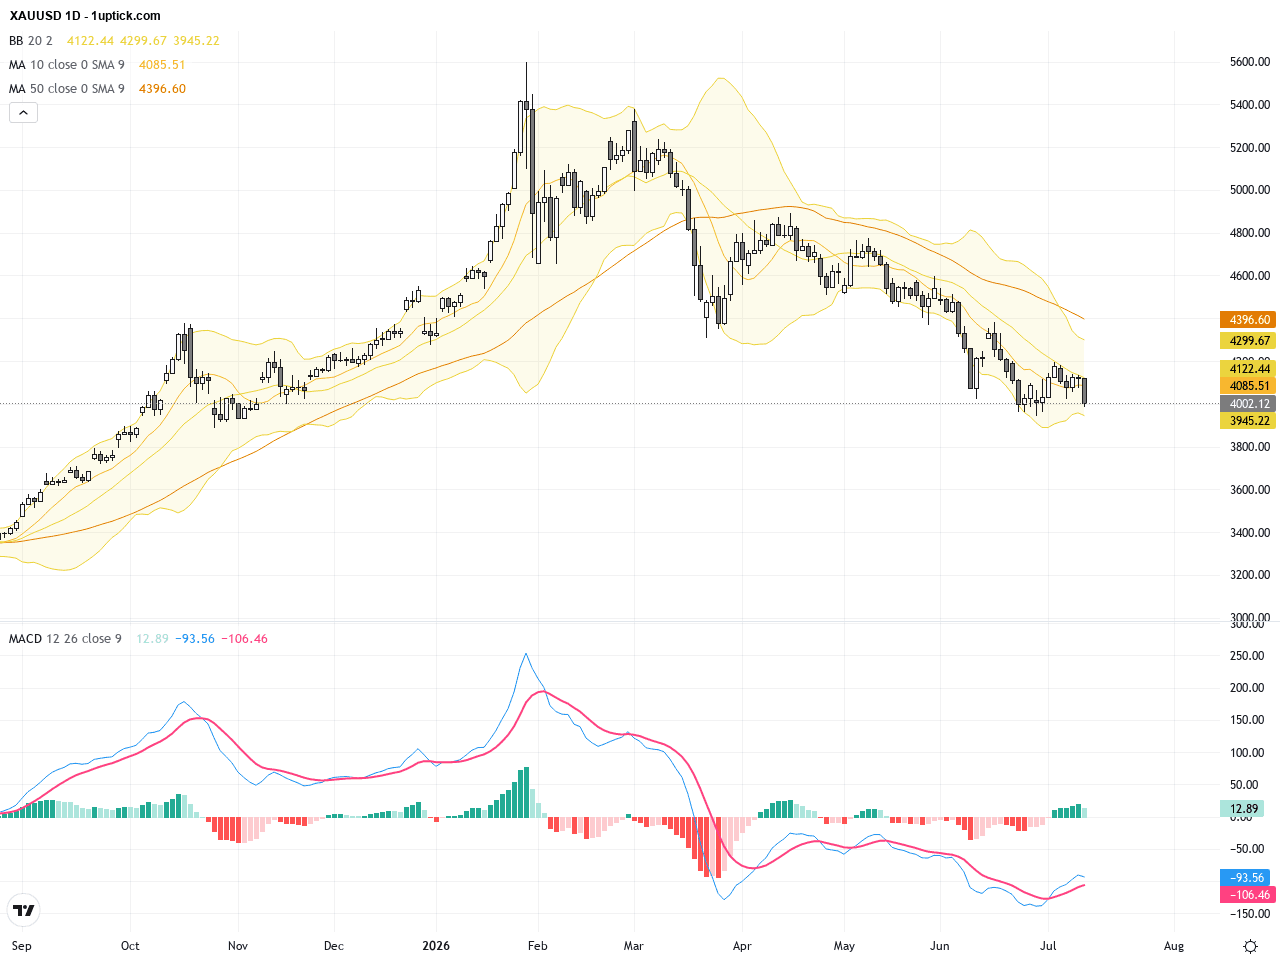
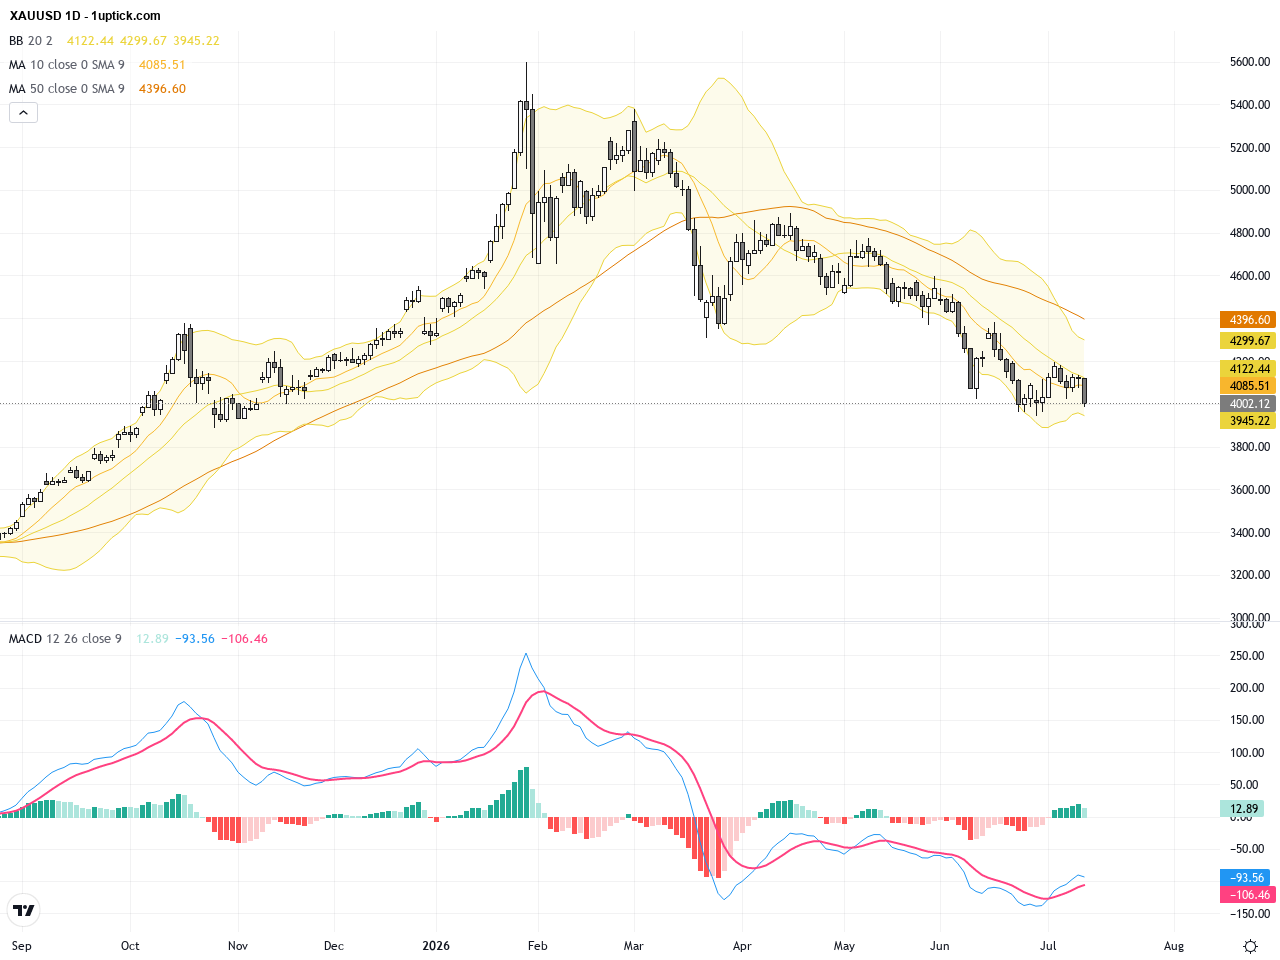
The daily chart shows XAUUSD initially trending upwards from around $4,000 in late June, breaking above $4,100 in early July before entering a correction phase. The 20-day and 50-day moving averages are converging, indicating indecision in the short-term trend. Bollinger Bands have started contracting, signaling reduced volatility, yet repeated attempts to break the key resistance around $4220 have failed, establishing a notable resistance zone. The MACD histogram is shrinking, hinting at weakening bullish momentum. Overall, the daily trend suggests high-level consolidation awaiting a clearer breakout direction.

Examining the last 3-5 days on the hourly chart, XAUUSD exhibits a clear downtrend, sliding from approximately $4,115 down to near $4,000. Short-term resistance sits near the Bollinger Bands middle line and the 20 EMA, where multiple breakout attempts were repelled. The MACD exhibits a bearish crossover with the RSI hovering close to 40, indicating dominance of bearish momentum. Recent candlesticks frequently display doji patterns, reflecting market indecision and a battle for support levels in the short run. The hourly setup suggests cautious monitoring is necessary to confirm if key supports will hold.
Technical Trend: The current XAUUSD trend is best described as “Cautiously Bearish”, with price consolidating near resistance and downward bias evident, though key supports remain intact for now.
Technically, XAUUSD is encountering multiple resistance layers, most notably near $4220. Declining volume and shrinking momentum suggest weakening bullish energy. The MACD’s bearish crossover and a RSI level above oversold territory indicate the downtrend may continue. Frequent doji candles show market hesitation, signaling no clear winner between buyers and sellers yet. Fundamental factors like oil-fueled inflation fears and hawkish Fed expectations have capped gold’s upside. Traders should stay alert for fresh catalysts or economic data that might prompt volatility bursts.No major economic events directly impacting XAUUSD are scheduled today. However, traders should watch for speeches by US FOMC members Waller and Bowman which may influence Fed rate hike prospects. Additionally, Norway’s manufacturing production slightly exceeded expectations, offering limited but indirect insight into global inflation pressures. The focus remains on USD and Treasury yield movement as key drivers for gold price direction.
Resistance & Support

The above financial market data, quotes, charts, statistics, exchange rates, news, research, analysis, buy or sell ratings, financial education, and other information are for reference only. Before making any trades based on this information, you should consult independent professional advice to verify pricing data or obtain more detailed market information. 1uptick.com should not be regarded as soliciting any subscriber or visitor to execute any trade. You are solely responsible for all of your own trading decisions.