

 |
| Gold V.1.3.1 signal Telegram Channel (English) |
USDCAD Technical & Fundamental Analysis: Oil Price Correction Caps Gains, Eyes on 1.4200 Resistance, July 28, 2026
2026-07-28 @ 13:01
Over the past 24 to 48 hours, the USD/CAD pair has experienced notable volatility. Starting from yesterday’s closing price of 1.4123, the exchange rate fluctuated modestly under the dual influence of international energy markets and geopolitical risks. With Trump’s announcement to pause attacks against Iran, oil prices slid, driving a decline in safe-haven demand and putting temporary pressure on the US dollar against the Canadian dollar.
The news reveals that with tensions between the US and Iran easing, risk appetite has improved, prompting the dollar to retreat against most G10 currencies. However, the drop in oil prices simultaneously limited the Canadian dollar’s rebound. The uncertainty surrounding the Federal Reserve’s interest rate decisions, coupled with the Bank of Canada’s consecutive six rate holds, has added to USD/CAD price movements. Overall, oil prices remain a key driver for the Canadian economy and its currency, while the US dollar appears softer amid fluctuating risk sentiment.
For everyday investors, this market movement is a direct reflection of global geopolitical developments and energy supply-demand dynamics playing out in currency markets. When geopolitical risks ease and oil prices retreat, the dollar dips briefly due to increased risk appetite; but since Canada is an oil exporter, falling oil prices restrict the CAD’s strength, resulting in a range-bound USD/CAD price consolidation.
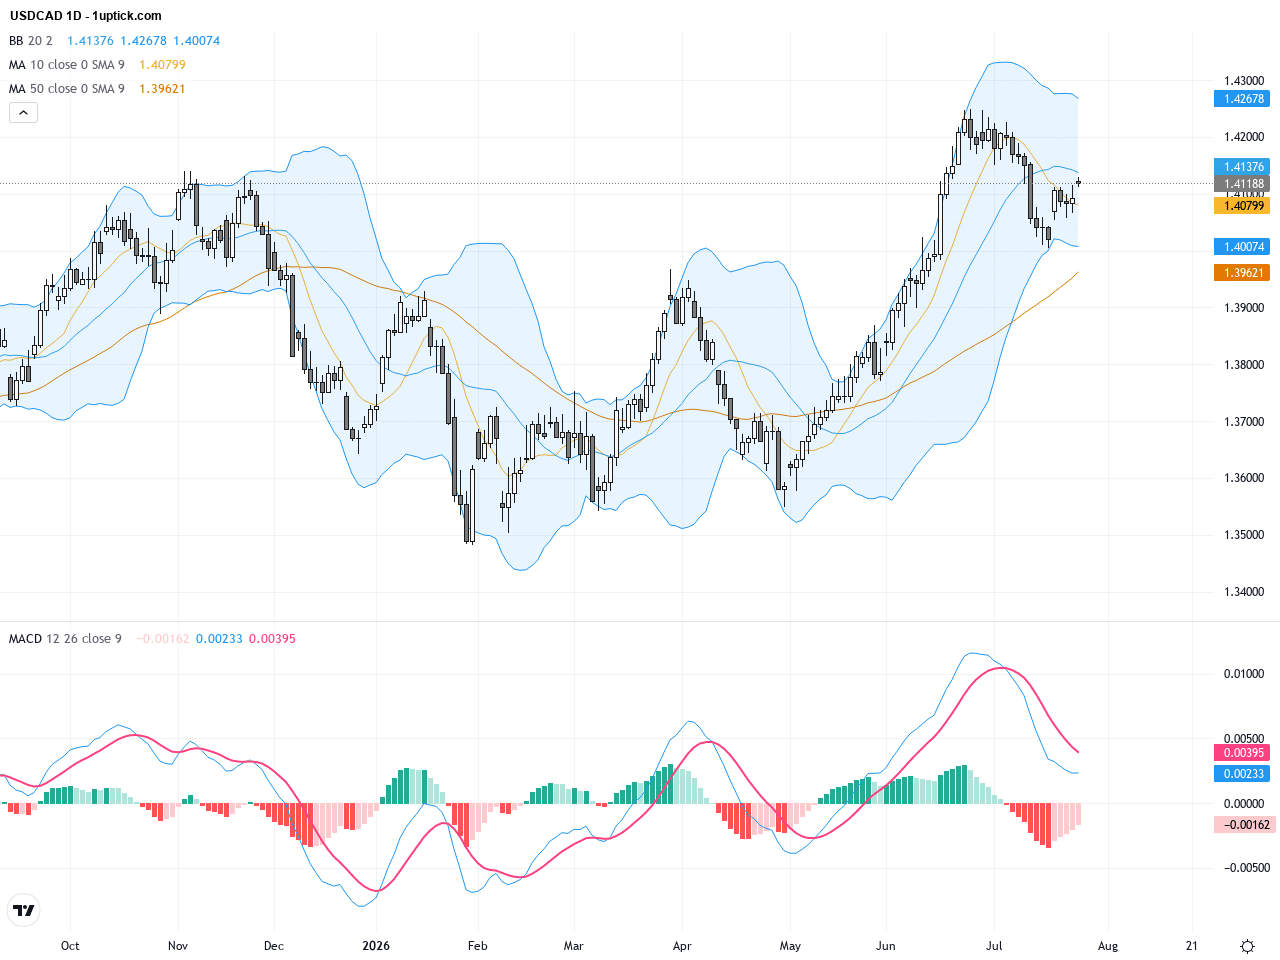
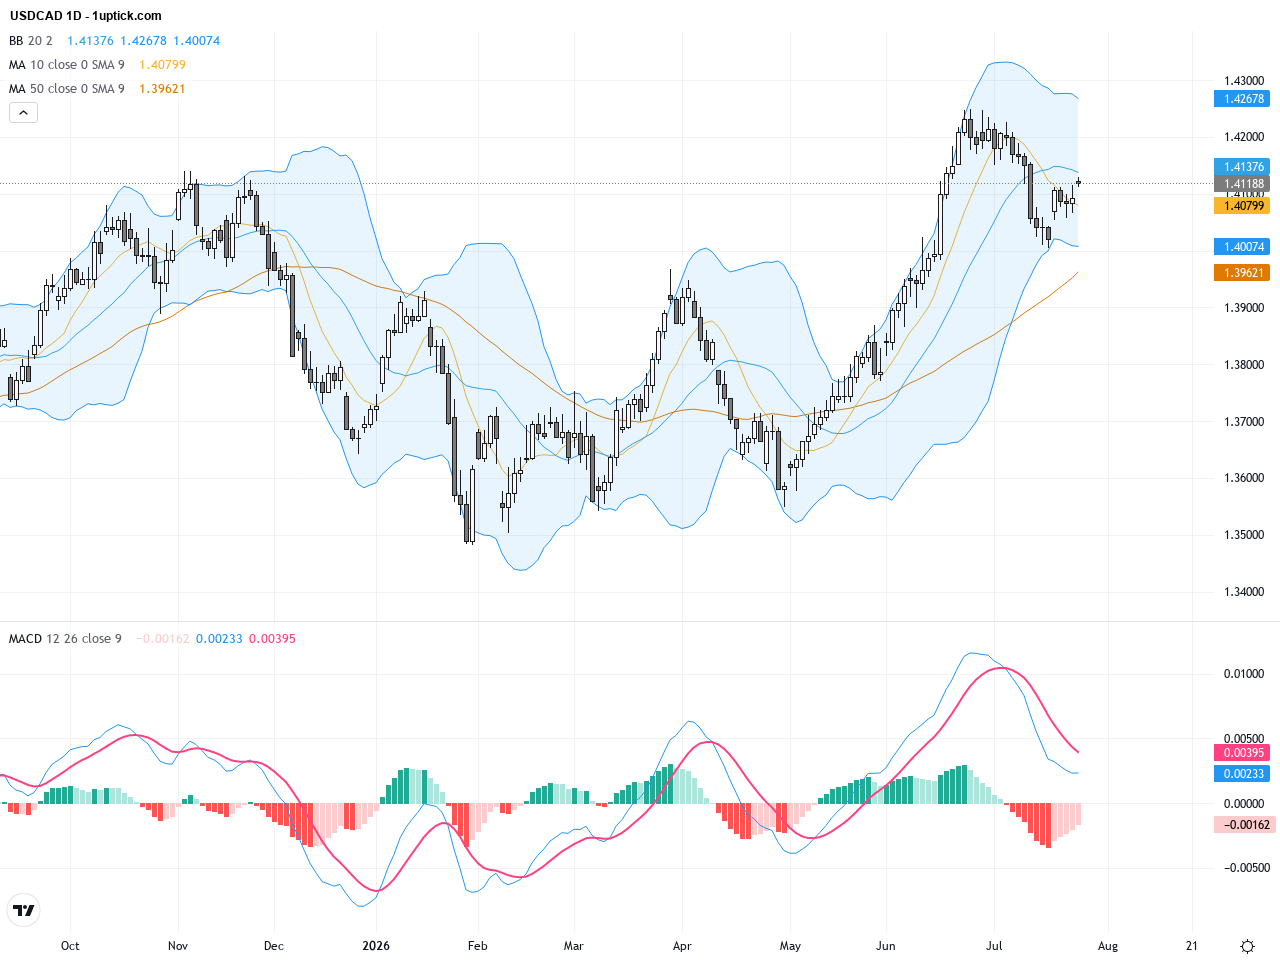
The daily chart shows USDCAD maintaining a moderate uptrend since mid-July, gradually ascending towards the 1.42 area. The 50-day moving average continues to support prices, while the 200-day moving average remains below, indicating a healthy longer-term bullish trend. Bollinger Bands are widening, signaling increased volatility. The MACD histogram is slightly shrinking but remains positive, suggesting ongoing upward momentum. This technical setup indicates the potential for a short-term pullback before another attempt to break resistance.
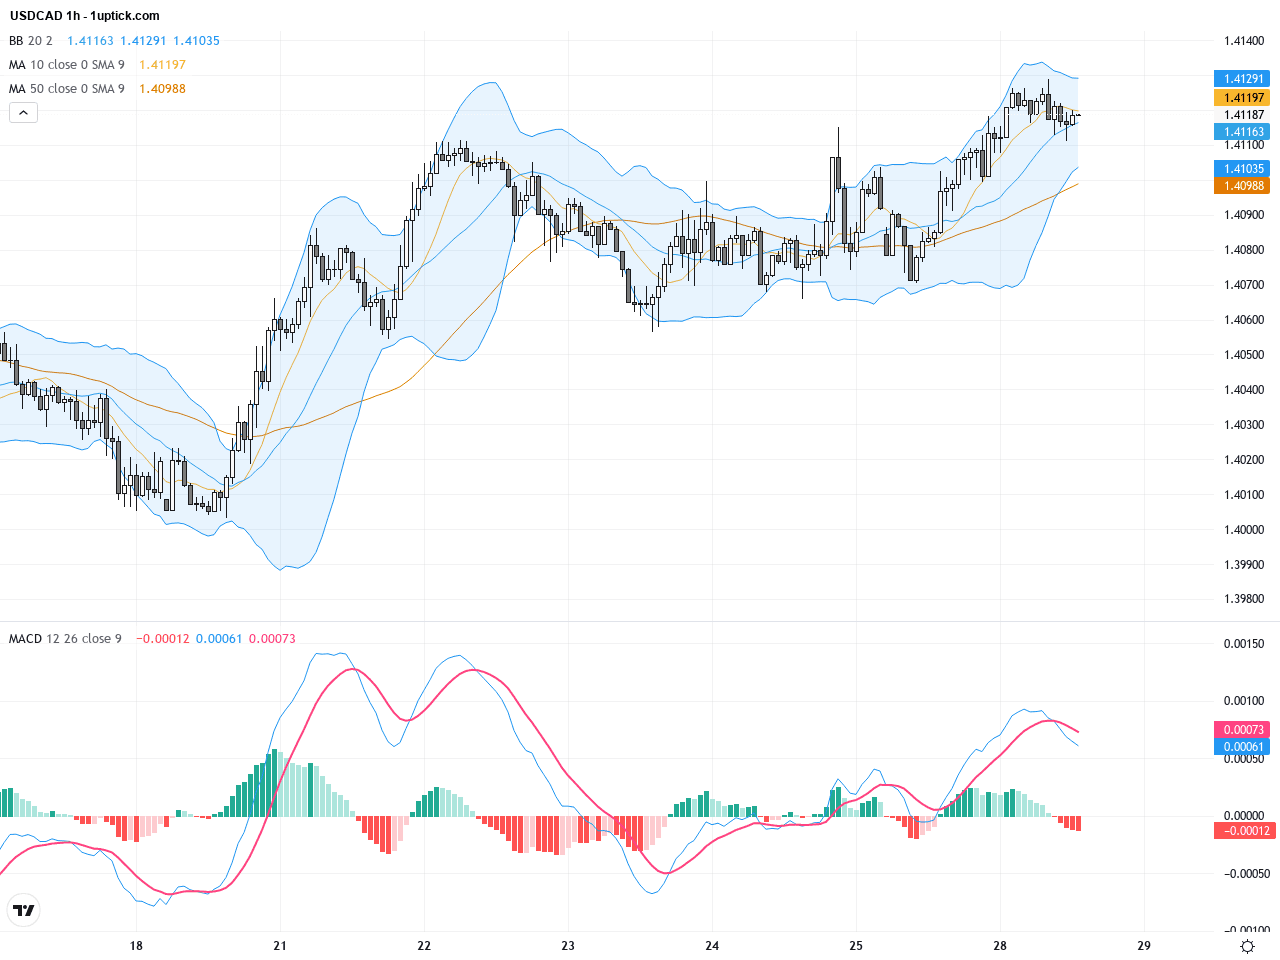
The past 3-5 days on the hourly chart reveal USDCAD oscillating within a narrow 1.4080 to 1.4140 range, forming a consolidation pattern. Short-term moving averages (20 and 50 EMA) are converging, with the MACD showing a crossover but no clear trend continuation signal. The tightening Bollinger Bands suggest an impending breakout. A recent bullish engulfing candlestick indicates renewed buy interest, with the market awaiting oil price and Fed news to confirm direction.
Technical Trend: Sideways with a bullish bias, the pair shows cautious optimism awaiting a decisive breakout above 1.4200, indicating moderate upward momentum.
Technically, USDCAD is trading near critical resistance between 1.4150 and 1.4200. Oil price declines weigh on the CAD, but diminishing USD safe-haven demand limits downside for USD. The MACD suggests potential short-term momentum shifts. A breakout above 1.4200 could open a fresh leg higher. The recent bullish engulfing pattern supports near-term rebound prospects. Investors should monitor volume confirmation around these levels for trend validation.Today’s GMT+1 economic calendar features no major events directly impacting USDCAD. While US data releases such as international trade and consumer confidence could influence the USD in the medium term, immediate volatility is expected to be limited. No significant Canadian data is scheduled. Thus, oil prices and geopolitical developments remain the primary price drivers. Traders should watch Fed policy cues ahead of the weekend.
Resistance & Support

The above financial market data, quotes, charts, statistics, exchange rates, news, research, analysis, buy or sell ratings, financial education, and other information are for reference only. Before making any trades based on this information, you should consult independent professional advice to verify pricing data or obtain more detailed market information. 1uptick.com should not be regarded as soliciting any subscriber or visitor to execute any trade. You are solely responsible for all of your own trading decisions.