



 |
| Gold V.1.3.1 signal Telegram Channel (English) |
WTI Crude Oil: Geopolitical Cooling Sparks Sharp Decline with Key Support and Resistance Levels, July 28, 2026
2026-07-28 @ 06:03
Over the past 24 to 48 hours, WTI crude oil prices have experienced significant volatility, closing sharply lower from the July 27 closing price of $82.61. This downward movement was primarily driven by easing tensions between the U.S. and Iran. As both sides paused attacks, concerns over Middle East geopolitical risks subsided, sending oil prices plunging to lows not seen in nearly two months. This reflects an immediate market reaction to reduced risk of supply disruptions, with investors adjusting positions towards a more stable oil price outlook.
For the average investor, think of crude oil like an insurance policy reflecting geopolitical tensions. When hostilities pause, it’s akin to a lowered risk, causing the insurance premium—the oil price—to drop substantially. The sharp price swings during this period highlight the market’s sensitivity and direct reaction to geopolitical news, underscoring the importance of closely monitoring such developments to navigate potential volatility.
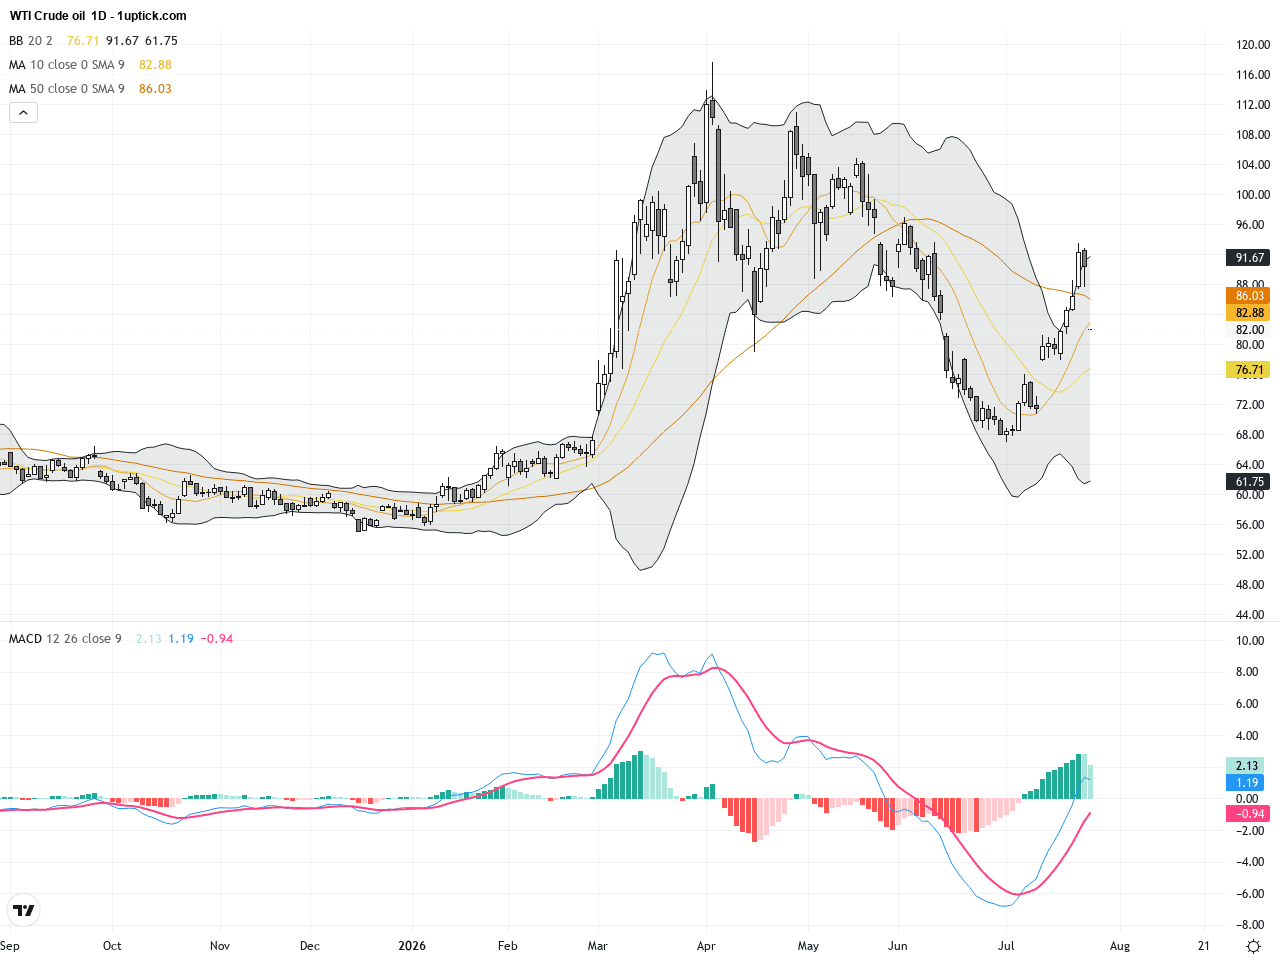
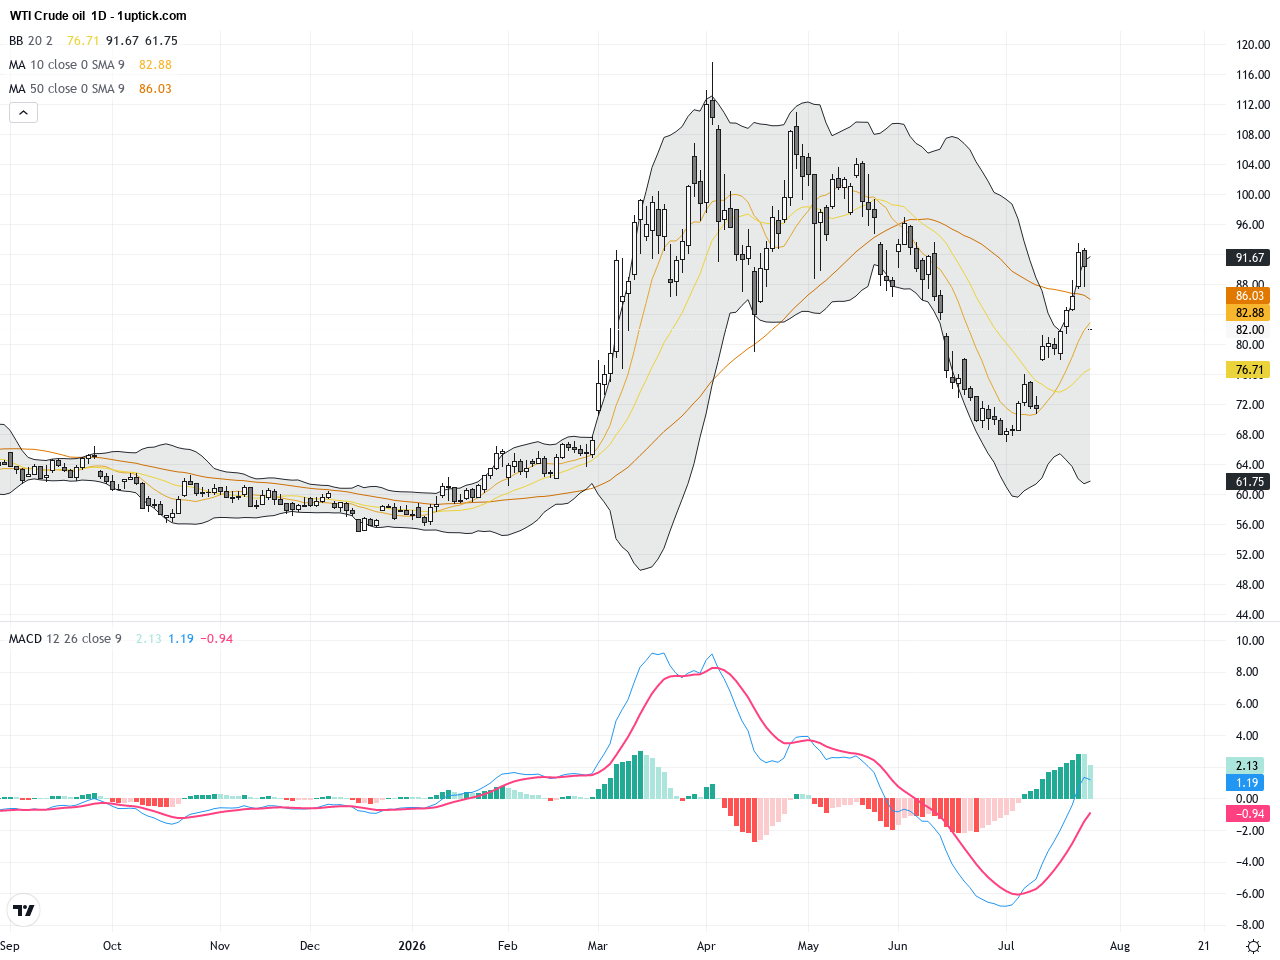
The WTI daily chart illustrates a trend of initial upward momentum followed by sharp retracement. Since mid-July, prices rallied to a peak at $92.19, then began a strong decline starting July 24, touching a low of $81.63 yesterday. Technically, the price has moved below the 50-day moving average, Bollinger Bands are tightening with price near the lower band, indicating increased selling pressure. The MACD has formed a bearish crossover signaling weakening medium-to-long term momentum, suggesting traders should watch for any reversal signs carefully.
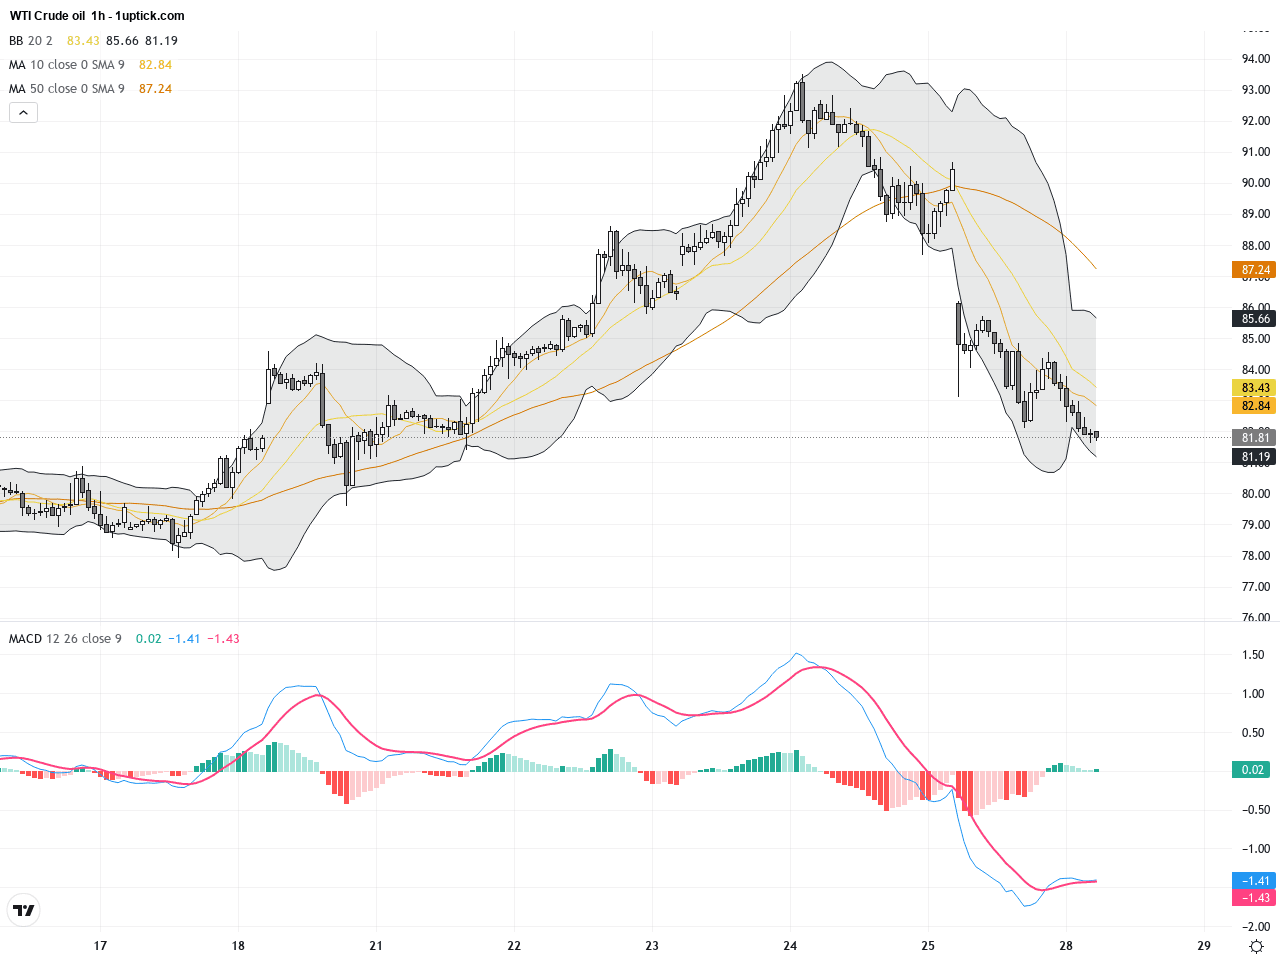
The WTI hourly chart depicts heightened volatility over the past 3-5 days. Starting July 27, prices plunged sharply, stabilizing around $82 briefly. The MACD continues downward with a bearish crossover, and RSI is nearing oversold territory suggesting a potential short-term bounce. Bollinger Bands are widening, signaling increased volatility. Short-term traders should exercise caution as swift price reversals remain possible.
Technical Trend: Trend is described as ‘Cautiously Bearish’ with evident selling pressure and technical indicators pointing towards a continuation of downtrend, while market sentiment waits for the next major news catalyst.
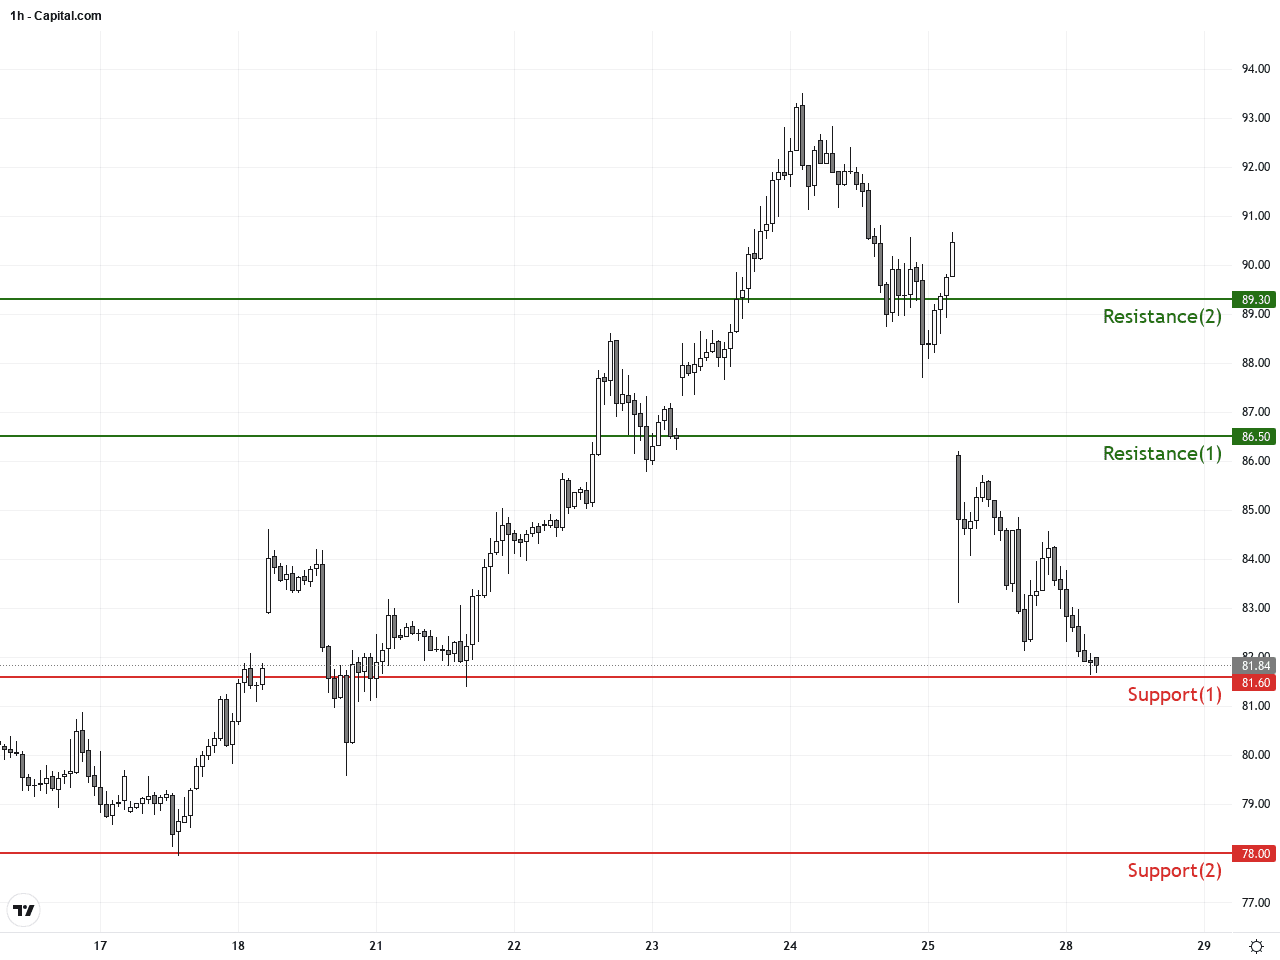
Technical analysis indicates a cautiously bearish stance for WTI crude oil. The MACD bearish crossover and price falling below key moving averages signal a continuation of downward pressure. Although the price is near the Bollinger Bands lower boundary and RSI is oversold—suggesting a chance for a short bounce—the broader supply-demand and geopolitical context remains unfavorable. Traders should monitor whether key support levels hold and look for clear reversal signals before entering positions to manage risk effectively.There are no significant or direct economic events scheduled today that would impact WTI crude oil prices. Market focus remains on Middle East geopolitical developments and supply-demand fundamentals, with future price movements hinging on further news from these fronts.
Resistance & Support
Run Live WTI Crude Oil Analysis
The above financial market data, quotes, charts, statistics, exchange rates, news, research, analysis, buy or sell ratings, financial education, and other information are for reference only. Before making any trades based on this information, you should consult independent professional advice to verify pricing data or obtain more detailed market information. 1uptick.com should not be regarded as soliciting any subscriber or visitor to execute any trade. You are solely responsible for all of your own trading decisions.