


 |
| Gold V.1.3.1 signal Telegram Channel (English) |
XAUUSD Gold Price Analysis: Navigating Key Support and Technical Patterns Amid Volatility, September 1, 2026
2026-09-01 @ 05:04
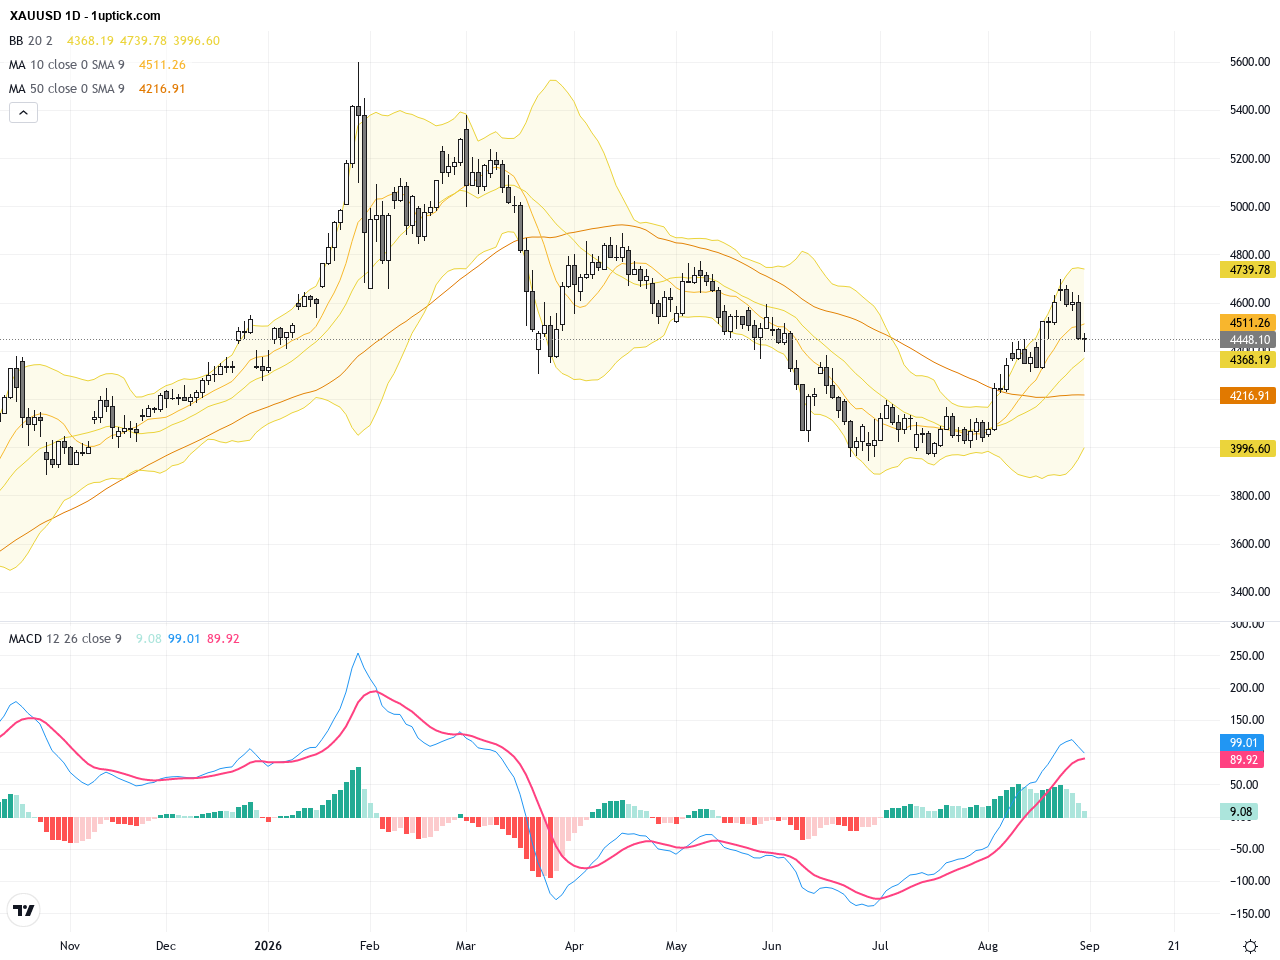
Over the past 48 hours, the gold market (XAUUSD) has experienced significant volatility, with prices briefly dipping below $4,400 per ounce during the Asian session on August 31 and continuing Friday’s selloff. The closing price that day reached $4,446.97, slightly recovering compared to $4,425.20 on August 30.
Recent developments, including escalating geopolitical tensions between the US and Iran and the Larak Island strike pushing oil prices back above $90, have increased market uncertainty. Additionally, Federal Reserve official Warsh’s hawkish comments at the Jackson Hole conference about inflation concerns and possible further rate hikes have intensified expectations for monetary tightening. These factors have weighed on gold’s appeal as a safe haven, leading to sensitive price swings as traders balance between risk aversion and rate hike risks.
For the average investor, this period’s price fluctuations indicate that gold remains a crucial risk management tool amid global political and economic uncertainties. However, it is also important to be mindful that with tightening monetary policy, gold prices may face short-term pressure. Investors should closely monitor updates on global oil prices, the Middle East situation, and Fed rate policies to effectively manage risks in their portfolio allocations.
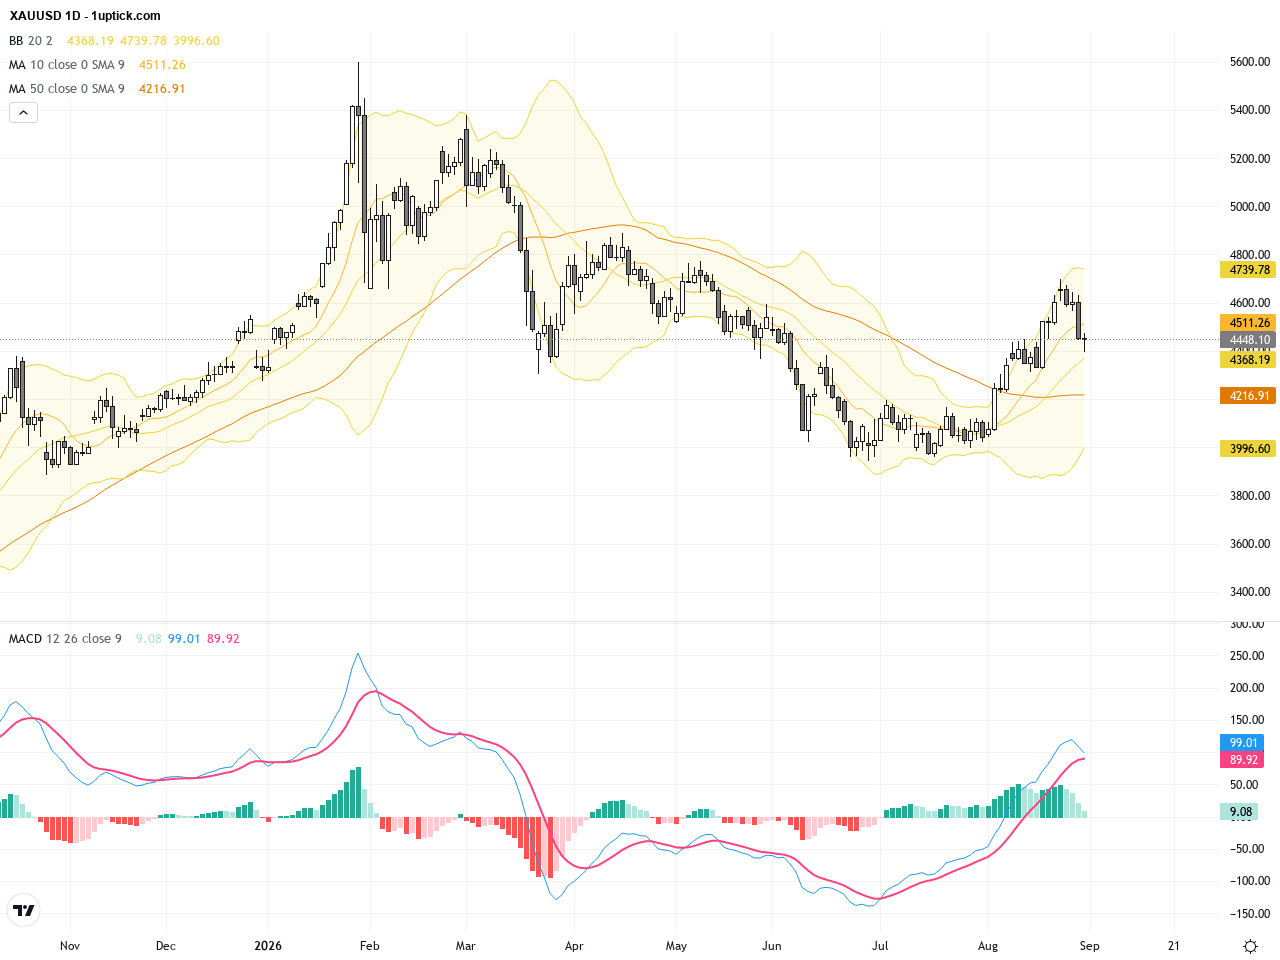
The XAUUSD daily chart reveals a downward correction from early month highs near 4750, with prices consolidating around the 4400-4500 range. The Bollinger Bands show price oscillating near the middle band, with the 20-day moving average trending lower, indicating a medium-term bearish bias. The MACD remains in negative territory without clear reversal signals yet. This chart suggests that while the broader trend has been bearish, the current consolidation zone could serve as a base for a potential bounce if support holds. Traders should focus on volume confirmations to gauge trend strength.
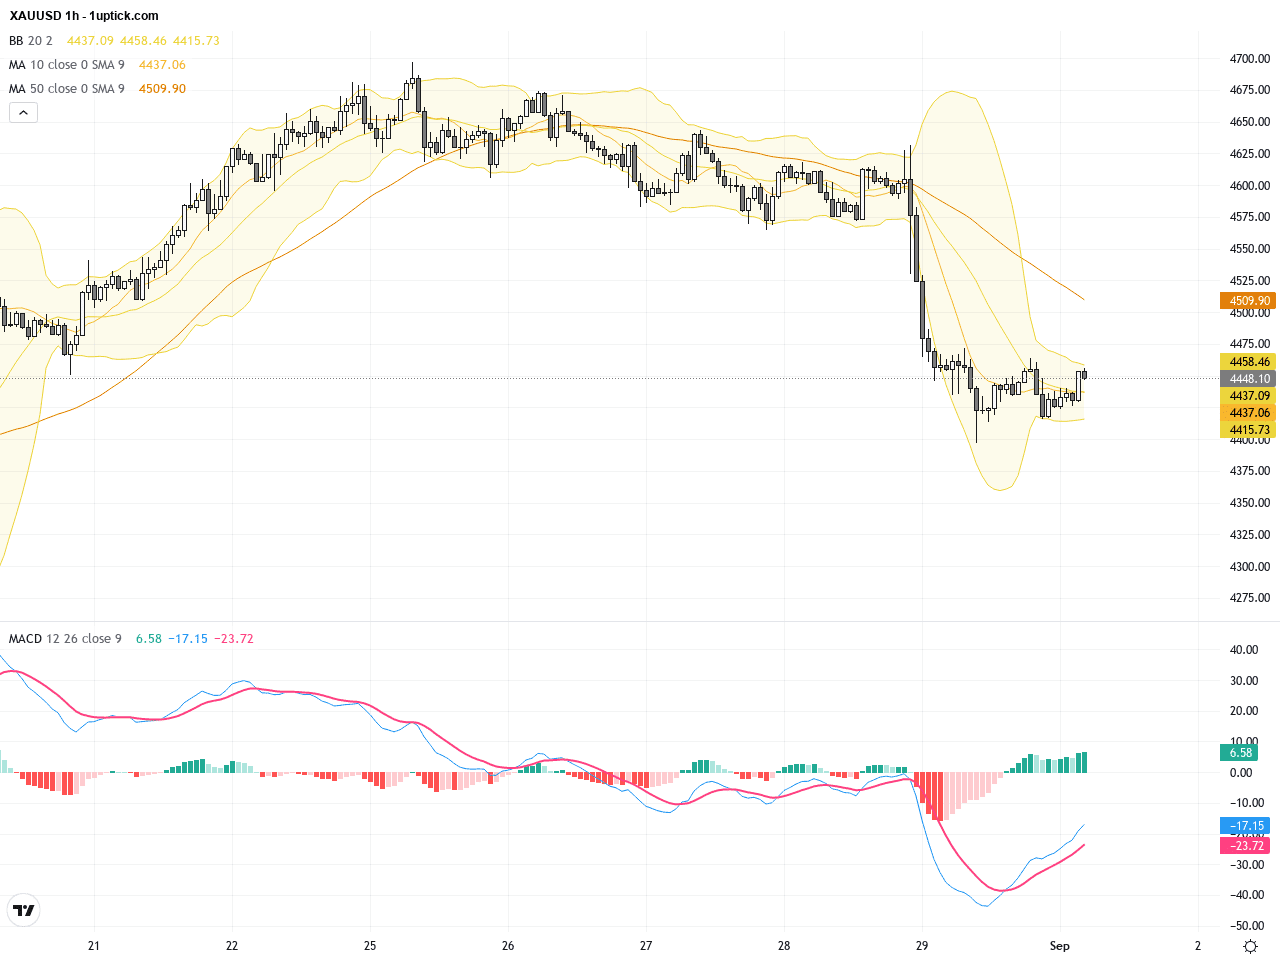
The hourly chart of XAUUSD over the past 3–5 days displays heightened volatility between 4440 and 4470. Short-term moving averages have crossed, suggesting momentum shifts and potential indecision. The Bollinger Bands have tightened, signaling decreased volatility and a potential breakout window. The MACD, while weak, shows emerging divergence signals. Recent hammer candlesticks indicate short-term buying interest, making the next 24 hours critical to see if price can push above resistance near 4470 for a trend reversal.
Technical Trend: The current XAUUSD trend is ‘Cautiously Sideways’, reflecting tight consolidation and indecision. Traders should watch for key technical level breaches to capture directional moves.
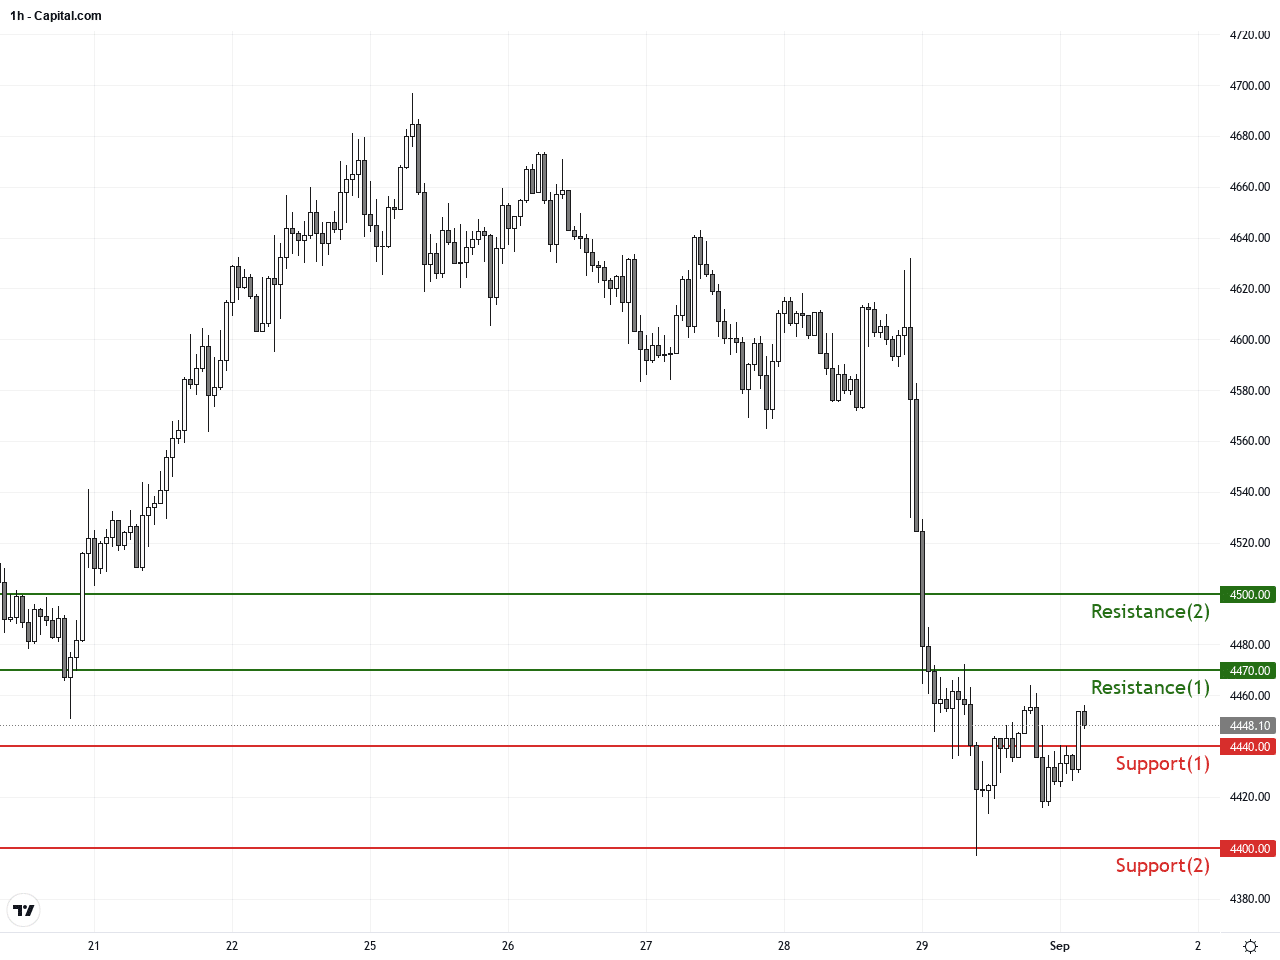
Technically, XAUUSD is in a consolidation phase on both daily and hourly charts, with Bollinger Bands and MACD indicating compressed volatility and anticipation for a breakout. The daily trend remains downward, but holding the 4400 support is key to launching a short-term rebound. Hourly hammer candles and moving average crosses hint at renewed buying interest. Monitoring volume and price action in the near term is essential to confirm high-probability trade setups.Today’s GMT+1 economic calendar features Japanese industrial production and retail sales data outperforming expectations, which bolsters the yen but has limited impact on gold. China’s manufacturing PMI data slightly beat forecasts, reflecting economic stability. Overall, no major economic events today are directly pertinent to XAUUSD, leaving geopolitical developments and US dollar dynamics as primary drivers of gold price action.
Resistance & Support
The above financial market data, quotes, charts, statistics, exchange rates, news, research, analysis, buy or sell ratings, financial education, and other information are for reference only. Before making any trades based on this information, you should consult independent professional advice to verify pricing data or obtain more detailed market information. 1uptick.com should not be regarded as soliciting any subscriber or visitor to execute any trade. You are solely responsible for all of your own trading decisions.