

 |
| Gold V.1.3.1 signal Telegram Channel (English) |
EURUSD Technical Analysis: 200-day SMA Resistance Caps Euro Amid Dollar Strength, September 2, 2026
2026-09-02 @ 09:01
The EUR/USD currency pair has exhibited weakness over the past 24 to 48 hours, struggling to break above the 200-day Simple Moving Average near 1.1633. Yesterday’s closing price stood at 1.15832, with intraday lows dipping to approximately 1.15880, underscoring the U.S. dollar’s recent strength putting significant pressure on the euro.
Market sentiment has been heavily influenced by hawkish commentary from Fed official Warsh at the Jackson Hole symposium, reinforcing expectations of a September rate hike. This has lifted the U.S. dollar index, directly weighing on the euro as investors shift towards the greenback amid escalating global geopolitical tensions. The euro’s inability to surpass key moving average resistance highlights market concerns over the European economic outlook alongside increasing demand for the dollar’s safe-haven appeal.
For the average investor, this dynamic can be seen as a situation where, when the dollar gains attractiveness, weaker currencies like the euro naturally retreat—similar to buyers favoring assets perceived as more stable and promising in a competitive marketplace. Investors should therefore closely monitor Fed policy signals and evolving geopolitical risks as these factors will continue to drive near-term volatility in currency prices.
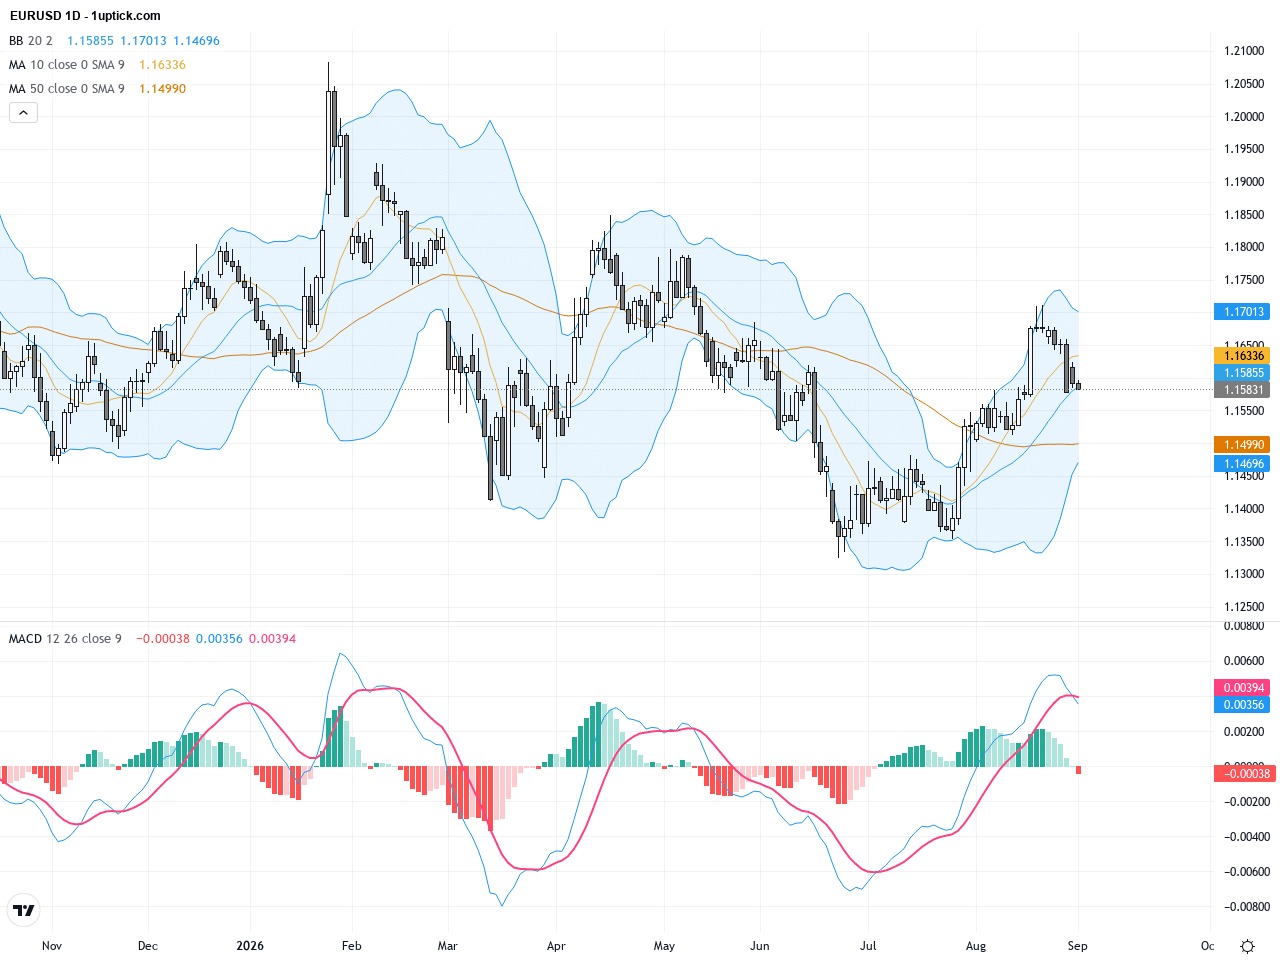
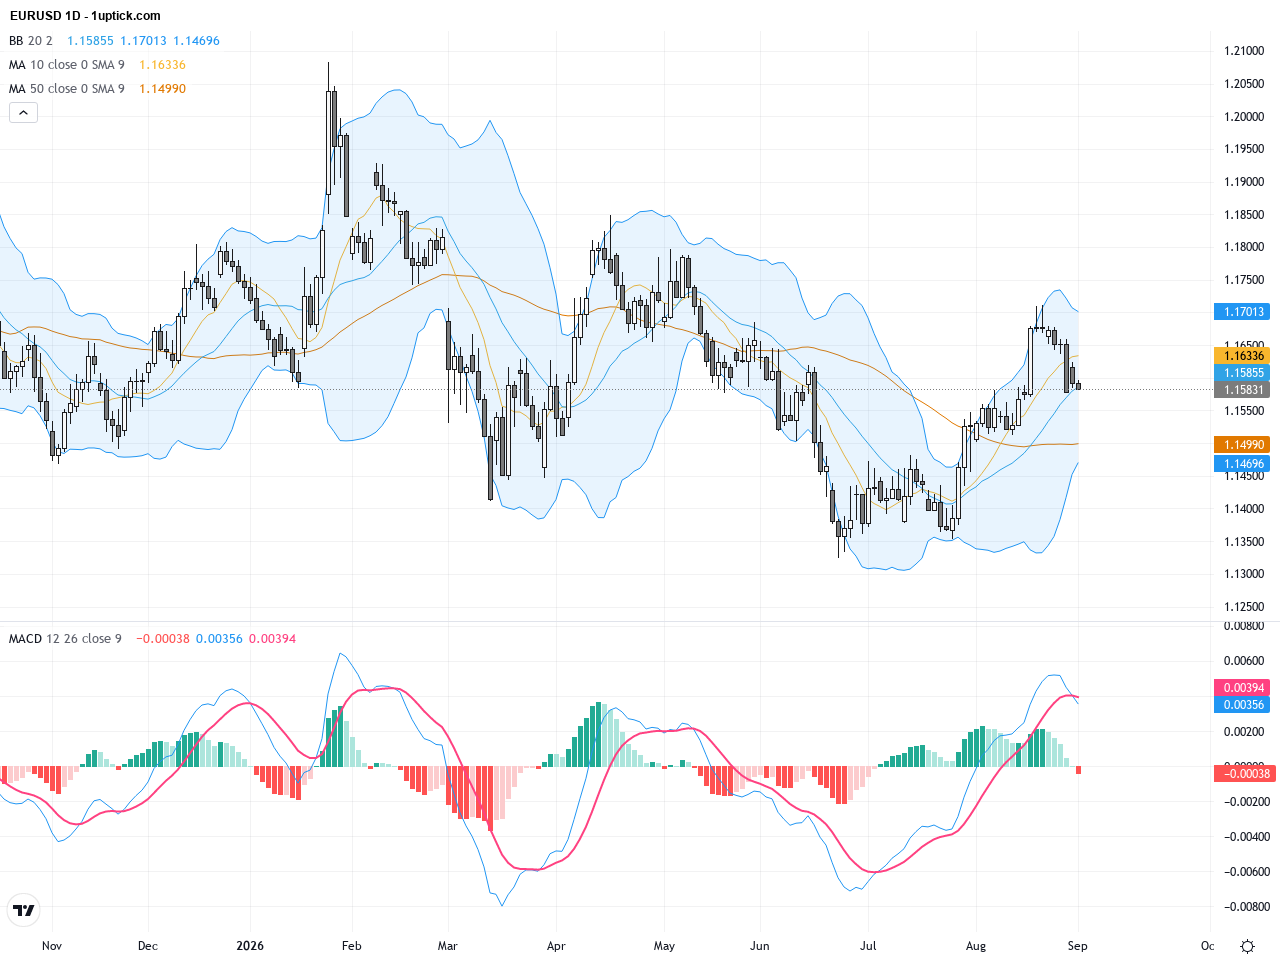
The daily chart shows EURUSD declining from mid-year highs, trading within a 1.158 to 1.163 range. The 200-day SMA at approximately 1.1633 acts as a notable resistance, preventing further upside. Bollinger Bands have narrowed, indicating reduced volatility. The MACD remains in negative territory with no clear bottom divergence forming, signaling a short-term bearish tone that requires monitoring for potential reversals.
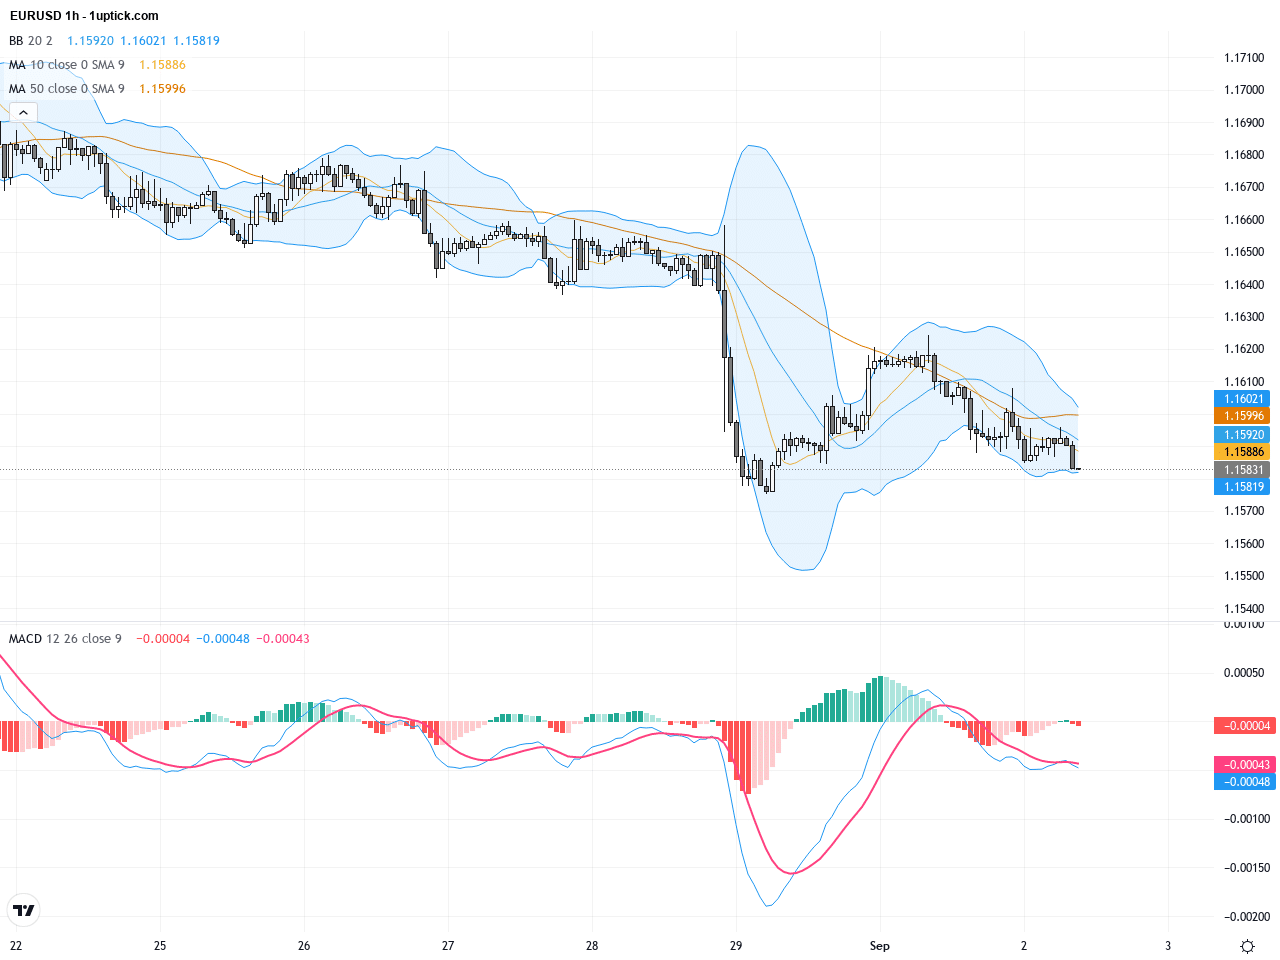
On the hourly chart, over the past 3-5 days, EURUSD shows a short-term bearish trend with a recent moving average death cross. The pair has repeatedly failed to breach the 1.1600 resistance level, forming lower highs and lows. The lower Bollinger Band provides some support, and shrinking MACD histogram bars may suggest weakening bearish momentum. The price action resembles a corrective wave, highlighting short-term selling rallies and potential bounce zones.
Technical Trend: EURUSD is currently in a cautiously bearish consolidation phase, characterized by a gentle downtrend on daily charts and potential short-term rebounds in intraday sessions.
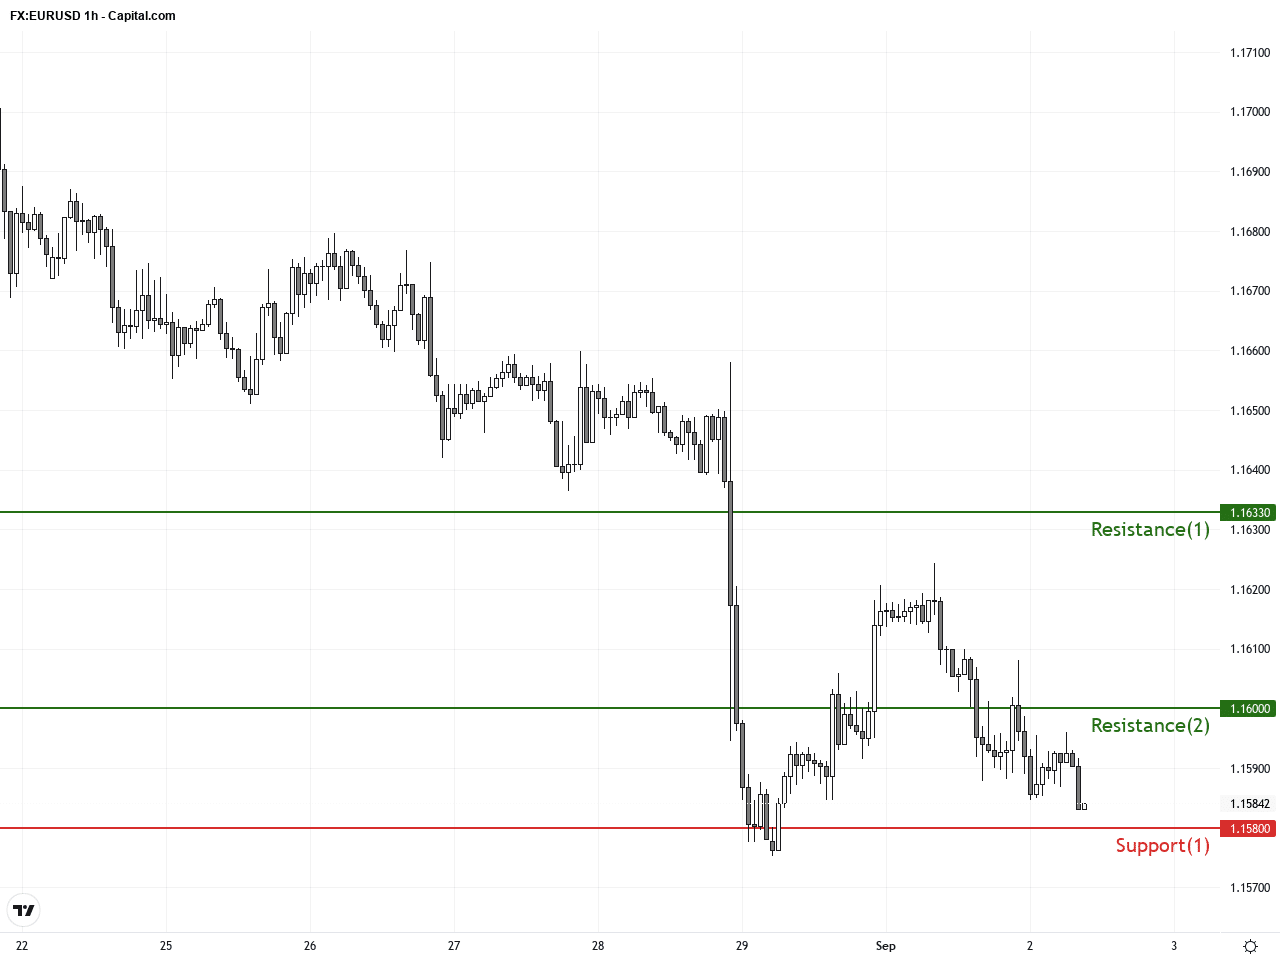
EURUSD’s technical indicators such as MACD and RSI still indicate bearish bias, though short-term oversold conditions suggest possible bounces. Volume remains moderate, reflecting cautious investor sentiment. Maintaining support near 1.1580 would be critical for any short-term recovery. Traders should watch for a clear breakout above the 200-day SMA to confirm trend reversal, while short-term trades could use hourly chart bounce signals with appropriate risk management.Today, there are no major eurozone economic releases, though Bundesbank Chairman Nagel’s speech may attract attention but is unlikely to cause significant impact. Australian and New Zealand GDP and rate decisions are expected, but have limited direct influence on EURUSD. US data releases later in the day, such as ADP employment and durable goods orders, might strengthen the dollar if results exceed expectations, thereby putting further pressure on EURUSD. Overall, no major direct event is expected to drive EURUSD significantly today; technicals and macro news remain focal points.
Resistance & Support
The above financial market data, quotes, charts, statistics, exchange rates, news, research, analysis, buy or sell ratings, financial education, and other information are for reference only. Before making any trades based on this information, you should consult independent professional advice to verify pricing data or obtain more detailed market information. 1uptick.com should not be regarded as soliciting any subscriber or visitor to execute any trade. You are solely responsible for all of your own trading decisions.