









 |
| Gold V.1.3.1 signal Telegram Channel (English) |
USDCAD: Bearish Momentum Persists as Price Struggles Below 1.38 Resistance, September 10, 2026
2026-09-10 @ 13:01
Over the past 48 hours, the USD/CAD pair has largely continued its subdued trading seen yesterday, closing at 1.38088 with a modest gain of 0.03% from the previous day. During European trading hours, the pair hovered around 1.3780, maintaining a clear bearish bias. The market has been primarily influenced by several key news events, most notably the sharp criticism from former U.S. President Trump, who labeled the current USD/CAD exchange rate as “unacceptable.” This rhetoric has intensified trade tensions between the two countries and contributed significantly to the recent volatility in the pair.
Despite Trump’s comments, the Canadian dollar has shown resilience, supported by the Bank of Canada’s cautious stance, which acts as a brake on excessive Canadian dollar strength. Analysis from Scotiabank highlights that the Canadian dollar is not significantly misaligned from its fundamental values at present. Additionally, hawkish remarks from officials at the Jackson Hole economic symposium gave the U.S. dollar some renewed strength, partially offsetting downside pressure caused by trade frictions. This environment has created a cautious tug-of-war between the USD and CAD, resulting in heightened short-term volatility but a slight overall edge for the U.S. dollar.
For the average investor, the recent market action resembles a high-stakes duel on the international stage where political rhetoric and economic fundamentals pull exchange rates in opposing directions. Trump’s aggressive statements have acted like a loud cheer from the sidelines, stirring short-term market reactions, while the Bank of Canada’s steady hand plays the role of a careful coach, avoiding extreme swings. Investors should stay alert to ongoing developments and approach trading with caution, as any further changes in trade policy could trigger sharp moves in the USD/CAD exchange rate.
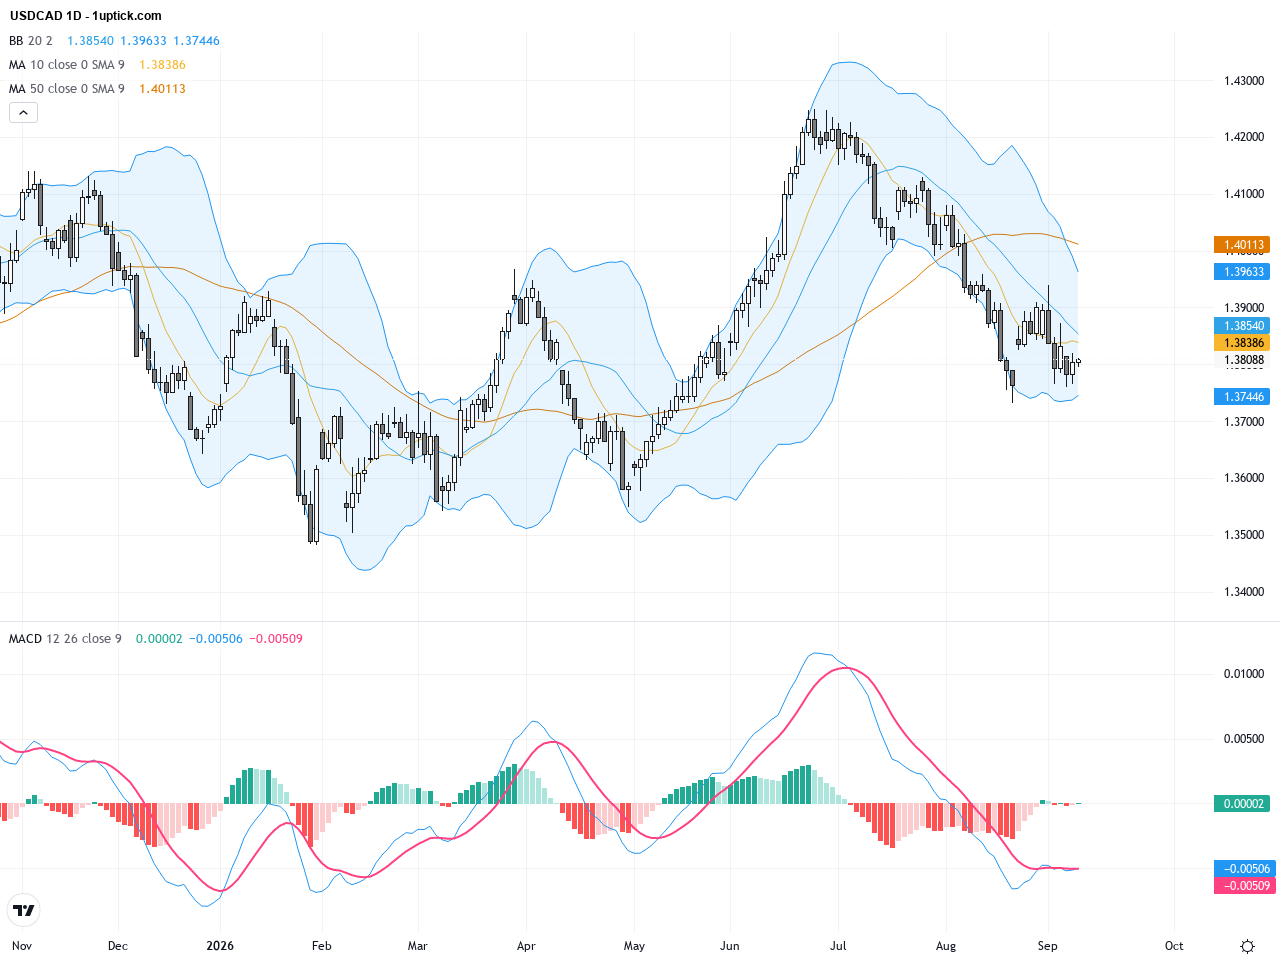
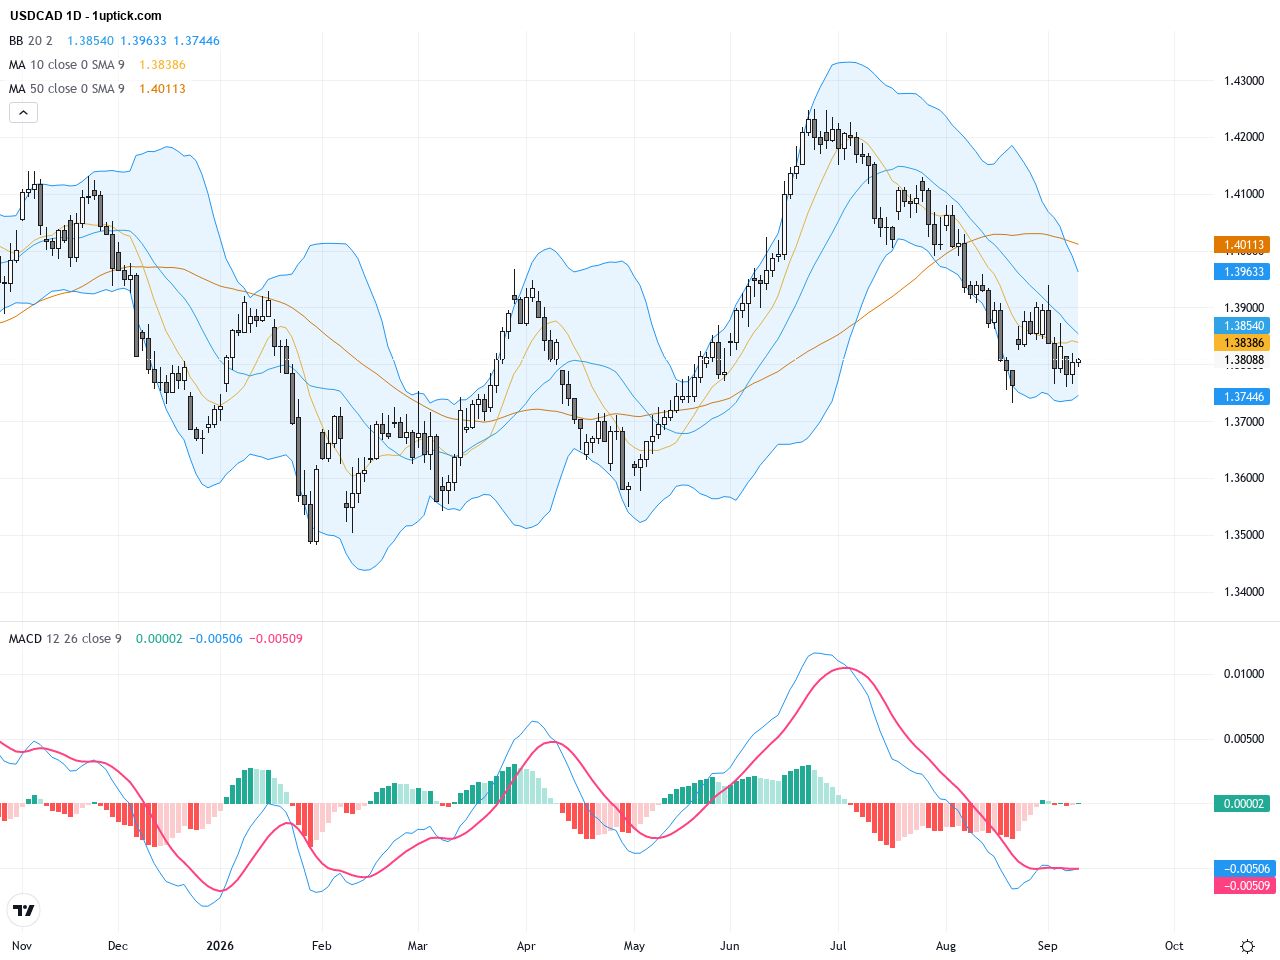
The daily chart shows a clear downtrend for USDCAD, with prices steadily retreating from above 1.39 to hover near 1.38. The 20-day and 50-day moving averages are converging, with the 20-day EMA acting as a resistance level, signaling weakening short-term bullish momentum. Bollinger Bands are tightening, indicating reduced volatility ahead. The MACD remains below zero, though momentum bars suggest slowing downward momentum. Overall, the trend is bearish with risk of further downside.
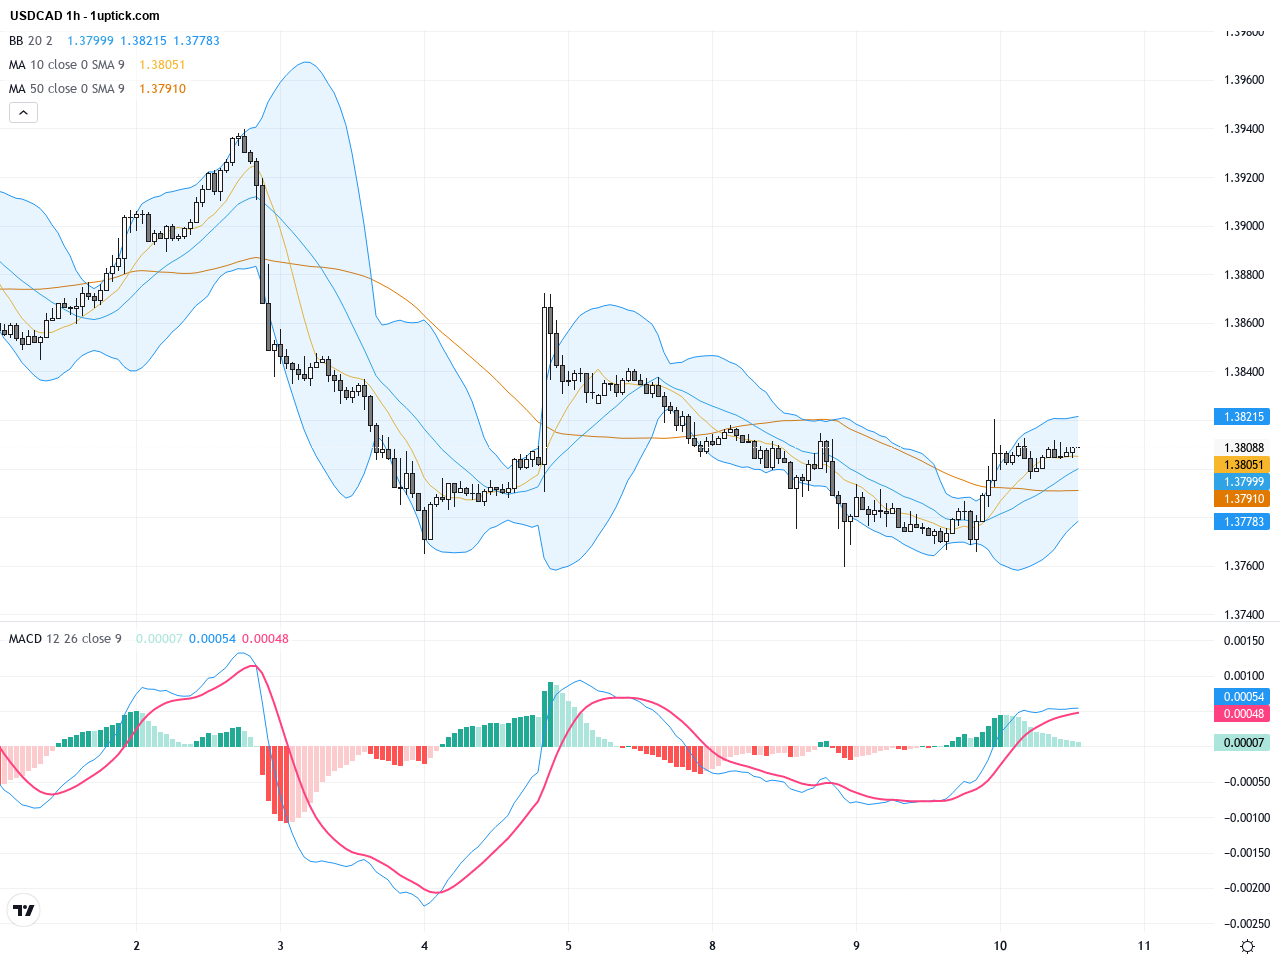
On the hourly chart over the past 3-5 days, USDCAD has pulled back from around 1.3850 to find support near 1.3780. Short-term moving averages have formed a bearish crossover, and prices have bounced repeatedly off the lower Bollinger Band, suggesting short-term consolidation. The MACD is negative and expanding, indicating nearby increases in bearish momentum. While bears remain dominant short-term, brief rebound potential exists.
Technical Trend: Cautiously Bearish
Technically, USDCAD is in a sustained downtrend with clear resistance from the 20-day EMA on the daily chart and a tug-of-war between buyers and sellers indicated by recent Doji candlesticks. Momentum indicators like MACD and RSI suggest bearish bias but a waning momentum. The immediate 24-hour outlook points to continued conflict around key support levels, where traders might find high-probability opportunities for either continuation of the downtrend or a corrective bounce.Today’s European Central Bank rate decision and US Producer Price Index releases are key economic events likely impacting USDCAD. The ECB is expected to increase the refinancing rate to 2.65% from 2.40%, potentially boosting the euro and influencing risk sentiment. The US Producer Price Index forecast is 5.3% year-over-year and 0.4% month-over-month; a stronger than expected reading would support the USD, likely exerting further downward pressure on USDCAD. Traders should monitor release timings closely given timezone differences (GMT+1 vs HKT) to anticipate market moves.
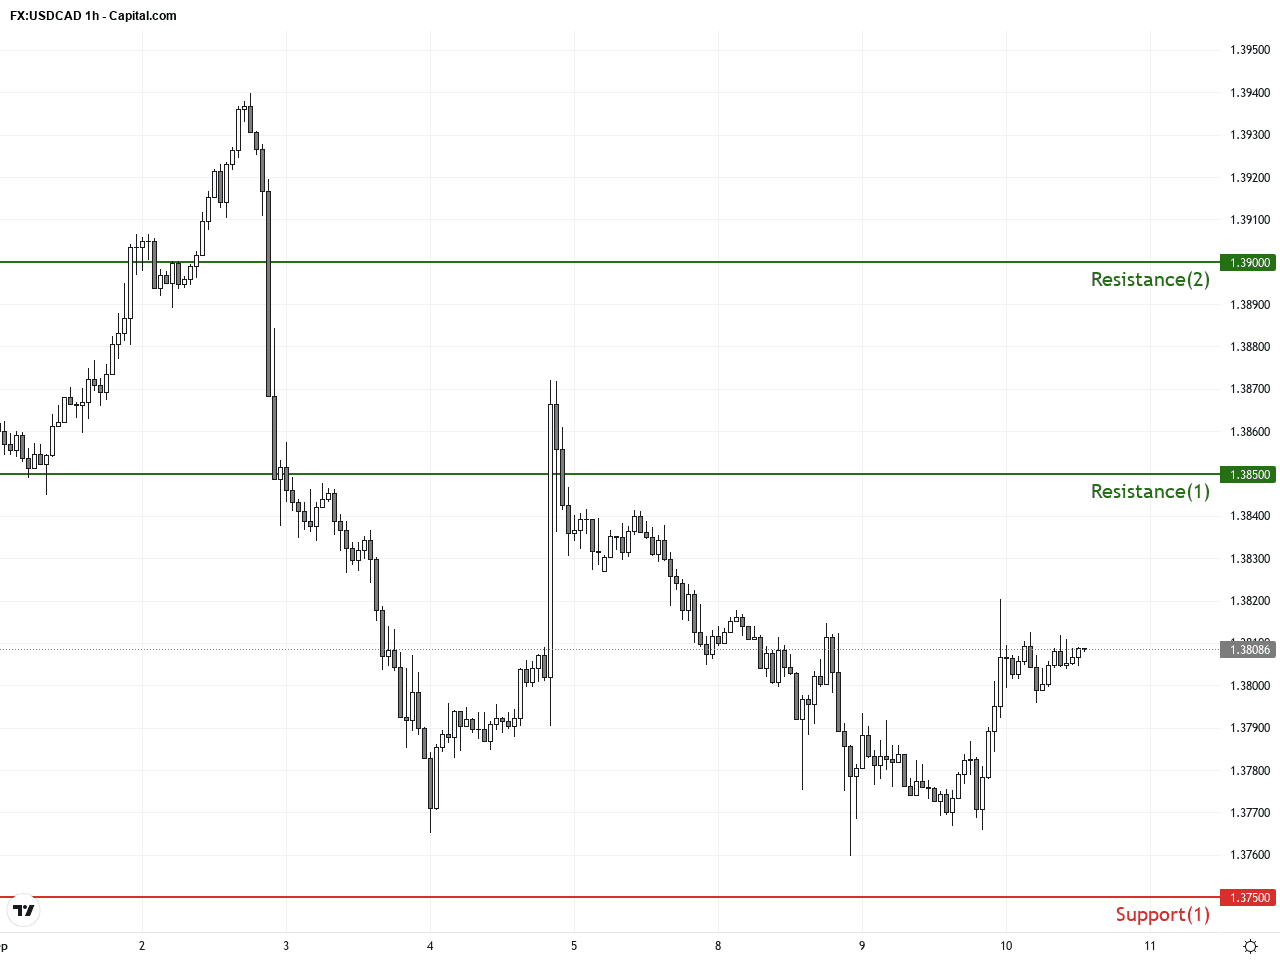
Resistance & Support
The above financial market data, quotes, charts, statistics, exchange rates, news, research, analysis, buy or sell ratings, financial education, and other information are for reference only. Before making any trades based on this information, you should consult independent professional advice to verify pricing data or obtain more detailed market information. 1uptick.com should not be regarded as soliciting any subscriber or visitor to execute any trade. You are solely responsible for all of your own trading decisions.