


 |
| Gold V.1.3.1 signal Telegram Channel (English) |

AUDUSD Technical & Fundamental Analysis: Key Support Holds Amid Geopolitical Drag
2026-03-13 @ 06:01
Over the past 24 to 48 hours, the AUD/USD currency pair has experienced significant volatility. From yesterday’s closing price of 0.71509, it dropped sharply to around 0.7095, marking a decline of approximately 0.83%, reflecting heightened risk aversion and a resurgence in the strength of the US dollar.
According to the latest market news, geopolitical risks have surged due to escalating tensions in the Middle East, driving investors towards the US dollar as a safe haven. This has directly depressed the AUD/USD rate, causing a break from its multi-week upward momentum. Meanwhile, the Reserve Bank of Australia’s sustained hawkish rate hike stance has offered some support for the Aussie, but the global uncertainty has tilted preference towards the dollar.
In simpler terms for everyday investors, although Australia’s economic outlook remains supported by expectations of interest rate hikes, the recent spike in geopolitical tension has increased market uncertainty, boosting the US dollar against the AUD in the short term. This underscores how swiftly global political turmoil can impact currency markets, forcing investors to balance between chasing returns and seeking safety.
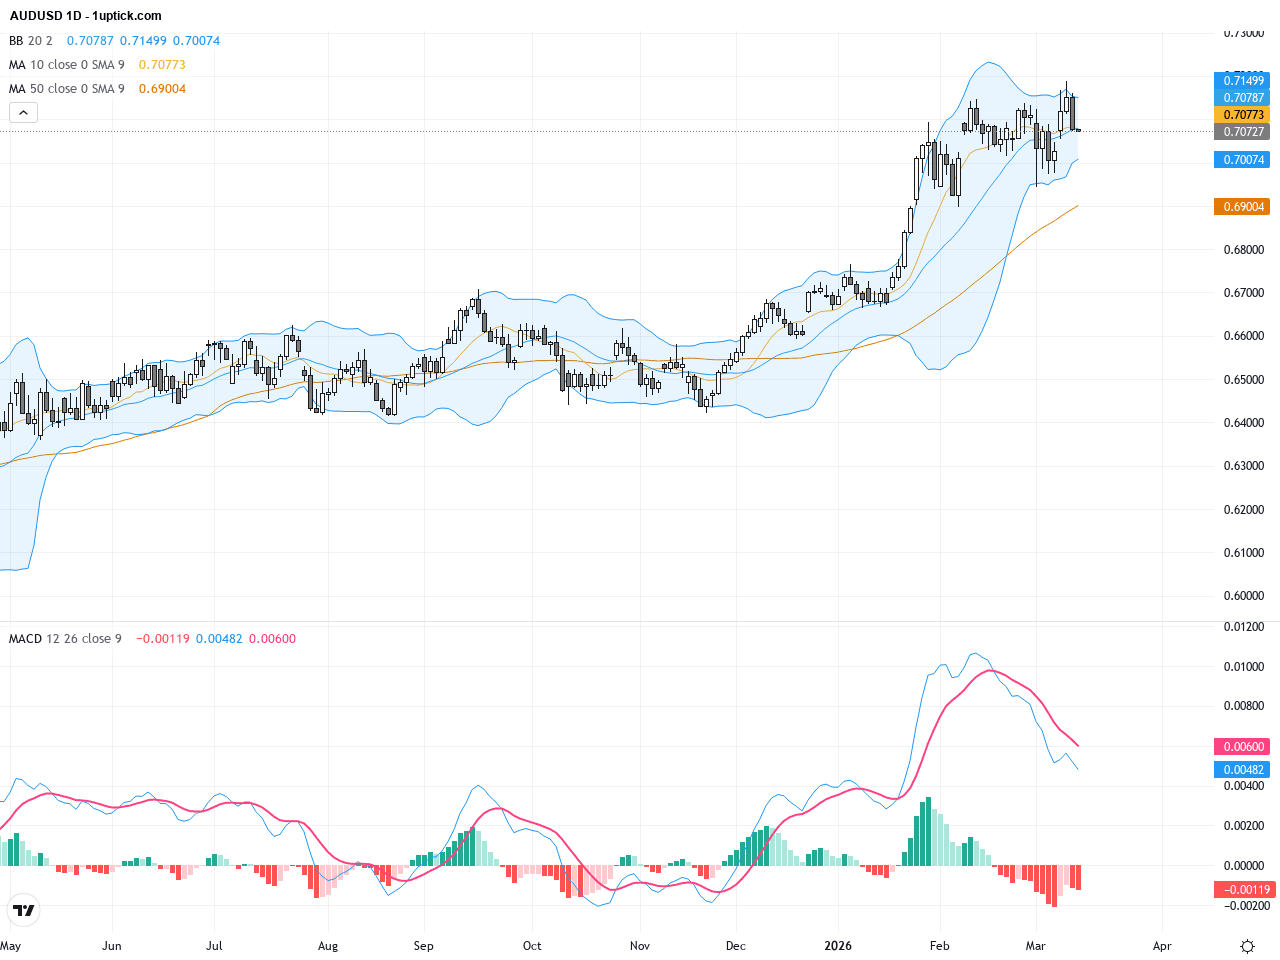
The daily chart for AUDUSD reveals a persistent bullish trend since the start of the year, with price consistently trading above both the 50-day and 200-day moving averages, signalling strong medium to long-term bullish momentum. However, the pair recently faced resistance near 0.7187, marking a short-term reversal point. Bollinger Bands are contracting, indicating tightening volatility and potential for a breakout. The MACD remains in positive territory but shows signs of convergence, suggesting momentum may be waning soon. Overall, while the longer-term uptrend remains intact, traders should watch for short-term correction risks.
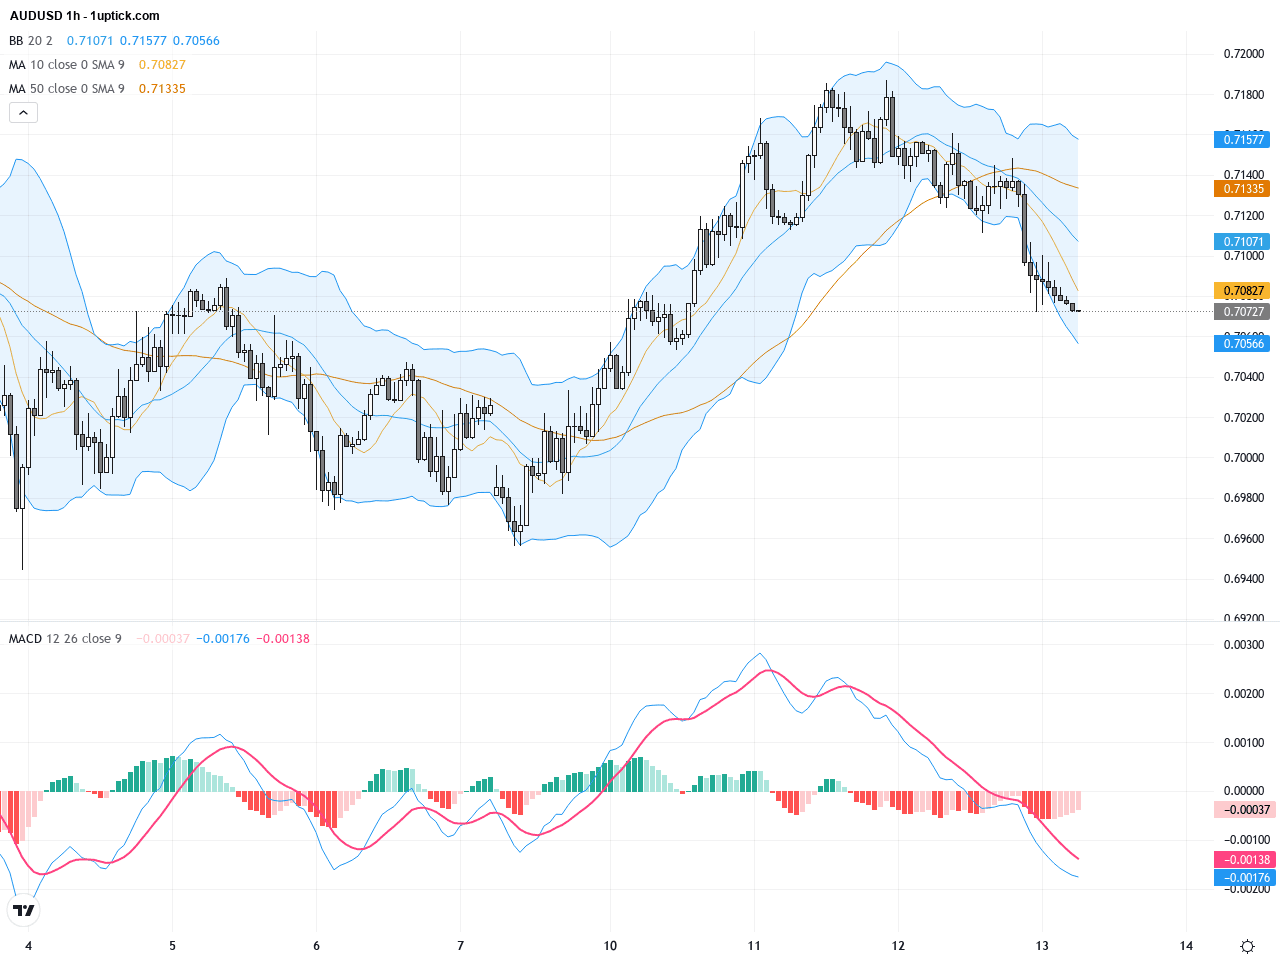
On the hourly timeframe covering the last 3-5 days, AUDUSD is consolidating within a range of approximately 0.7070 to 0.7150. The short-term 20-period moving average and the 50-period moving average are intertwined around the current price, reflecting indecision. The pair is near the middle of the Bollinger Bands, pointing to lack of clear directional bias. A recent MACD bearish crossover signals increasing near-term selling pressure. A hammer candlestick formed at support near 0.7070 hints at potential stabilization. Traders should be cautious for either a breakout above 0.7110 or break below key supports to determine next moves.
Technical Trend: Cautiously consolidating amid mixed signals
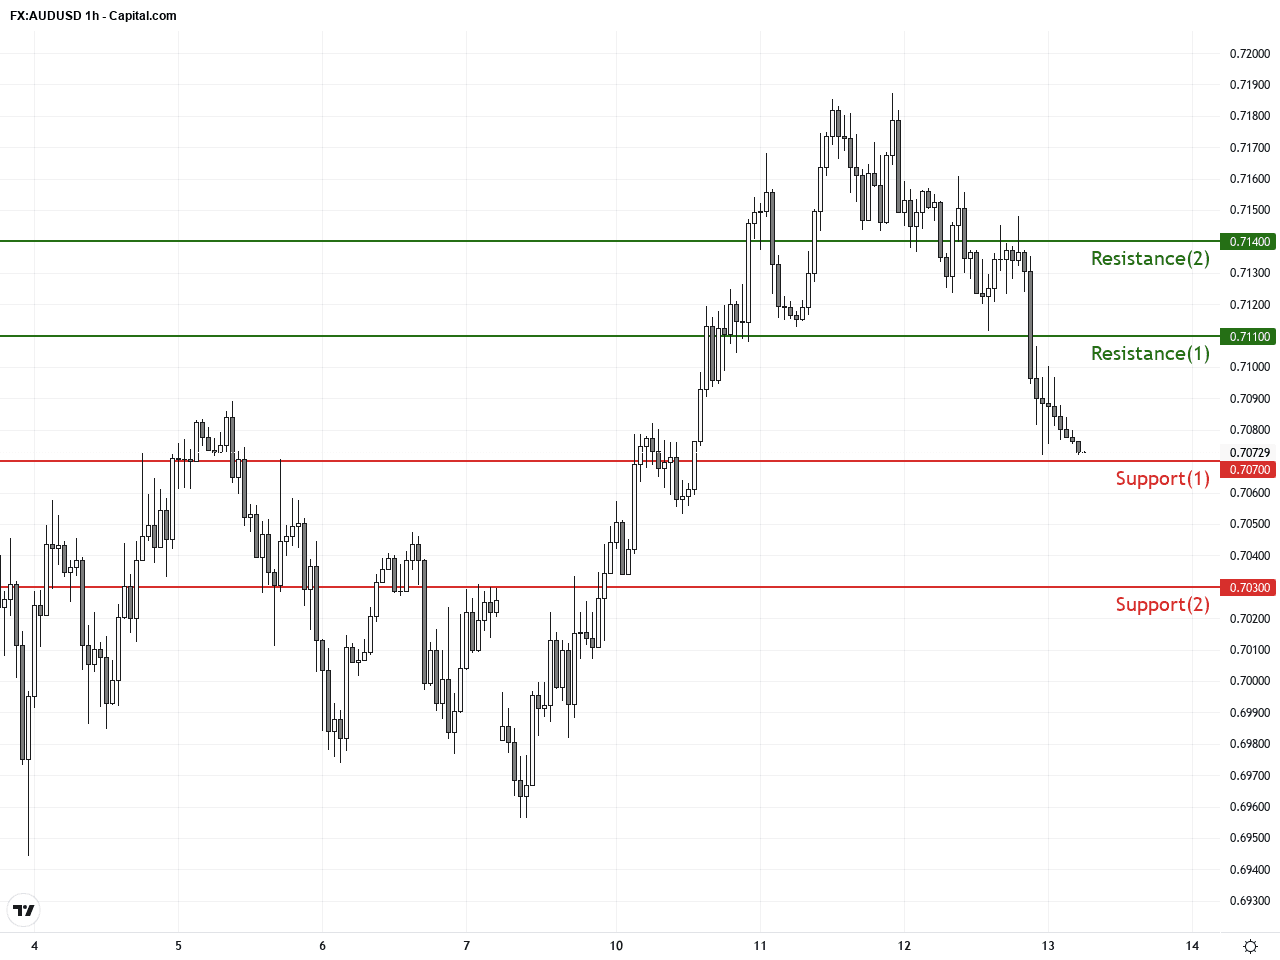
Key technical insights highlight a recent MACD bearish crossover on the short-term charts along with Bollinger Band contractions, foreshadowing a possible near-term pullback or range-bound movement. The 50-day and 200-day moving averages on the daily chart provide strong support underpinning the broader uptrend. A hammer candlestick near 0.7070 suggests buyers are stepping in at critical levels. A breakout above 0.7110 would open the door to resume the bullish advance. Traders should remain alert to geopolitical risk-driven volatility which can cause sudden shifts.Today’s economic calendar features no major releases directly impacting AUDUSD. Key events include U.S. Building Permits and Jobless Claims, alongside Bank of England and Federal Reserve speeches, but none are expected to cause significant immediate moves in AUDUSD. Market participants should continue to focus on geopolitical developments and central bank policy signals for directional cues.
Resistance & Support
The above financial market data, quotes, charts, statistics, exchange rates, news, research, analysis, buy or sell ratings, financial education, and other information are for reference only. Before making any trades based on this information, you should consult independent professional advice to verify pricing data or obtain more detailed market information. 1uptick.com should not be regarded as soliciting any subscriber or visitor to execute any trade. You are solely responsible for all of your own trading decisions.