


 |
| Gold V.1.3.1 signal Telegram Channel (English) |

WTI Crude Oil: Geopolitical Risks Drive Oil Price Surge Amid Technical Consolidation
2026-03-20 @ 00:29
Over the past 24 to 48 hours, WTI crude oil prices have experienced significant volatility, closing at $98.22 per barrel on March 19, 2026, marking a notable rebound after recent declines. The price swings have been driven primarily by escalating geopolitical tensions in the Middle East, especially following Iran’s attacks on multiple energy facilities in the region. These developments have sharply heightened concerns about supply disruptions, pushing Brent crude prices briefly above $119 per barrel.
This geopolitical turmoil has weighed heavily on global stock markets, reflecting investors’ worries about sustained energy market strain potentially fueling inflation. For the average investor, this translates to ongoing increases in energy and related commodity prices, driving up costs across consumer goods and daily expenses. Additionally, rising oil prices are likely to trigger expectations of interest rate adjustments, causing ripple effects in stock sectors such as retail and consumer discretionary.
Overall, the WTI crude market has shown extreme sensitivity and volatility in the last day or two. Investors should closely watch evolving Middle East developments to gauge oil price trajectories and their broader economic implications.
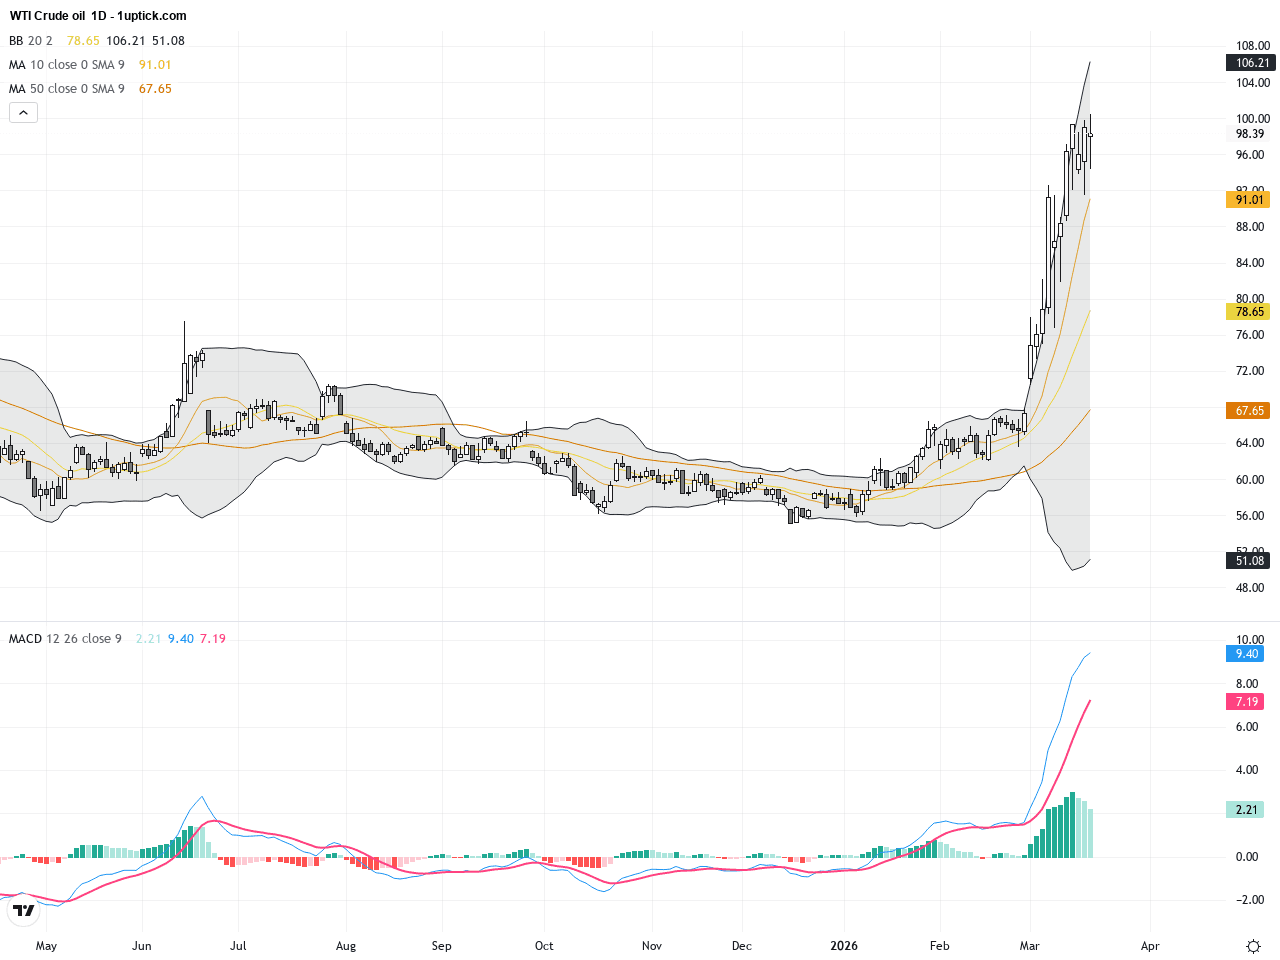
The daily chart for WTI shows significant volatility since mid-March, with prices rebounding from around $93 to near $98 on heavy volume. Recent price action displays a strong oscillation range, with prices holding above the 20-day moving average, indicating sustained short-term bullish momentum. Bollinger Bands show price approaching the upper band without a decisive breakout, suggesting resistance and possible consolidation. The MACD remains bullish but the signal lines are converging, signaling potential momentum slowdown. Overall, the trend leans bullish with caution towards resistance zones.

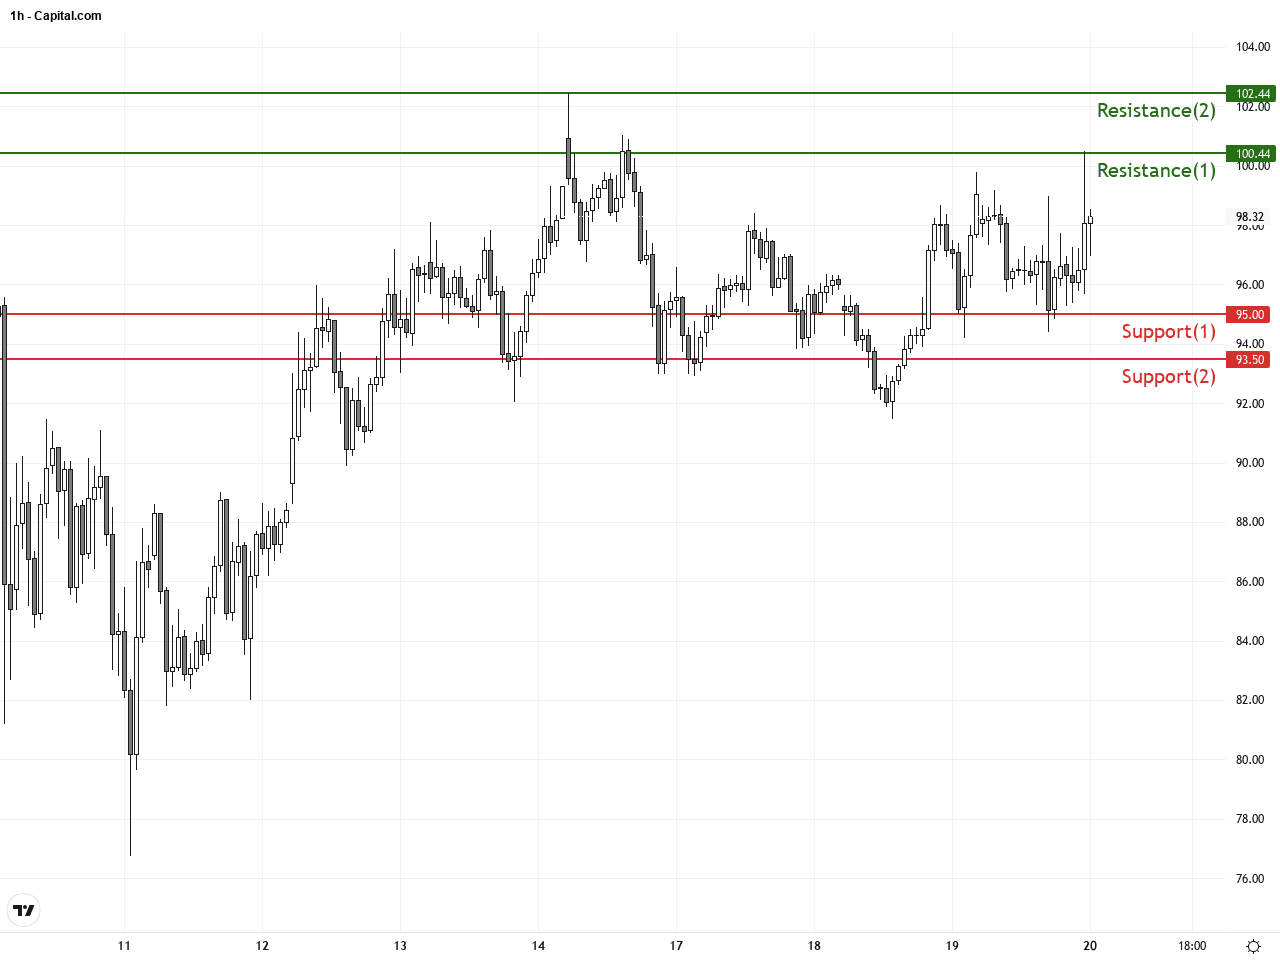
The hourly chart of WTI reveals price oscillation between $95 and $100 over the past 3-5 days. Short-term moving averages are intertwined, reflecting a balance between bulls and bears. The MACD indicates a mild bearish crossover, hinting at potential short-term retracement. Bollinger Bands contract slightly, suggesting a narrow consolidation phase. A bearish engulfing candlestick pattern recently formed, implying that bulls might yield to bears in the coming 24 hours, increasing near-term volatility.
Technical Trend: Current Trend: Cautiously Bullish Consolidation
Technically, WTI has formed a consolidation pattern with daily MACD nearing a pivotal point, indicating momentum is easing. The bearish engulfing on the hourly chart suggests short-term correction risk. Holding above the $95 support level is crucial to maintain a cautiously bullish stance. A breakout above the $100 resistance could trigger a new bullish wave.There are no significant or direct economic events on today’s calendar that will impact WTI Crude oil. Market attention remains focused on geopolitical developments affecting oil supply.
Resistance & Support
The above financial market data, quotes, charts, statistics, exchange rates, news, research, analysis, buy or sell ratings, financial education, and other information are for reference only. Before making any trades based on this information, you should consult independent professional advice to verify pricing data or obtain more detailed market information. 1uptick.com should not be regarded as soliciting any subscriber or visitor to execute any trade. You are solely responsible for all of your own trading decisions.