Category: Technical Analysis

Gold Prices Swing as Weakening Dollar Supports Bullish Momentum – Thursday Market Outlook

Spot gold has seen sharp swings over the past 24 hours, briefly reaching a record high as weak U.S. economic data and rising geopolitical tensions boosted safe-haven demand. Technical indicators suggest that bullish momentum remains intact, with $3,340 emerging as a key support level. As investors turn their focus to U.S. jobless claims and the Federal Reserve’s next move, gold’s short-term price action is drawing heightened attention. Stay ahead of the market with the latest gold price analysis and identify timely investment opportunities.

British Pound Surges Against US Dollar, Hits New High – Market Insights

The British pound continues its upward momentum against the US dollar, driven by diverging monetary policies between the UK and the US, as well as ongoing dollar weakness. This has pushed GBP/USD to a nearly six-month high. From a technical perspective, the pair remains in a bullish trend, with short-term potential to test the 1.3300 level. As markets turn their attention to upcoming US retail sales data and UK unemployment figures, the outlook for GBP/USD warrants close monitoring. Forex traders may consider buying on dips while maintaining strict risk management to capitalize on potential gains in the pound’s strength.

Nasdaq toward 18330 ?

Price Movement The chart provided showcases a recent decline in the Nasdaq index, following a significant uptrend observed in the latter half of the previous year. Initially, the index displayed bullish momentum, characterized by higher highs and higher lows, indicating strong buying interest. However, a recent downturn began in the first quarter of 2025, with […]

DOW on its way down !

Price Movement The Dow’s daily candlestick chart demonstrates a significant downward trajectory, breaking below previously established support levels. The price movement in recent months has transitioned from a period of consolidation to a notable bearish decline. Initially, the Dow was trading within an upward channel, constrained by slightly inclining trendlines. This period reflected a gradual […]

DOW 30 on its way to 42000!

Price Movement The daily chart of the S&P depicts a fluctuating trend with periods of both bullish and bearish sentiment. Initially, there is a significant uptrend, indicated by a series of higher highs and higher lows, sustaining above the green upward channel. As the chart progresses, the price encounters resistance around the 45,180 level, subsequently […]

EUR ready to breakout 1.05?

Price Movement The EUR/USD daily chart shows prolonged bearish movement followed by a consolidation period. Initially, the pair experienced a significant downward trend as indicated by consecutive lower lows and lower highs. A reversal was attempted, but resistance around the 1.0500-1.0530 range halted further upward movement. Throughout the period under consideration, the price oscillated within […]

USD maintain in a downtrend channel!

Price Movement The USD Index daily chart shows a recent period of volatility with notable price shifts. Initially, the index experienced an upward trend, reaching a peak near 110.170. This rise was followed by a pullback, as sellers gained control, leading to increased bearish sentiment. The chart indicates a series of lower highs and lower […]

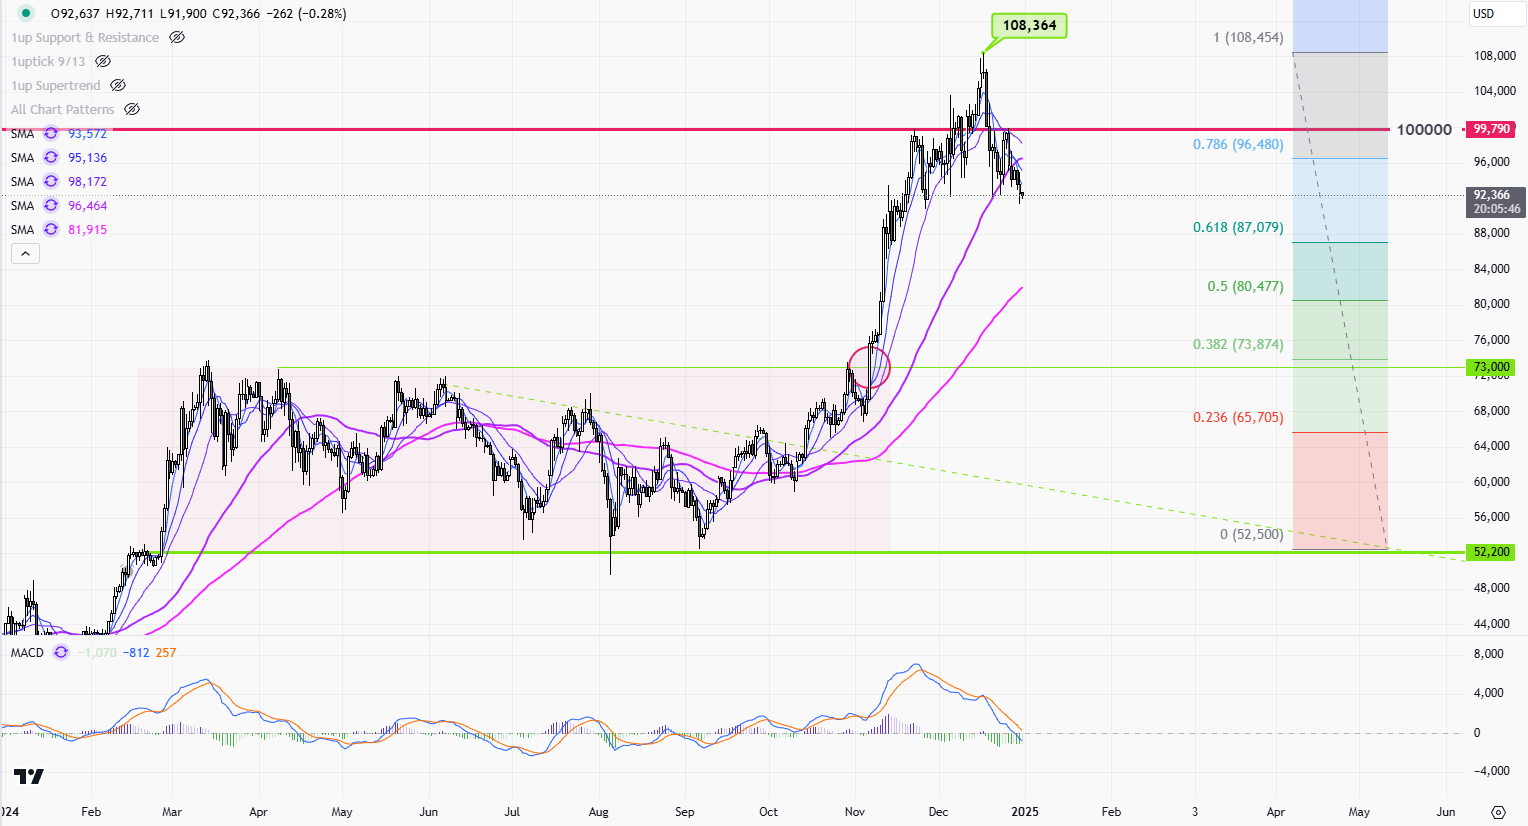
Bitcoin on a downtrend?

Price Movement The daily candlestick chart for the Bitcoin shows a significant upward movement that peaked at around 108,364, followed by a correction phase. Initially, the price rallied from a consolidation phase into a substantial uptrend, reflecting strong bullish momentum. The uptrend, characterized by higher highs and higher lows, eventually reversed after hitting resistance around […]

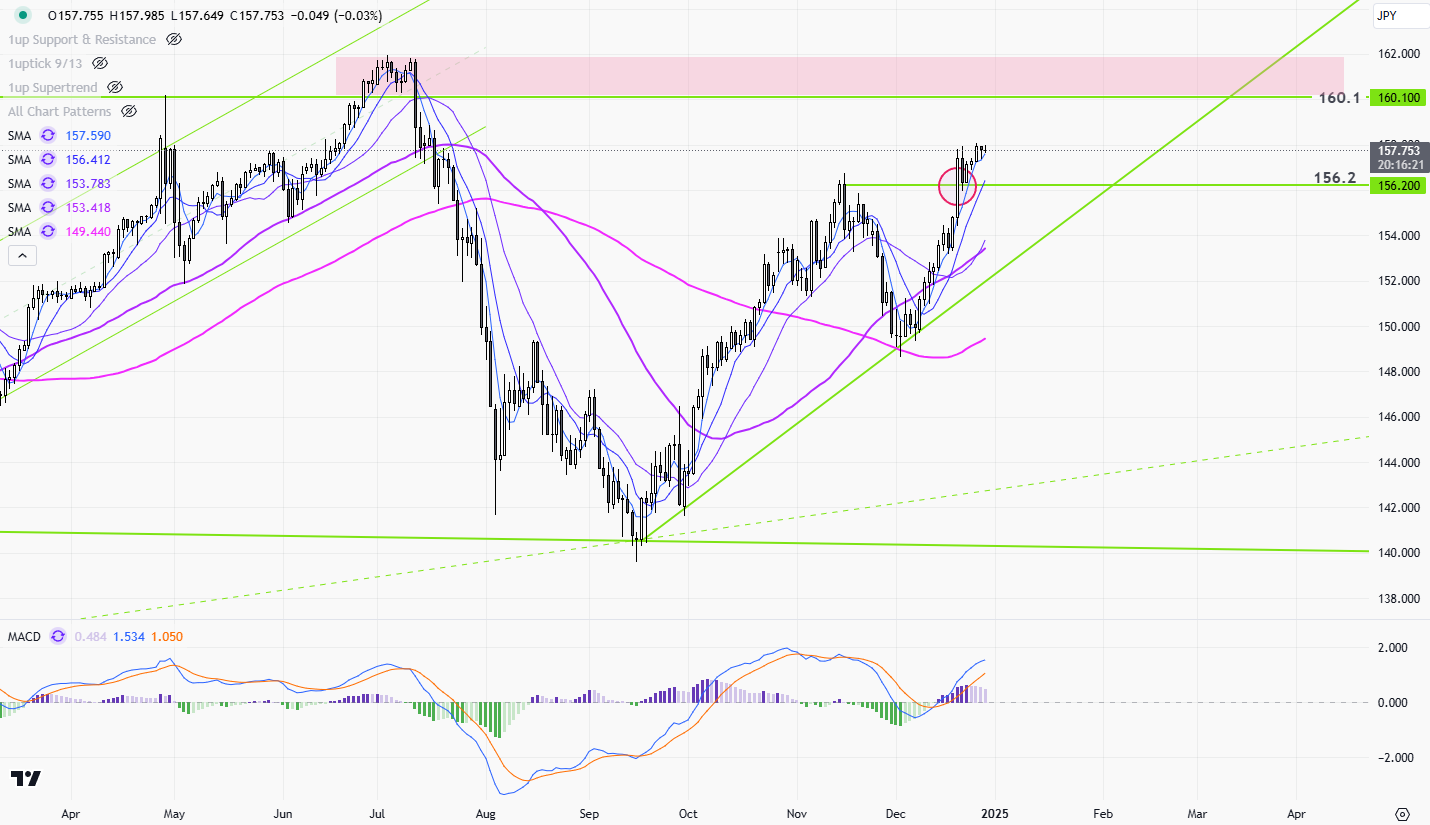
USDJPY uptrend remains?

Price Movement The USD/JPY daily chart displays a strong upward trend, with the price moving consistently higher since early October. After hitting a low around 140 in late August, the pair embarked on a bullish trajectory, breaking multiple resistance levels. Recently, the pair has consolidated just below a significant resistance at 160, indicating a pause […]

1uptick Analytics @

Maximize your profit at ease

Risk Warning​

*Investment involves risk. You may use the information, strategies and trading signals on this website for academic and reference purposes at your own discretion. 1uptick cannot and does not guarantee that any current or future buy or sell comments and messages posted on this website/app will be profitable. Past performance is not necessarily indicative of future performance. It is impossible for 1uptick to make such guarantees and users should not make such assumptions. Readers should seek independent professional advice before executing a transaction. 1uptick will not solicit any subscribers or visitors to execute any transactions, and you are responsible for all executed transactions.

© 2022-25 – 1uptick Analytics all rights reserved.


Risk Warning​

*Investment involves risk. You may use the information, strategies and trading signals on this website for academic and reference purposes at your own discretion. 1uptick cannot and does not guarantee that any current or future buy or sell comments and messages posted on this website/app will be profitable. Past performance is not necessarily indicative of future performance. It is impossible for 1uptick to make such guarantees and users should not make such assumptions. Readers should seek independent professional advice before executing a transaction. 1uptick will not solicit any subscribers or visitors to execute any transactions, and you are responsible for all executed transactions.

© 1uptick Analytics all rights reserved.

Home
Analysis
Calendar
Tools
Signals