XAUUSD Technical Analysis

Home  Technical Analysis  XAUUSD Technical Analysis
XAUUSD
XAUUSD Technical & Fundamental Analysis: Gold Faces Critical $4800 Resistance Amid Volatility
10Apr

XAUUSD Technical & Fundamental Analysis: Gold Faces Critical $4800 Resistance Amid Volatility

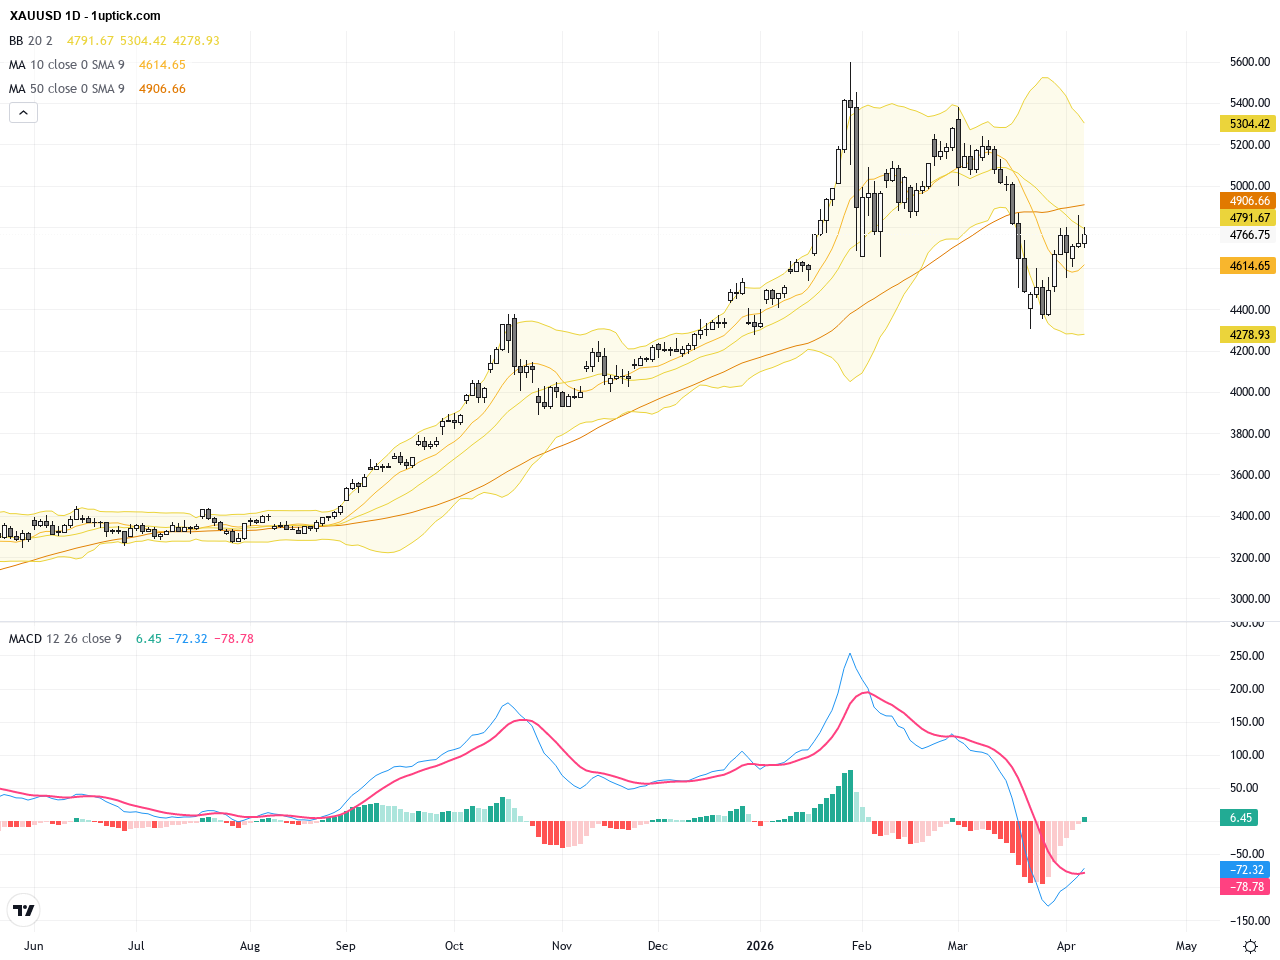
Over the past three trading days, XAUUSD has shown notable volatility, recovering from lows near $4700 to close yesterday at $4765.46. Market sentiment was influenced by anticipated selling pressure from a Bloomberg Commodity Index reweighting. However, a ceasefire in the Middle East eased crude oil prices and inflation concerns, supporting gold’s rise as it attempts to hold above the $4800 level. For average investors, this highlights a tug-of-war between short-term correction risks and steady safe-haven demand, suggesting cautious positioning is advisable.

XAUUSD: Gold Tests Critical Resistance Amid Mixed Technical Signals and Market News
09Apr

XAUUSD: Gold Tests Critical Resistance Amid Mixed Technical Signals and Market News

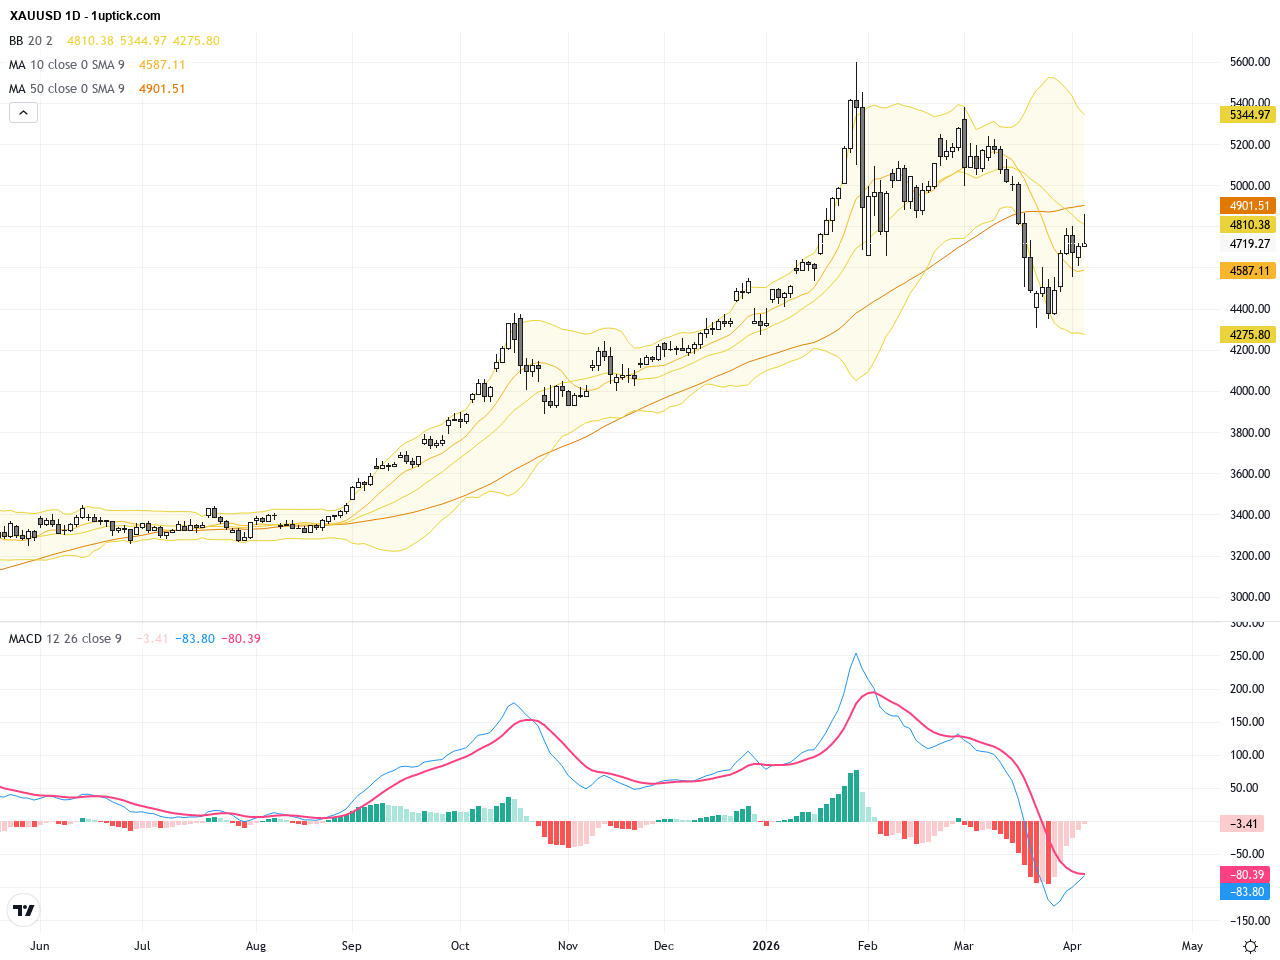
Over the past three trading days, XAUUSD experienced volatile moves, closing at 4719.77 on April 8 after reaching a near-term high above 4850. The market mood this week was largely driven by the US-Iran ceasefire news that boosted risk sentiment and lifted gold prices temporarily. However, subsequent hawkish rhetoric from the US pressured bullion lower. Gold remains supported by strong macroeconomic fundamentals amid shifting risk appetites globally. Today’s economic calendar lacks direct events impacting gold, but key data such as US crude oil inventories and European inflation statistics may indirectly influence price action. This report provides an in-depth technical and fundamental overview, offering traders actionable insights and essential price levels for navigating the gold market.

XAUUSD Technical Breakout Amid Middle East Tensions: Gold Trading Outlook Explained
07Apr

XAUUSD Technical Breakout Amid Middle East Tensions: Gold Trading Outlook Explained

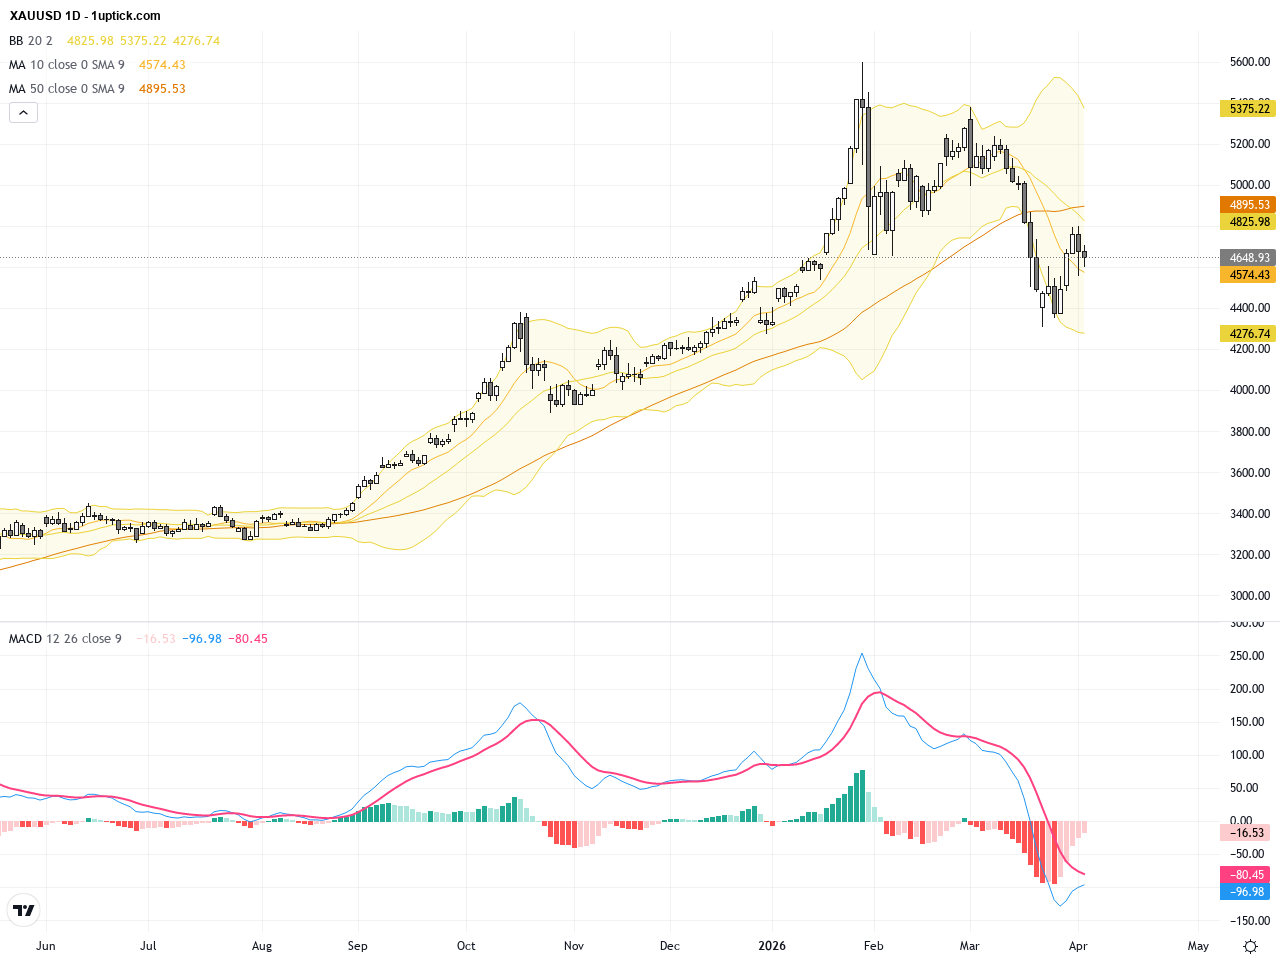
XAUUSD (Gold priced in USD) has shown heightened volatility over the past three trading sessions, sliding from a high near 4800 to around 4650. This move reflects investor uncertainty driven by escalating Middle East tensions and rising oil prices that fuel inflation fears. Yesterday’s close at 4650.16 was pressured by US political rhetoric, highlighting geopolitical risk’s role in driving gold’s safe-haven demand. For everyday investors, this price movement feels like navigating a volatile tightrope, with greater caution needed for short-term trading decisions. Both fundamental and technical factors interplay, placing XAUUSD at a critical turning point.

XAUUSD Gold Analysis: Key Support Holds and Bullish Signals Emerge
03Apr

XAUUSD Gold Analysis: Key Support Holds and Bullish Signals Emerge

Over the past three trading days, XAUUSD has shown notable volatility, with prices oscillating around the mid-4600s to a high near 4800. Market news highlights gold’s stability around 4733, with a crucial breakout above 4725 signaling a bullish confirmation. Geopolitical tensions in the Middle East and U.S. policy uncertainty have continued to impact gold prices, emphasizing gold’s traditional role as a safe haven. For the average investor, this means that despite fluctuations, gold remains a favored asset for risk mitigation. Traders should pay close attention to support and resistance levels alongside technical patterns to capitalize on upcoming price movements.

XAUUSD Technical & Fundamental Report: Gold Stabilizes Near $4733, Bullish Signal Emerges
02Apr

XAUUSD Technical & Fundamental Report: Gold Stabilizes Near $4733, Bullish Signal Emerges

Over the past three trading days, XAUUSD has experienced significant volatility, closing at 4661.84 yesterday, down from the previous day’s 4758.2 high. This reflects market sensitivity to geopolitical tensions and Federal Reserve policy shifts. Recent news highlights gold’s steadying around $4733, with a sustained move above $4725 signaling clear bullish momentum. However, gold prices faced pressure from escalating US-Iran tensions, contributing to short-term fluctuations. For average investors, despite volatility, gold continues to demonstrate strong resilience and liquidity, making it a reliable safe haven amid global uncertainty.

1 8 9 10 11 12 18
XAUUSD: Gold Breaks Below 100-Day MA Amid Sharp Selloff and Technical Breakdown
20Mar

XAUUSD: Gold Breaks Below 100-Day MA Amid Sharp Selloff and Technical Breakdown

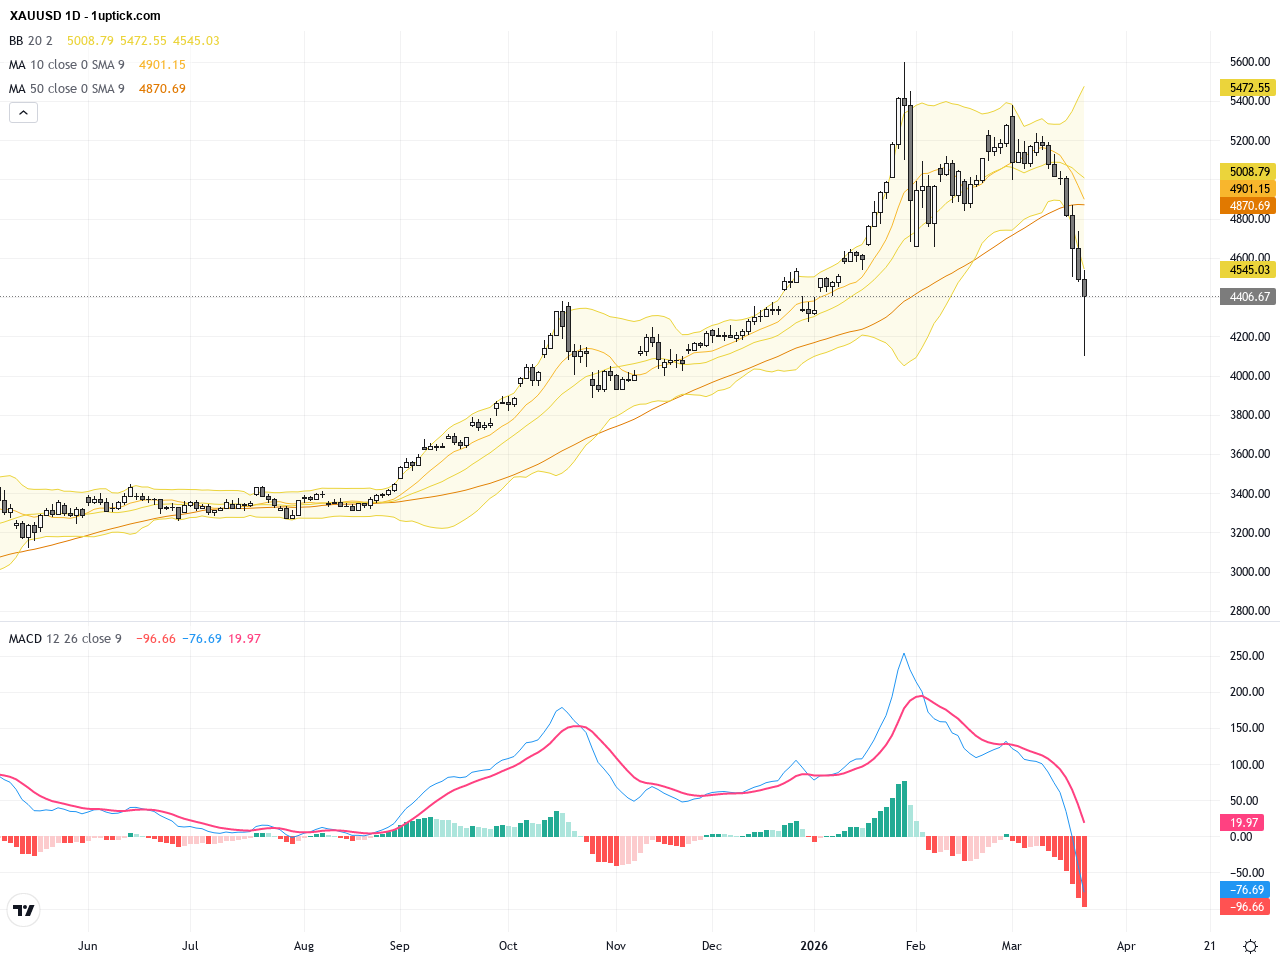
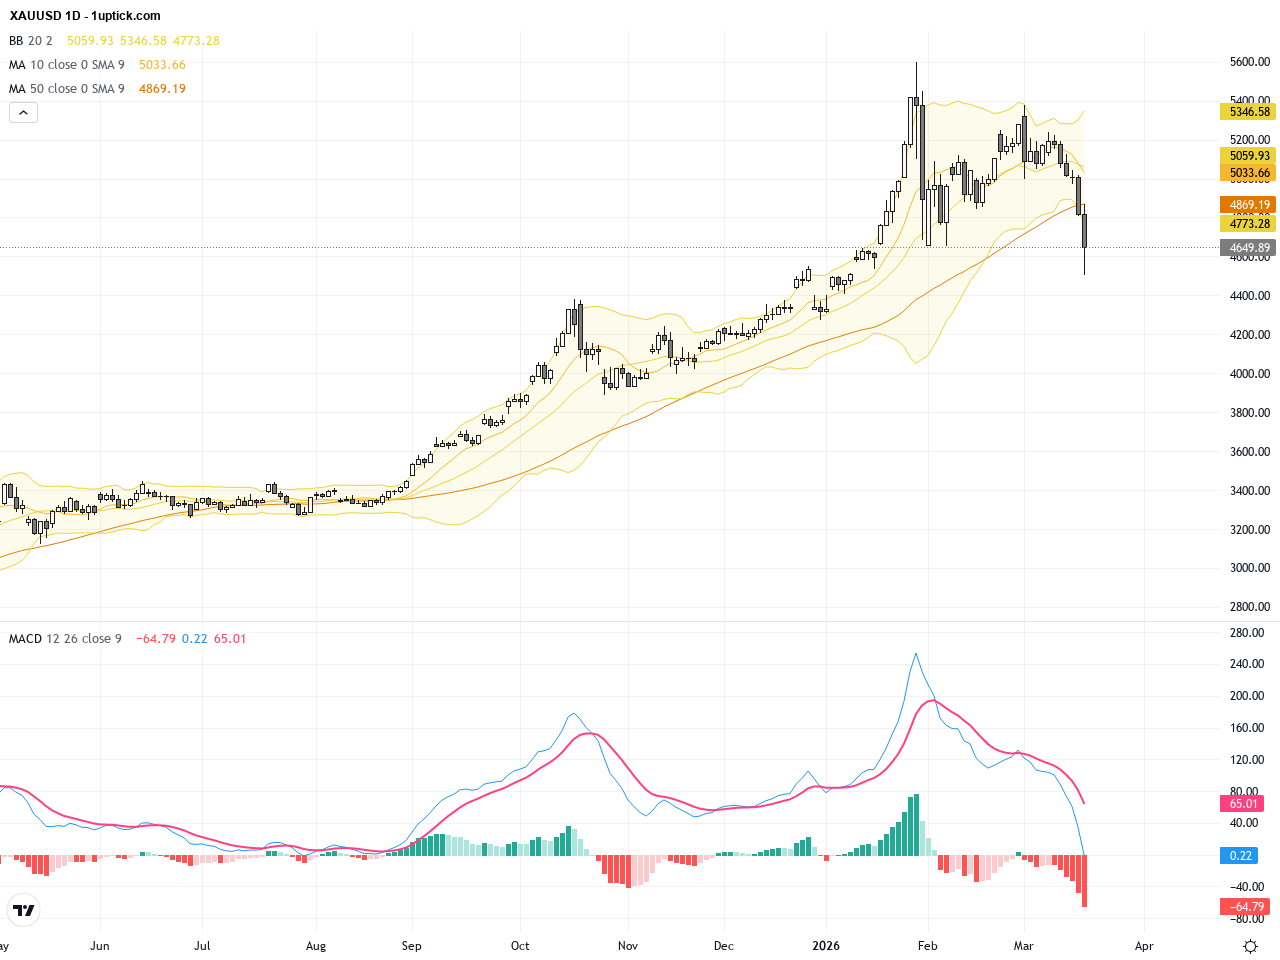
Over the past three trading days, XAUUSD experienced dramatic volatility, plunging from $5,005.73 on March 17 to $4,655.73 on March 19, marking a drop of over 7%. Yesterday’s close hit a new low in this correction wave. The selloff was driven by fading safe-haven demand and a critical breakdown below the $4,960 support level, triggering a bearish medium-term outlook. Market news highlights a 5% decline pushing gold beneath its 100-day moving average, intensifying downward momentum. Rising US Treasury yields and hawkish Fed comments have further pressured gold. For the average investor, this reflects diminishing risk aversion and a rotation toward higher-yielding assets. Keeping an eye on Fed signals and geopolitical developments remains crucial for gold’s near-term price trajectory.

XAUUSD: Breaking the $4,960 Support Triggers Medium-Term Downtrend with Key Technical and Fundamental Insights
20Mar

XAUUSD: Breaking the $4,960 Support Triggers Medium-Term Downtrend with Key Technical and Fundamental Insights

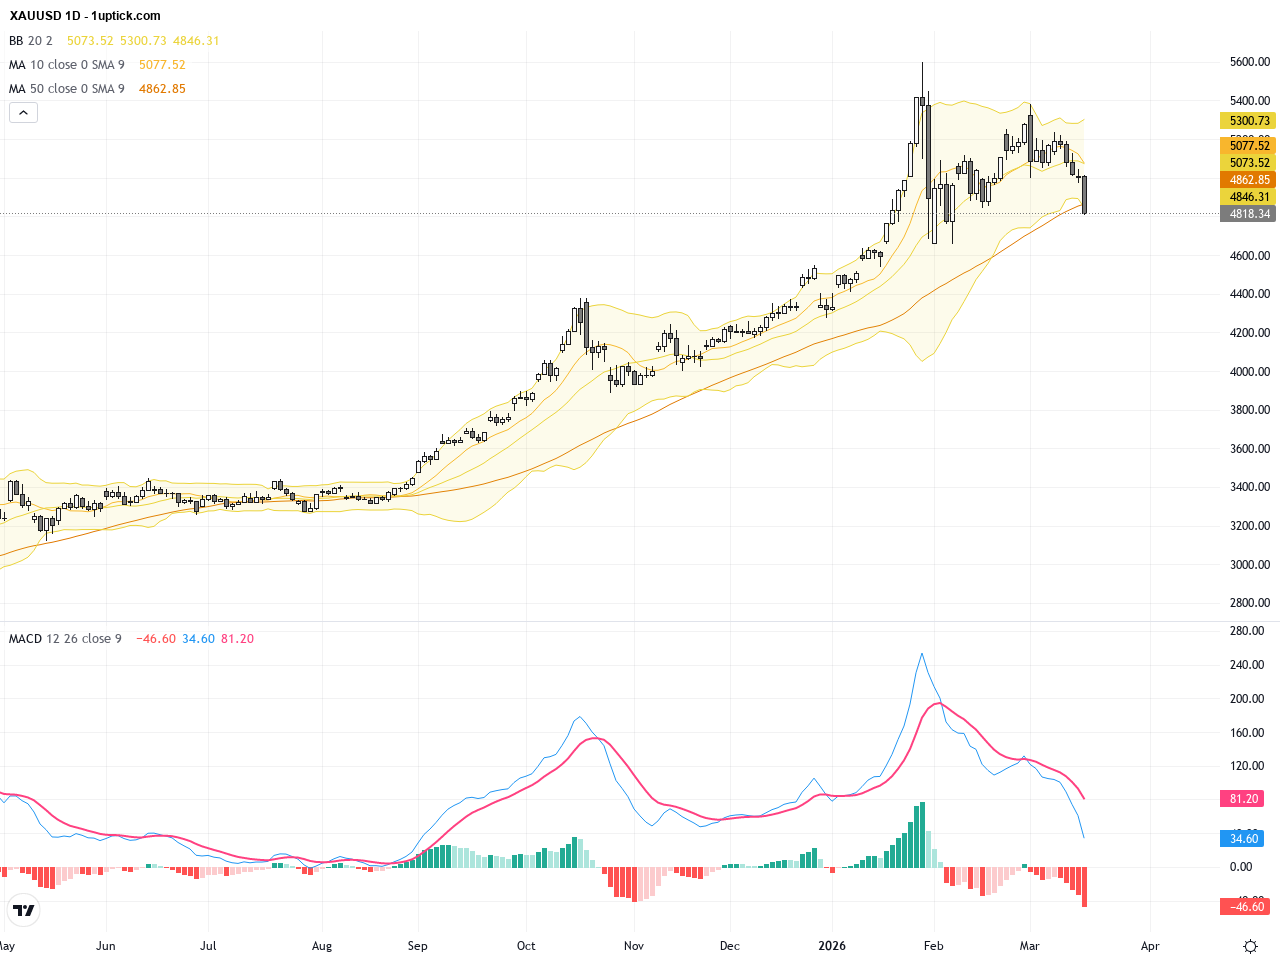
Over the past three trading days, XAUUSD gold prices experienced significant volatility, notably closing sharply lower at 4617.54 USD yesterday compared to 4818.42 USD the previous day, a nearly 4% drop. This steep decline was driven by breaking the crucial $4,960 support level, initiating a medium-term bearish trend as outlined in recent market news. Fed Chair Powell’s remarks and impending economic data releases have increased cautious sentiment. For the average investor, this means gold’s safe-haven appeal is under pressure temporarily, but volatility may present strategic trading opportunities.

XAUUSD: Gold Price Plunges Below Key Support as Market Awaits Fed Guidance
19Mar

XAUUSD: Gold Price Plunges Below Key Support as Market Awaits Fed Guidance

Over the past three trading days, XAUUSD (gold price) has experienced sharp volatility, plunging from around $5,006 on March 16 to close near $4,825 yesterday, marking a drop of over 3%. This downtrend is mainly driven by rising oil prices testing new highs amid geopolitical tensions and a cautious market awaiting the Federal Reserve’s upcoming rate decision. For investors, gold falling below the crucial $5,000 mark signals a cooling of safe-haven demand and increased uncertainty over future monetary policy. This combination calls for cautious positioning ahead of major economic events that will likely set the tone for gold’s near-term price trajectory.

XAUUSD Gold Analysis: Key Technical Breakdown Below $5000 Support Sparks Pullback
17Mar

XAUUSD Gold Analysis: Key Technical Breakdown Below $5000 Support Sparks Pullback

Over the past three trading days, XAUUSD gold has demonstrated notable volatility, falling from around the $5020 high on March 13th to close near $5009 yesterday. Recent market news highlights a breakdown below the crucial $5000 triangle support, signaling a buildup of bearish momentum amid rising inflation fears and a stronger US dollar. Geopolitical tensions in the Middle East and continuous central bank gold purchases have added complexity, prompting short-term pullbacks. For everyday investors, this suggests while gold remains an attractive long-term asset, caution is warranted in the near term to avoid chasing the market during potential retracements.

XAUUSD Gold Price Outlook: Dollar Strength and Rate Cut Delays Cap Rally
13Mar

XAUUSD Gold Price Outlook: Dollar Strength and Rate Cut Delays Cap Rally

Over the past three trading days, XAUUSD gold prices witnessed significant volatility, falling from around 5192 on March 10th to close near 5081 on March 12th, reflecting the strong US dollar and rising Treasury yields weighing heavily on the metal. Market expectations for a delayed Fed rate cut further capped the upside momentum. The latest market news highlights that gold remains trapped near a critical pivot point, challenged by the dollar’s strength and rising oil prices. For everyday investors, this means gold is likely to remain range-bound in the short term, with safe-haven demand offering support but bearish forces still dominant. Our comprehensive technical and fundamental analysis provides clear insights into the XAUUSD trading outlook and key price levels to navigate the current market environment.

XAUUSD Gold Breaks Key 5207.97 Resistance: Technical and Fundamental Trading Outlook
12Mar

XAUUSD Gold Breaks Key 5207.97 Resistance: Technical and Fundamental Trading Outlook

Over the past three trading sessions, XAUUSD has shown notable volatility, rising from a low near 5137.91 on March 9 to close around 5176.58 on March 11, with the critical resistance at 5207.97 drawing market attention. Recent market news highlights that oil nearing $100 and uncertainty around Fed rate cuts keep gold price rangebound. Despite USD strength and geopolitical pressures, gold benefits from expectations of potential rate cuts, maintaining a trading range between key support and resistance. For the average investor, this underscores gold’s continued appeal as a safe haven amid inflation and global risk concerns.

1 8 9 10 11 12 15

1uptick Analytics @

Risk Warning​

*Investment involves risk. You may use the information, strategies and trading signals on this website for academic and reference purposes at your own discretion. 1uptick cannot and does not guarantee that any current or future buy or sell comments and messages posted on this website/app will be profitable. Past performance is not necessarily indicative of future performance. It is impossible for 1uptick to make such guarantees and users should not make such assumptions. Readers should seek independent professional advice before executing a transaction. 1uptick will not solicit any subscribers or visitors to execute any transactions, and you are responsible for all executed transactions.

© 2022-26 1uptick Analytics all rights reserved.


Risk Warning​

*Investment involves risk. You may use the information, strategies and trading signals on this website for academic and reference purposes at your own discretion. 1uptick cannot and does not guarantee that any current or future buy or sell comments and messages posted on this website/app will be profitable. Past performance is not necessarily indicative of future performance. It is impossible for 1uptick to make such guarantees and users should not make such assumptions. Readers should seek independent professional advice before executing a transaction. 1uptick will not solicit any subscribers or visitors to execute any transactions, and you are responsible for all executed transactions.

© 1uptick Analytics all rights reserved.

Home
.AI
Analysis
Calendar
Tools