

 |
| Gold V.1.3.1 signal Telegram Channel (English) |
Gold Trend 26/08
Gold price carried forward the upward momentum from the breaking of 2480 in the previous week, hitting a fresh record high of 2531 early last week. But the buying has reversed after the Fed. Meeting minutes were released during the US session on Wednesday. The price fell to the lowest of the week at 2470, and the week ended at 2510. There was no important US economic data last week, and Powell’s speech scheduled on Friday has controlled the market’s overall movement during the week. Although the final remarks were dovish, the market had already priced in the 0.25% rate cut in September, and in the absence of any new progress failed to stimulate the gold price to rise higher. In the next two weeks until the Fed meeting in mid-September, unless those economic figures during this period can drive the market to speculate on the half-percent interest rate cut in September, the rate-cutting factor will no longer be able to push up the gold price significantly in the short term. This week, pay attention to the US 2Q GDP on Thursday and the PCE price indexes on Friday.
>
1-hour chart(above) > The upward trend has slowed down to (1.1) after the gold price escaped channel(1). The current S-T resistance is at 2520-30(2). The range bound of 2480-2510 3) can be used as the operating range at the beginning of this week, until the next breakout
>
Daily Chart(above) > It will be the first sign for gold prices to break upward if it one day closes above 2513 on the daily chart. 2480 is the key support at the downside.
P. To
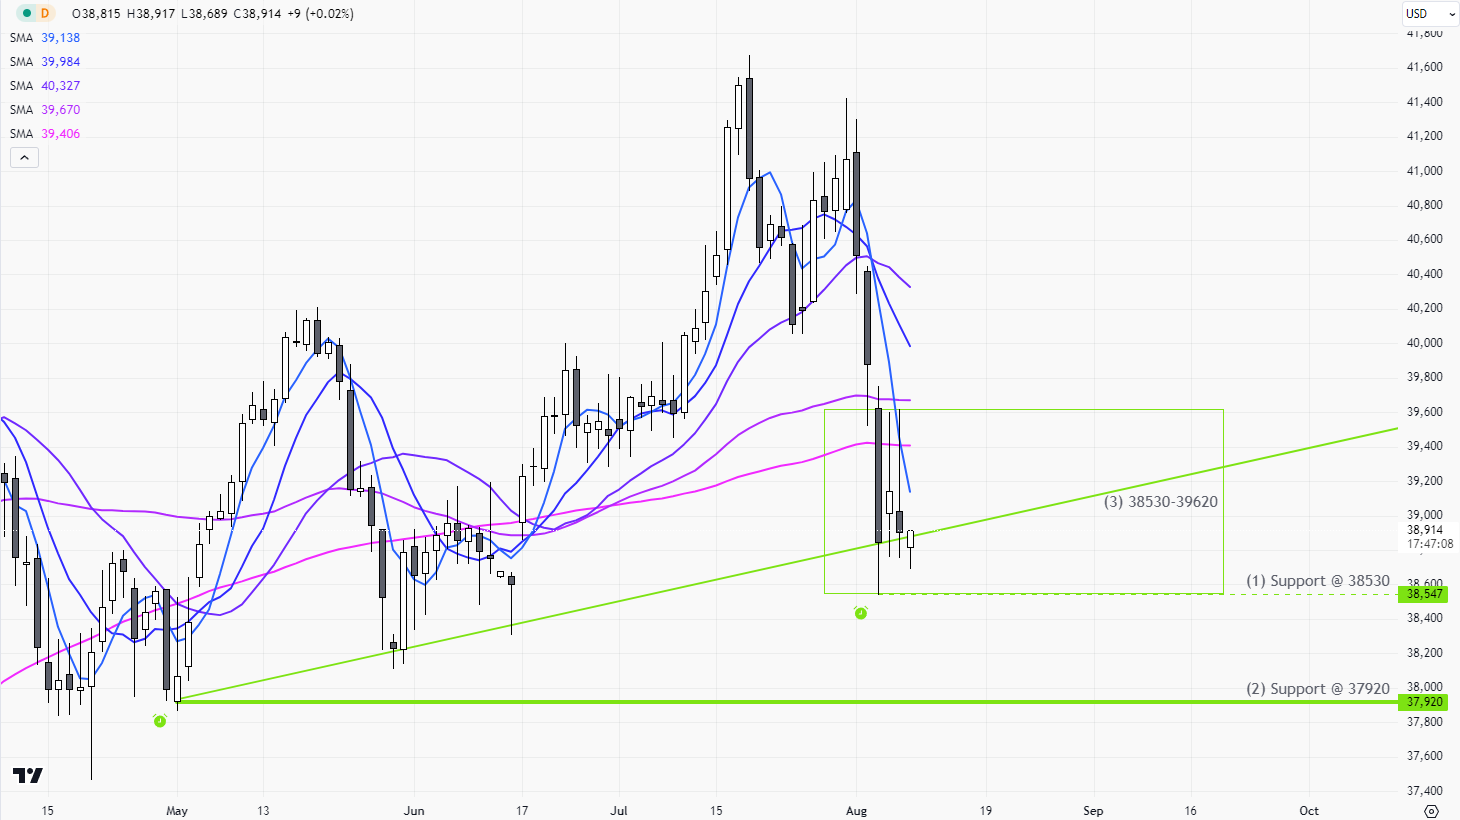
Dow
???? 通知 日線圖 技術指標 / 形態 1 支持 38530 2 主要支持 37920 *所有技術觸發將即時發送到 Telegram 頻道
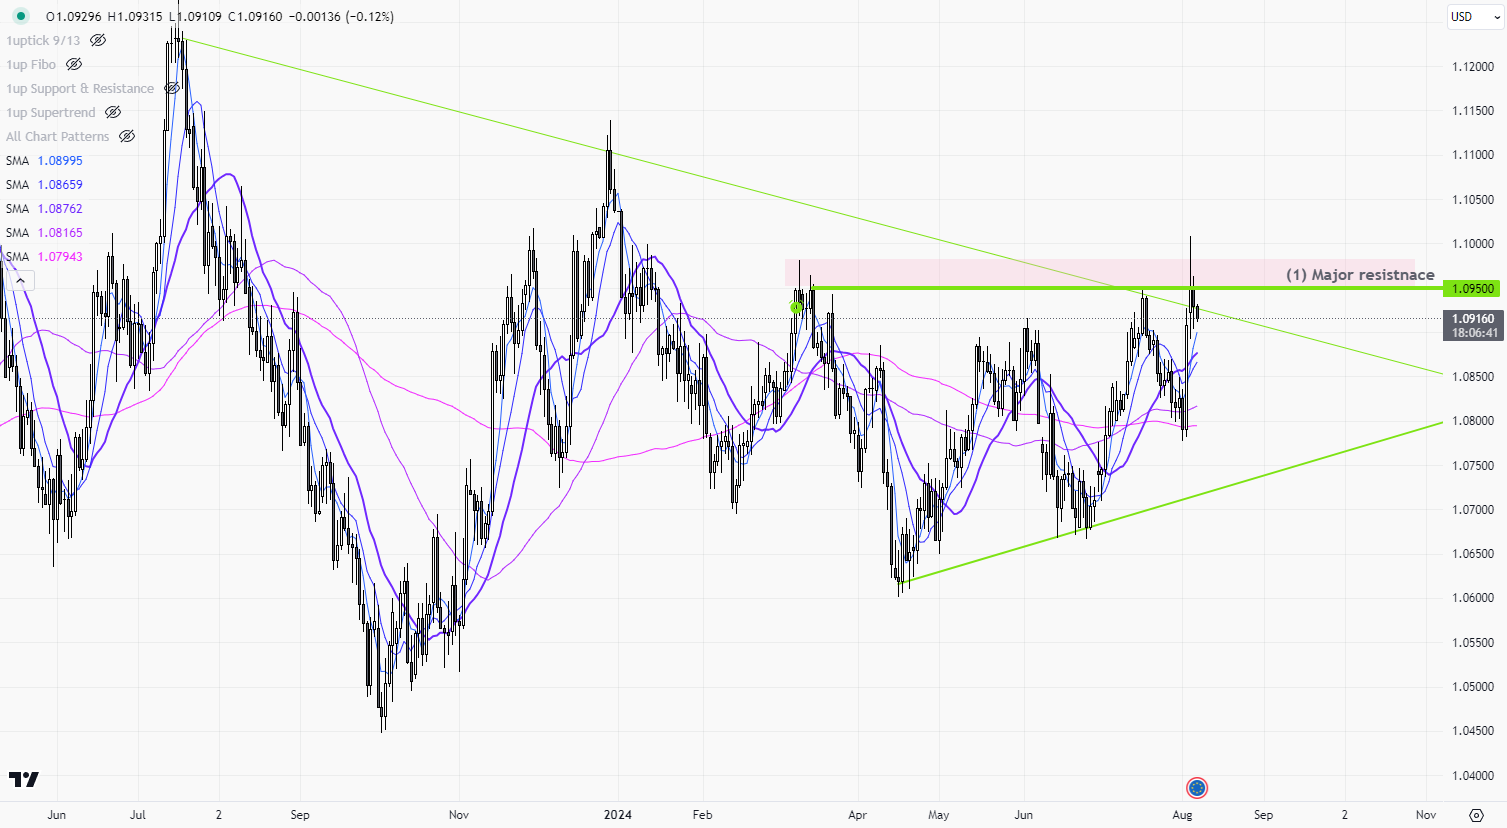
EURUSD 1d
???? Alerts Technical Indicators / Patterns 1. Major resistance @ 1.0950 *All alerts will sent to the Telegram Channel.
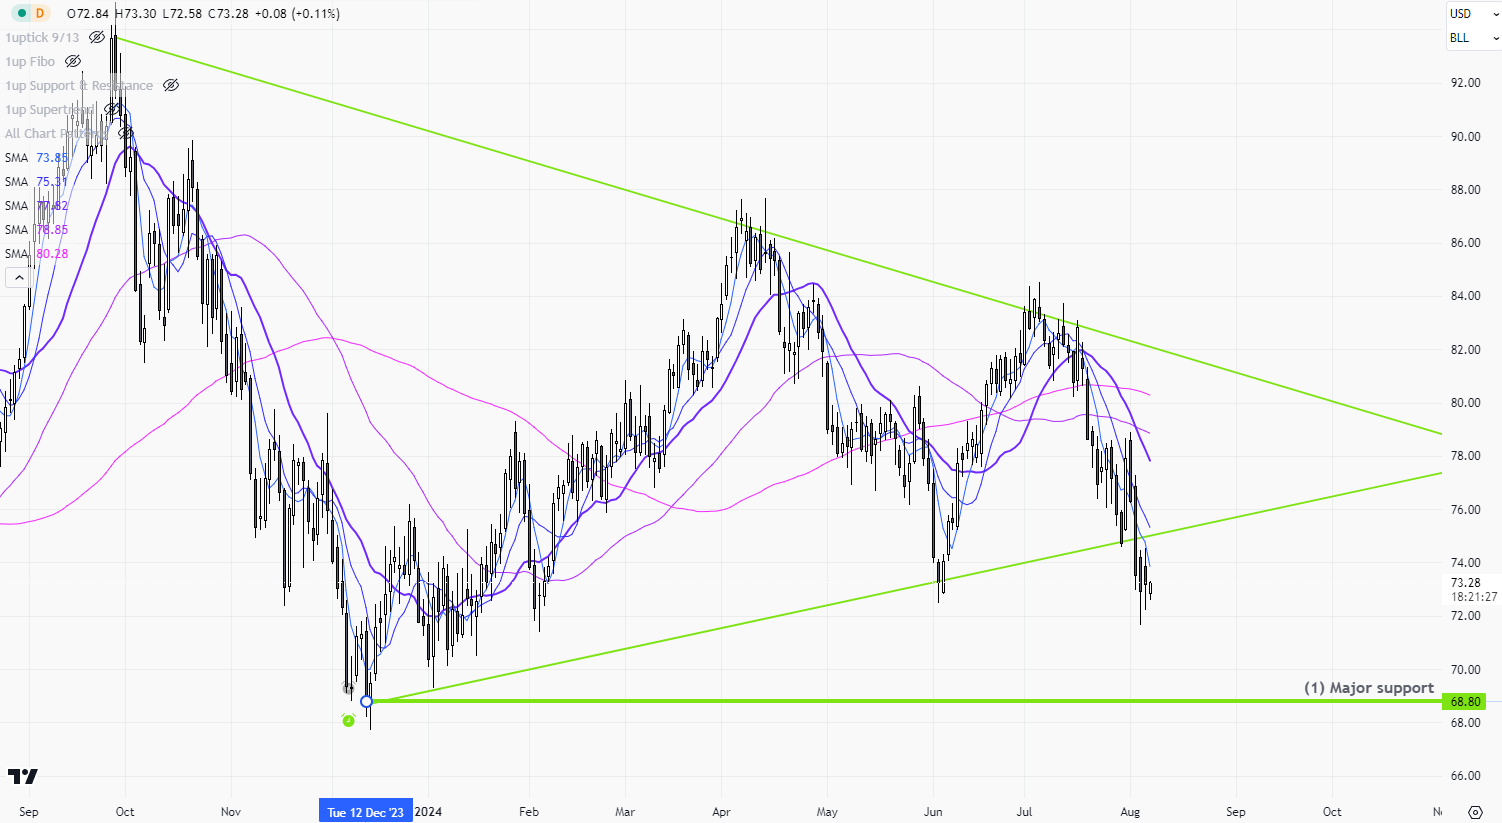
CLc1 Daily
???? Alerts Technical Indicator / Pattern 1. Major support @ 68.8 *All alerts will sent to the Telegram Channel.
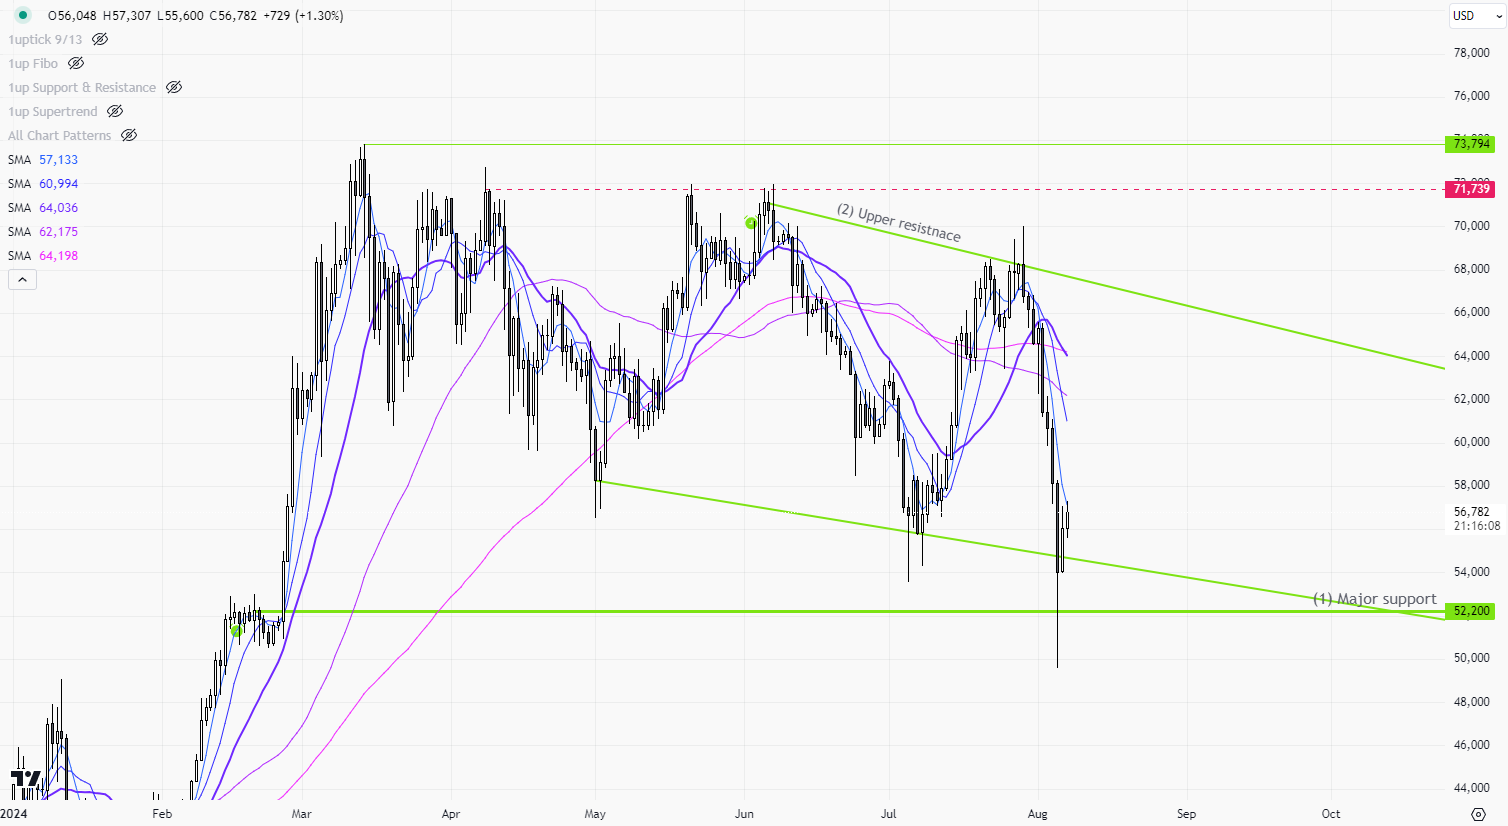
BTCUSD Daily
???? Alerts Technical Indicators / Patterns 1. Major support2. Wedge upper resistance *All alerts will sent to the Telegram Channel.
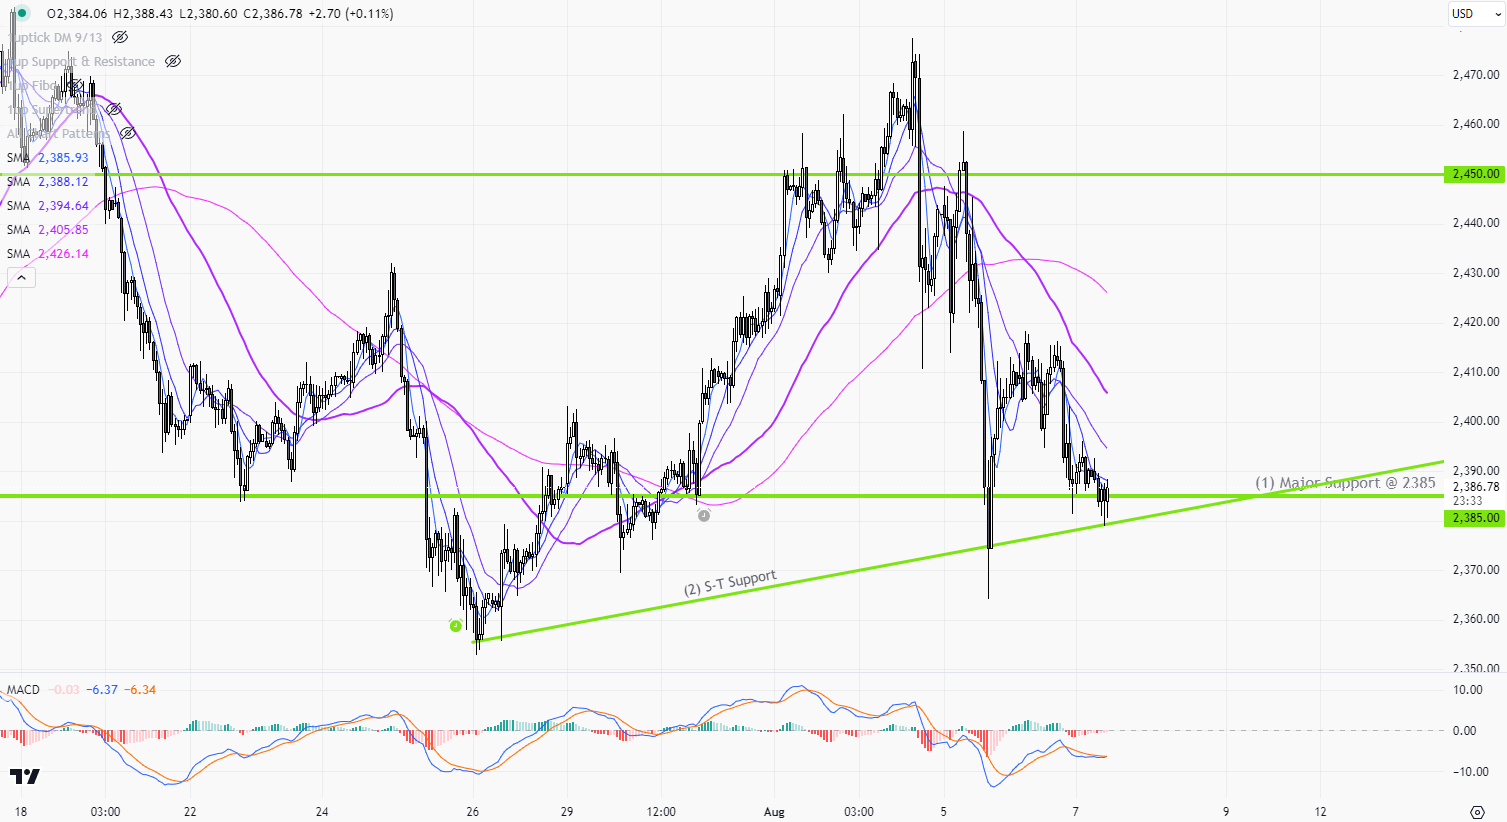
XAUUSD 1h
???? Alerts Technical Indicator / Pattern 1. Major Support2. S-T Support Line *All alerts will sent to the Telegram Channel.
Gold Trend 05/08 – The spot gold price is losing upward momentum despite the expectations of a Fed. Rate cut increasing
The spot gold price went up during the week but fell after Friday’s US non-farm payroll report. Looking back at last week, the price broke through the 2400 resistance before the Fed—meeting on Wed. The price kept on rising after Powell’s dovish speech, and tensions rose in the Middle East as Iran’s leader ordered attacks on Israel in response to the assassination of a Hamas leader. The US released weaker-than-expected job data on Fri., causing gold prices to hit a weekly high and rechallenge the historical peak 2480. However, the market quickly focused on concerns that the US economy might enter a recession. US stocks rapidly fell from their highs, dragging gold prices down to a daily low of 2410, closing the week at 2442.
According to CME FedWatch, the latest interest rate futures indicate that the probability of a 50 basis point rate cut in September increased from 22% on Thursday to 95% early in the Monday Asian session. Whether in the gold or stock markets, a rate cut should boost the market. However, despite reaching twice above 2450 in the past month, the spot gold price didn’t have any significant new long-buying position above 2450 but profit-taking and new short-selling positions. The market now broadly expects the first rate cut to happen in September. As the first rate cut approaches, it is almost time for investors who entered long for the ‘rate cut’ concept at the beginning of the year to plan their exit. ‘Buy on the rumour, sell on the news’ ~ gold prices may still hit a new high before September, but expect a significant correction around the first rate cut!
>
1-hour Chart > The price still runs within the upward wedge(2). In the S-T, gold prices are supported by the trendline(2.1). If this support is broken, a significant correction may occur, with a target of 2400. Currently, the range of 2450-53 is acting as an S-T resistance zone, while stronger resistance is expected at 2478-80.
>
Daily Chart > No major economic data are expected to be released this week, and gold prices are unlikely to break high. The initial expectation is to work within the range of 2410-80 established last Friday.
P. To