

 |
| Gold V.1.3.1 signal Telegram Channel (English) |

WTI Crude Oil: US Deepens Venezuela Intervention Pressures Price; Key Support Levels in Focus
2026-01-08 @ 06:01
Over the past 24 to 48 hours, WTI crude oil prices experienced notable volatility, closing at $56.18 per barrel on January 7, 2026, showing a decline from the previous day. The key driver behind this movement is the US deepening its involvement in Venezuela’s oil industry, including the seizure of two sanctioned tankers and securing up to 50 million barrels of Venezuelan crude supply.
This development sparked market expectations of increased Venezuelan oil supply, putting downward pressure on prices. The US Energy Secretary also confirmed ongoing cooperation with Venezuelan stakeholders and US oil companies to expand production, further intensifying supply-side concerns. Consequently, the risk of oversupply weighed heavily on crude prices.
For the average investor, this situation can be seen as the US strategically leveraging military and diplomatic measures to control critical oil resources, boosting supply and leading to lower prices. This market dynamic highlights the importance of monitoring geopolitical events and US policy shifts, as they have a direct impact on energy commodity supply-demand balance and price fluctuations.
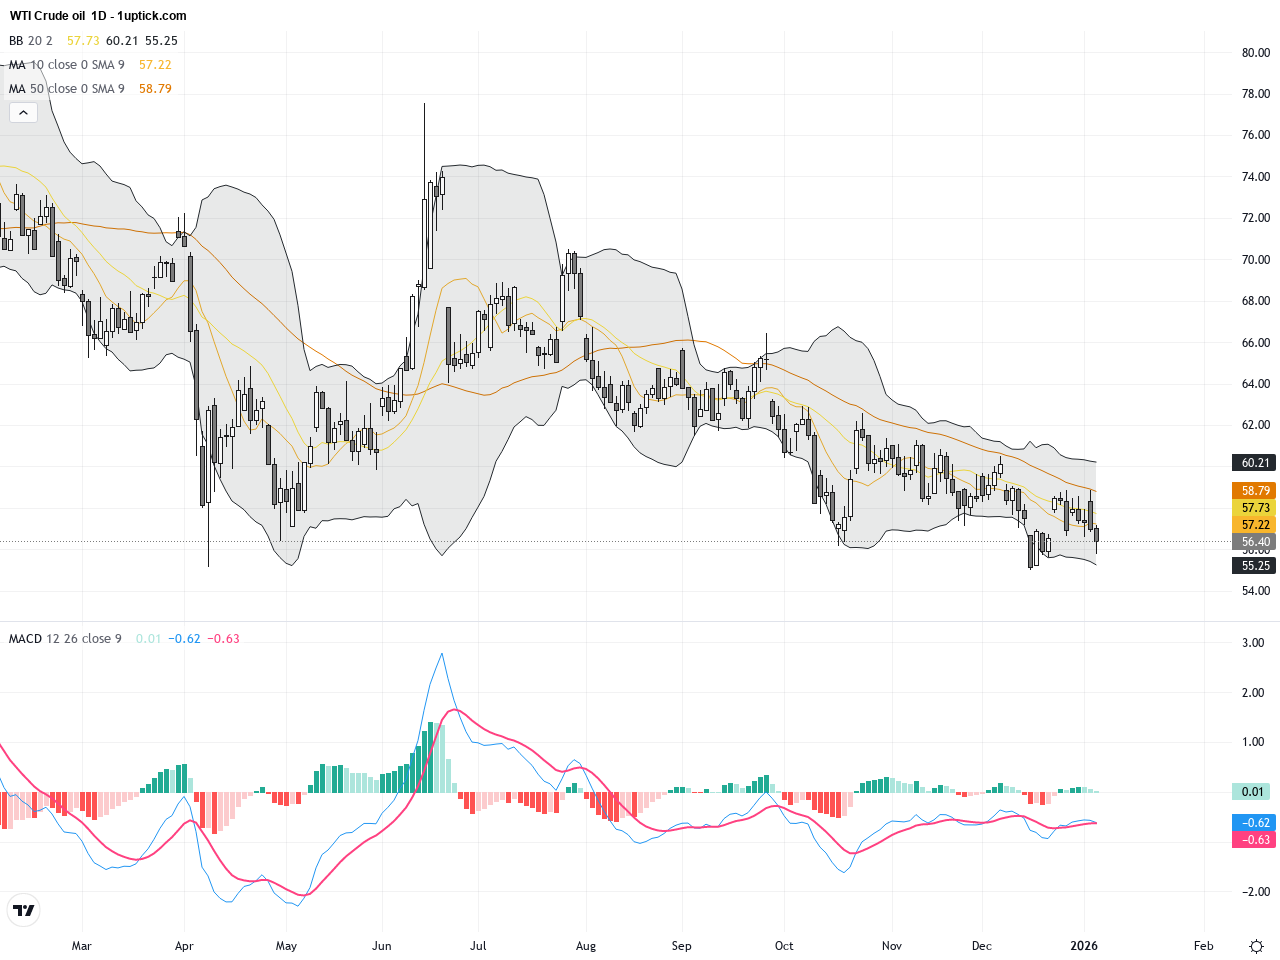
The daily chart reveals a gradual downward trend in WTI Crude oil since the recent high near $58.87. Moving Averages are converging with MACD indicating increasing bearish momentum. Bollinger Bands have narrowed suggesting reduced volatility but a bias towards downside. The price is hovering between $56 and $57 support areas, indicating a short-term corrective phase. A break below $56 could confirm a technical pullback.

Over the past 3-5 days on the hourly chart, a clear downtrend is visible with prices breaking short-term support levels. Short-term MAs (5 and 10 periods) have crossed below long-term MAs, confirming increased selling pressure. MACD histogram and signal lines continue lower, and RSI approaches oversold territory. Multiple bearish candlesticks suggest weak buying interest, with critical support near $55.80 holding potential for a short-term rebound.
Technical Trend: The current trend is cautiously bearish, with bulls and bears battling around $56, but sellers holding slight control.
Technical indicators highlight that WTI Crude oil is at a crucial inflection point. Widening MACD negative values and RSI near oversold signal potential for further downside. Absence of clear reversal patterns means short-term bearish momentum may continue. Watch the $56 support closely as its breach could trigger new declines. Meanwhile, fluctuations in the US dollar and supply news could cause volatility, where any breakout might lead to swift price movements.Today’s economic calendar shows no significant or direct events impacting WTI Crude oil prices. However, ongoing geopolitical developments between the US and Venezuela remain a key factor influencing market sentiment.
Resistance & Support

The above financial market data, quotes, charts, statistics, exchange rates, news, research, analysis, buy or sell ratings, financial education, and other information are for reference only. Before making any trades based on this information, you should consult independent professional advice to verify pricing data or obtain more detailed market information. 1uptick.com should not be regarded as soliciting any subscriber or visitor to execute any trade. You are solely responsible for all of your own trading decisions.