 |
| Gold V.1.3.1 signal Telegram Channel (English) |

GBPUSD Technical & Fundamental Analysis: Key Resistance Holds Amid Bullish Consolidation
2026-03-11 @ 13:01
Over the past 24 to 48 hours, GBP/USD has experienced notable volatility, rising from yesterday’s closing price of 1.34174 to around 1.3454, an increase of about 0.27%. This upward movement was mainly driven by global market reactions to escalating tensions in the Middle East, specifically the closure of the Hormuz Strait. This heightened geopolitical risk sent oil prices surging 25%, fueling inflation concerns and thereby boosting demand for the US Dollar. The US Dollar Index (DXY) reached a high of 99.35, reflecting the dollar’s status as a safe-haven currency and impacting market liquidity significantly.
However, despite the initial dollar strength, the greenback softened on Thursday due to surprisingly moderate inflation data and market expectations that the US Federal Reserve may pause rate hikes. This allowed GBP/USD to find support near the 1.3250 level. Meanwhile, the British Pound came under pressure amid market anticipation of a possible Bank of England rate cut in March, leading the pair to briefly dip to lows near 1.3409.
For the average investor, these developments highlight how geopolitical risks and sharp swings in energy prices can quickly influence currency markets, particularly the Dollar-Pound relationship. Investors should closely watch the Bank of England’s policy decisions and US inflation figures, as these fundamentals will dictate the pair’s trajectory. In the short term, a tug-of-war between safe-haven demand and policy expectations will continue shaping GBP/USD volatility.
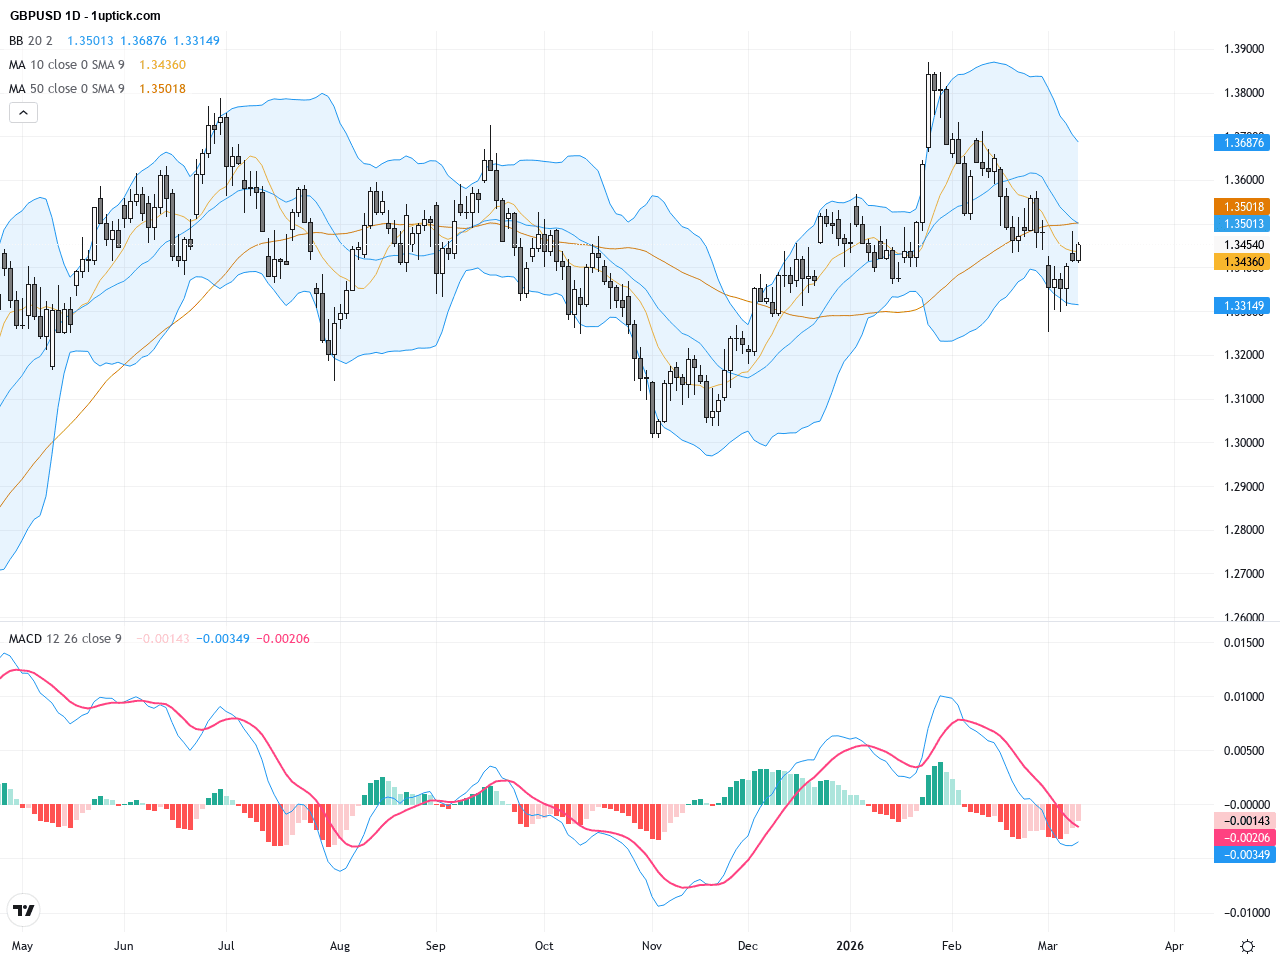
The daily chart shows GBPUSD retreating from a recent high of 1.3868, indicating a gradual downward correction. The price oscillates around the 200-day moving average (~1.34135), confirming solid long-term support. The Bollinger Bands are contracting, suggesting reduced volatility and a potential sideways consolidation soon. The MACD is near the zero line, reflecting weakened bullish momentum but no clear reversal yet.
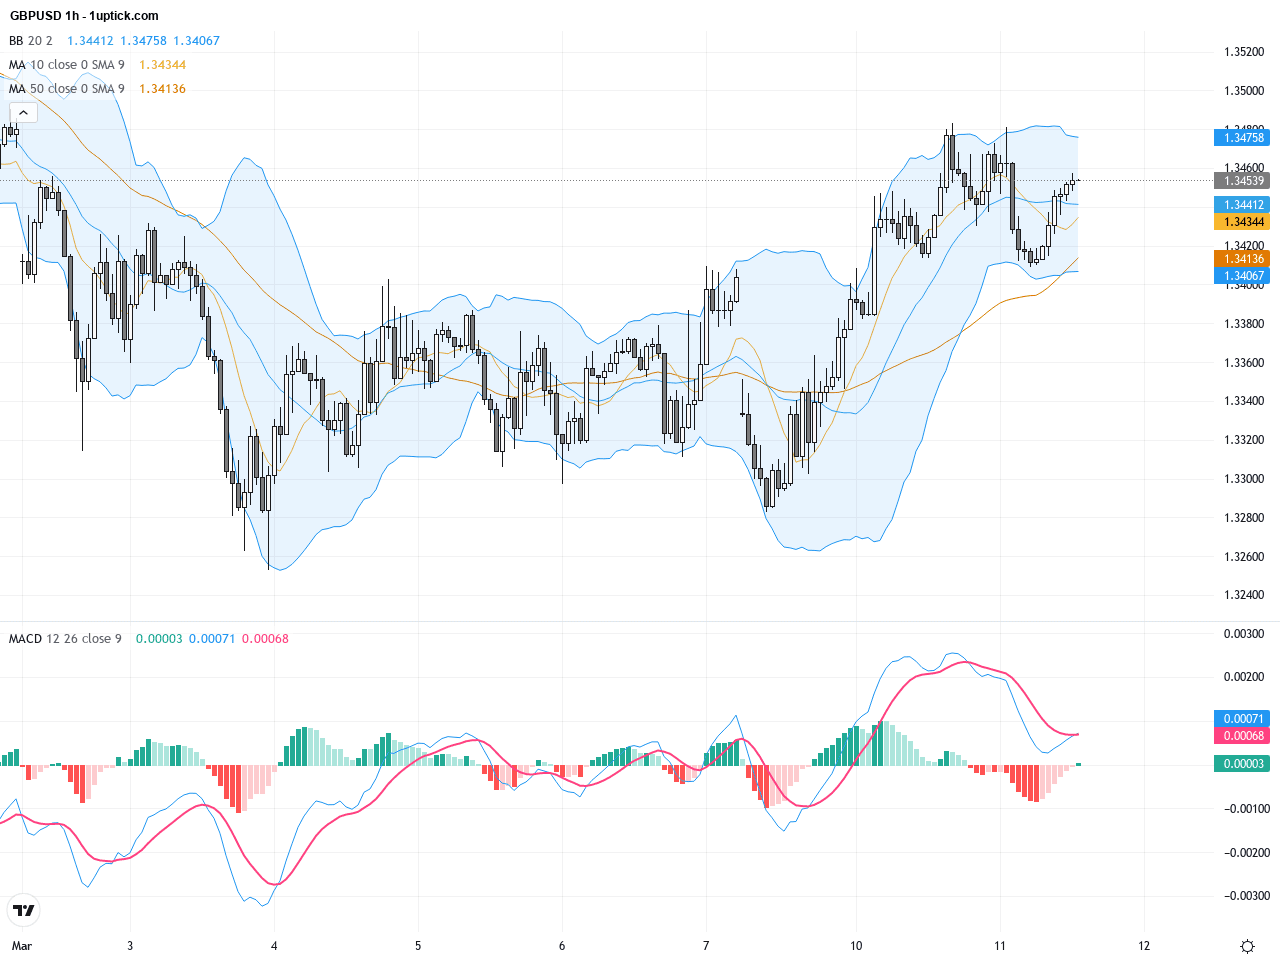
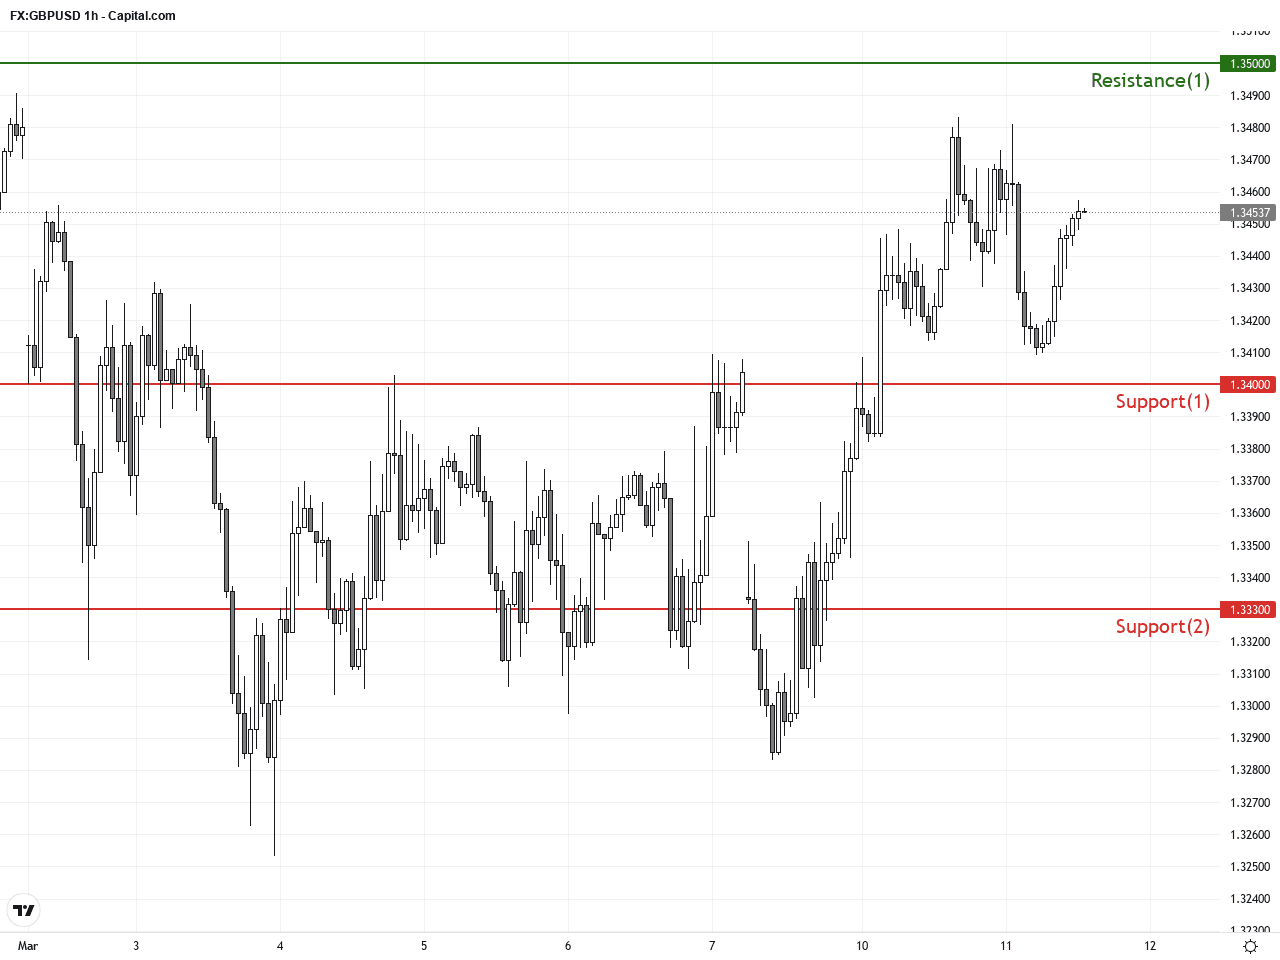
On the hourly chart, GBPUSD exhibits sideways consolidation over the past 3-5 days, stabilizing near the 50-hour moving average at around 1.3450. Attempts to break above the 1.3500 resistance level have failed, indicating short-term selling pressure. MACD shows subtle crossovers in consolidation territory, and RSI remains neutral without overbought/oversold extremes, signaling that price may continue ranging between 1.3400 and 1.3500.
Technical Trend: The GBPUSD trend is currently cautiously sideways with a mild bullish bias, consolidating short term while awaiting confirmation of a breakout from key resistance levels and fundamental catalysts.
Technically, GBPUSD shows signs of short-term momentum slowing, with a potential MACD bearish crossover and contracting Bollinger Bands indicating consolidation. On the daily chart, a flag-like pattern is forming, and a break above its upper boundary could trigger a new bullish leg. Recently, a small bullish engulfing candlestick has appeared, hinting at a possible short-term bounce, but confirmation with volume is necessary.Today’s GMT+1 economic calendar lacks major events directly impacting GBPUSD. However, the US Consumer Price Index (CPI) and Core CPI releases at 13:30 are highly relevant. As these data strongly influence USD strength, they indirectly affect GBPUSD. A higher-than-expected CPI could strengthen the dollar, pressuring GBPUSD downward, while a weaker print could allow for a pound rebound. Traders should monitor this data closely to adjust positions accordingly.
Resistance & Support
The above financial market data, quotes, charts, statistics, exchange rates, news, research, analysis, buy or sell ratings, financial education, and other information are for reference only. Before making any trades based on this information, you should consult independent professional advice to verify pricing data or obtain more detailed market information. 1uptick.com should not be regarded as soliciting any subscriber or visitor to execute any trade. You are solely responsible for all of your own trading decisions.