Month: March 2026

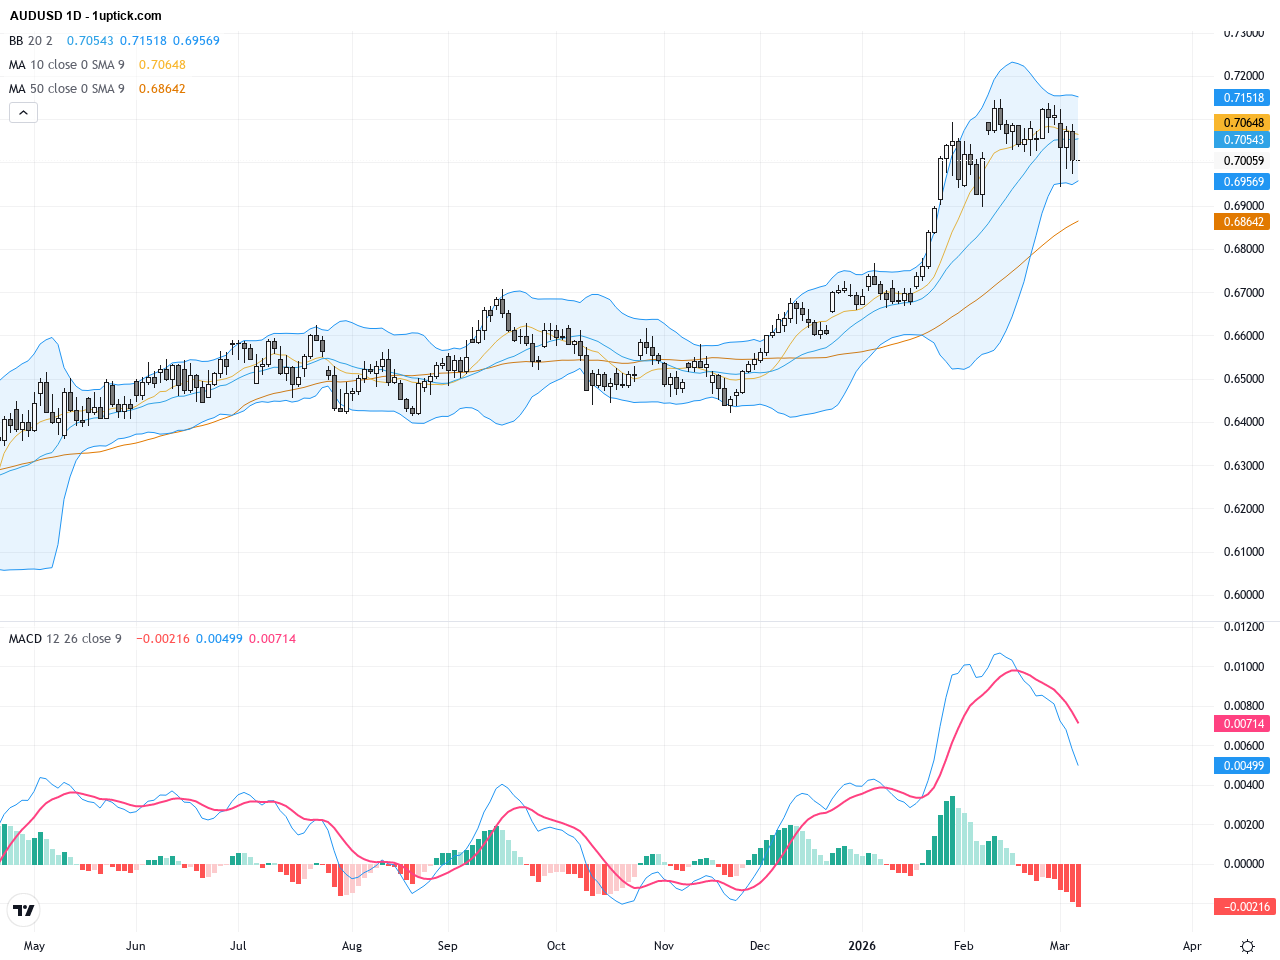
AUDUSD: Key Support at 0.7033 Under Threat Amidst US Dollar Strength and Geopolitical Tensions

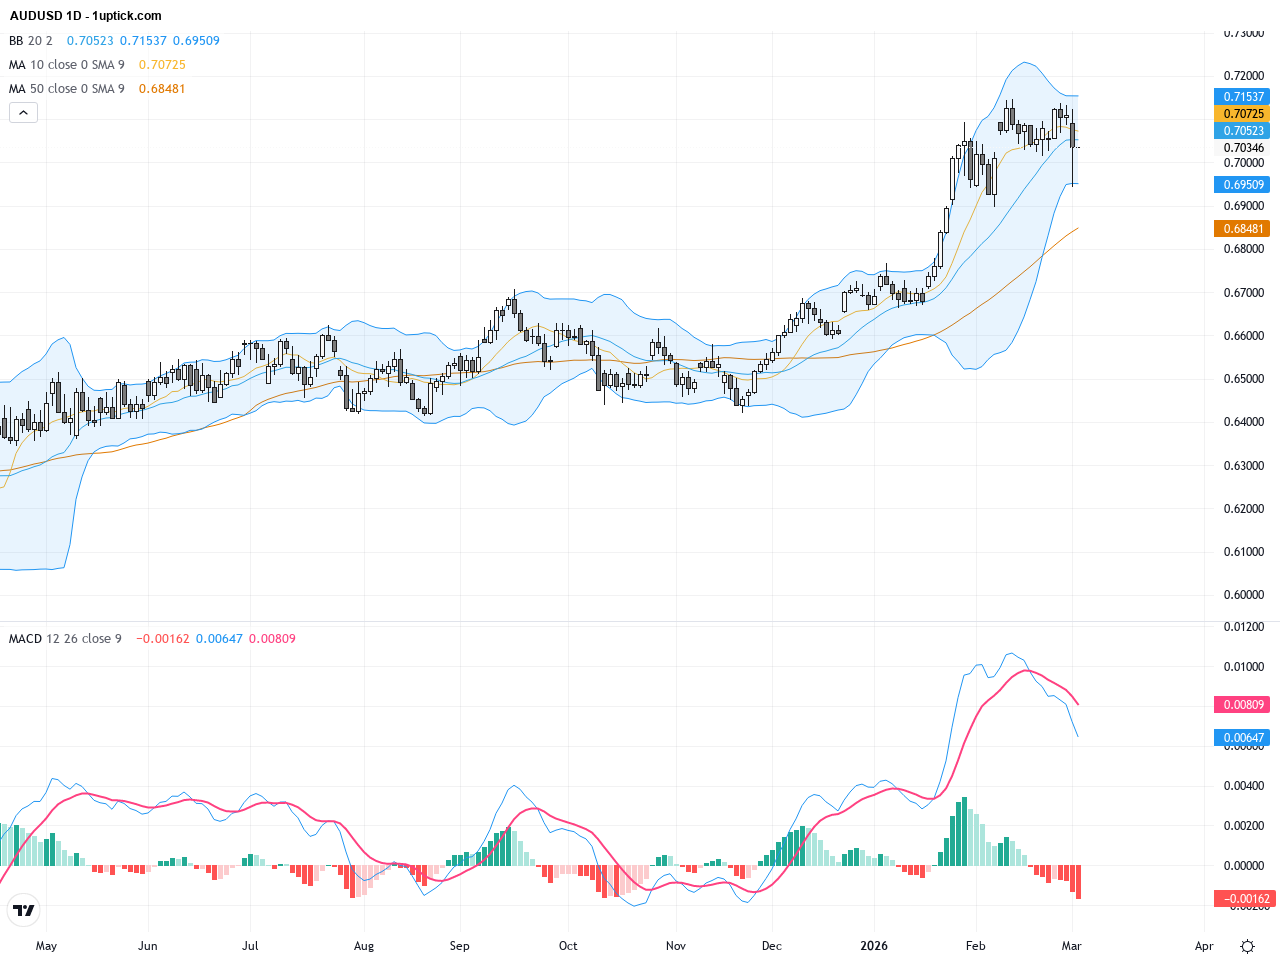
Over the past three trading days, AUDUSD has seen notable declines, closing at 0.70059 yesterday with nearly a 1% drop. The US Dollar strengthened due to robust US economic data and rising safe-haven flows, pressuring the AUD. Geopolitical tensions and narrowing Australian trade surplus further weighed on the Aussie. For average investors, this means heightened short-term risk with the critical 0.7033 support level acting as a key battleground. A break below this could extend the short-term downtrend, while holding it offers scope for a rebound.

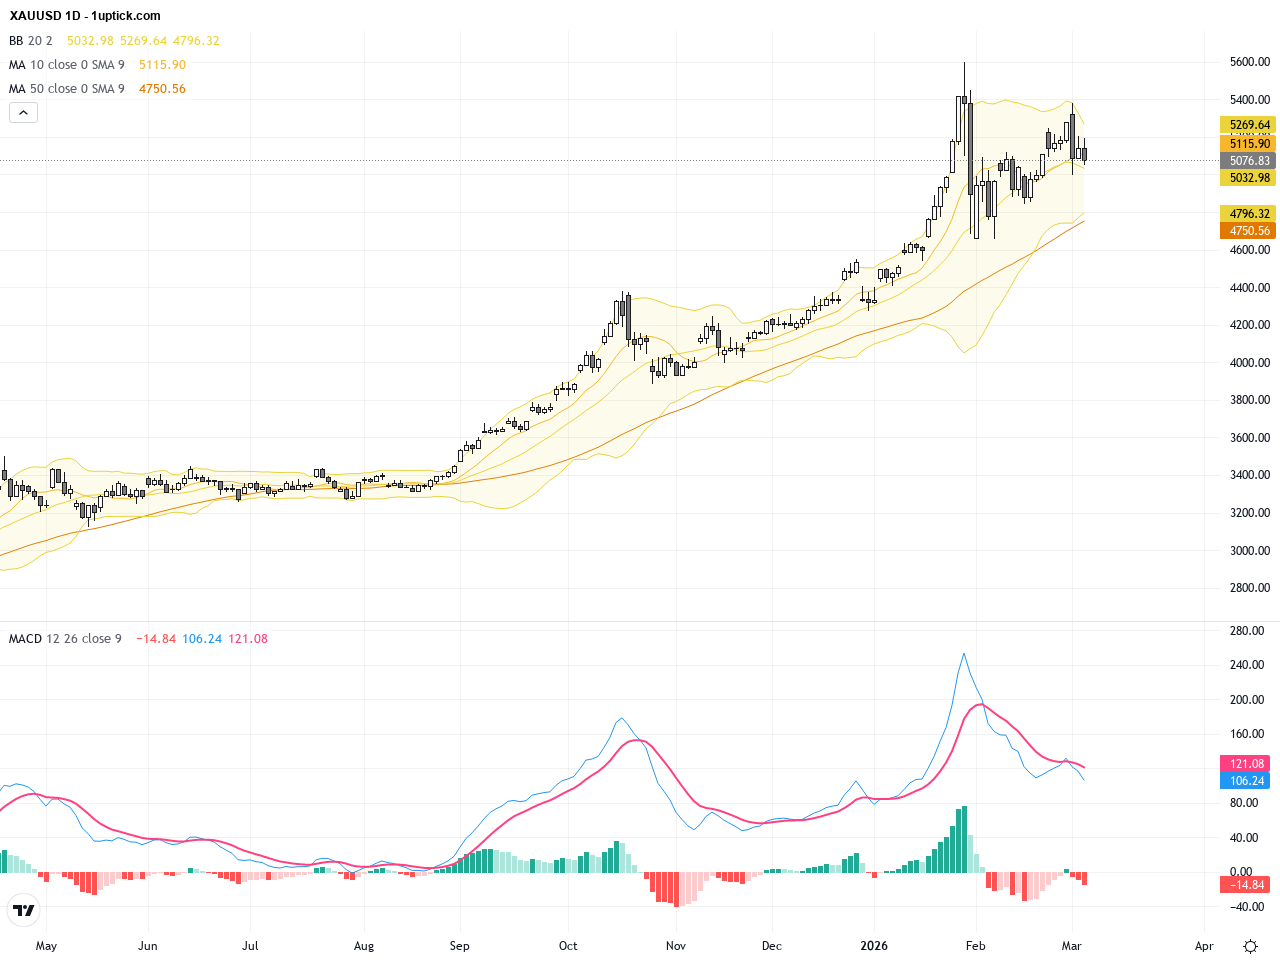
XAUUSD: Gold Falls Below $5100 Support as Correction Extends – Technical Patterns Signal Caution

Over the past three trading sessions, XAUUSD (Gold) has experienced heightened volatility, plunging from a high near $5354 to closing around $5080 yesterday. Market news highlights the persistent effort of gold to hold support in the $5100–$5120 range amid ongoing pullbacks. Rising US-Iran geopolitical tensions have boosted safe-haven demand, sending gold and oil prices higher. For average investors, this means increased short-term volatility in safety assets. The week’s price action and geopolitical backdrop have driven mixed market sentiment, leaving gold in a tug-of-war between bears and bulls. Traders should closely watch if the critical support breaks to manage risk effectively.

USDCAD: Oil-Driven Support Meets Key Resistance at 1.3700 Amid Dollar Strength

In the past three trading days, USDCAD displayed noticeable volatility, with prices hovering around 1.3630 after closing yesterday at 1.36498. Oil price gains have provided strong support for the Canadian dollar, while the broader US dollar remains robust, creating a tug-of-war environment. Recent market news highlights oil’s upward trajectory bolstering CAD, against a backdrop of persistent US dollar strength fueled by geopolitical and political developments. USDCAD is now positioned near a critical technical resistance level at 1.3700, making upcoming price reactions crucial for traders. For average investors, this scenario resembles a battle between two forces: rising oil prices backing the Canadian dollar and the ever-strong US dollar posing resistance, demanding cautious strategy planning.

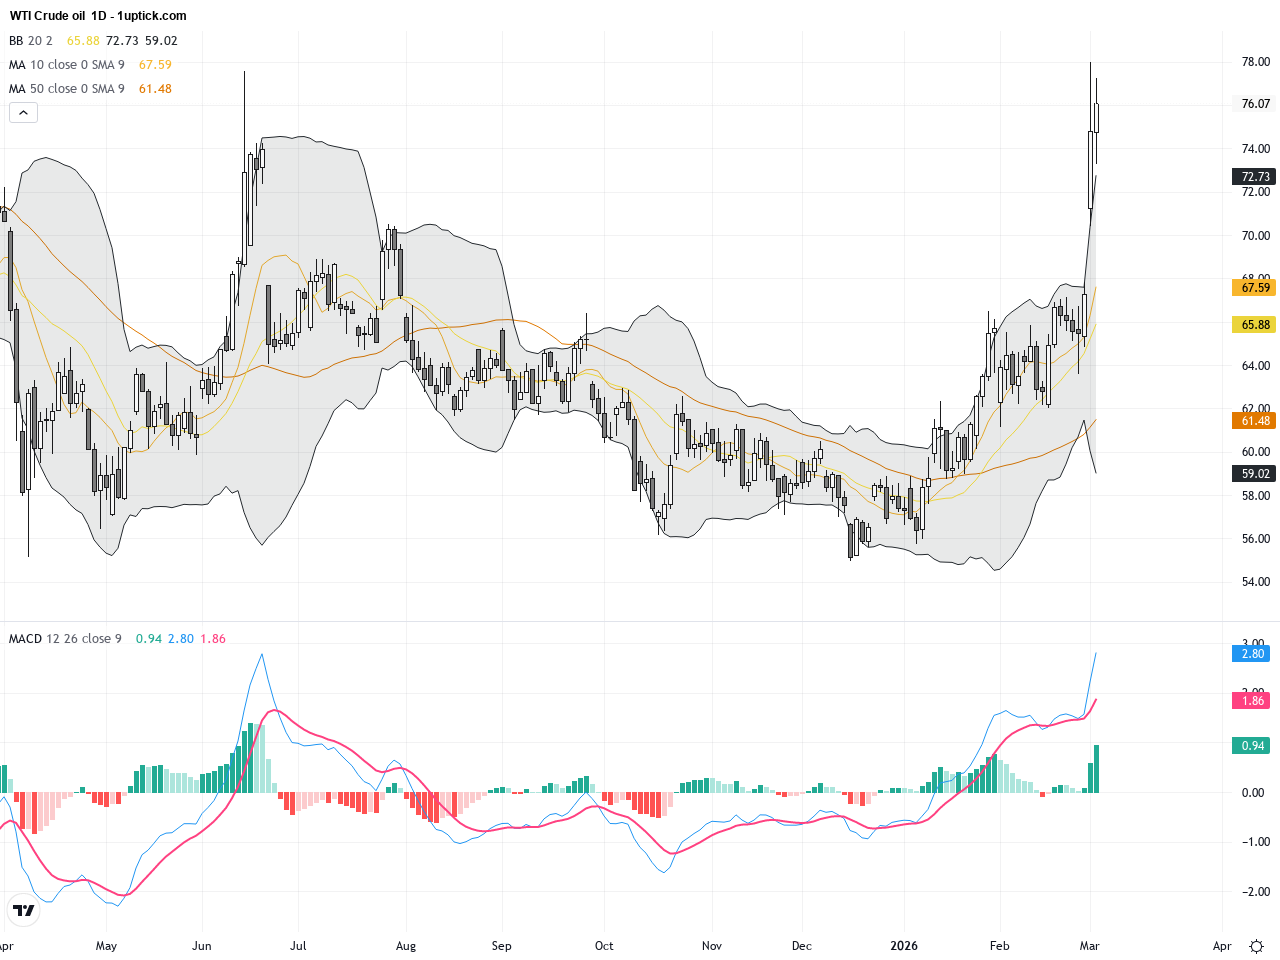
WTI Crude Oil: Middle East Tensions Spark Supply Risk and Bullish Flag Pattern

Over the past three trading days, WTI Crude Oil has rallied from $71.23 to close at $75.94 yesterday, driven by escalating geopolitical tensions in the Middle East. Conflicts involving the US and Iran have raised concerns over infrastructure risks in key oil-producing nations like Qatar, Saudi Arabia, and Iraq, pushing oil sentiment sharply higher. Price action shows significant volatility with strong upward momentum, yet short-term price consolidation signals caution ahead. This week’s market mood revolves around war-induced supply fears, rendering the WTI price outlook bullish but volatile. For average investors, the current scenario is like a ‘risk premium’ in oil prices rising sharply due to geopolitical instability, signaling potential gains but also higher market swings.

XAUUSD: Gold Rebounds Above Key Support with Technical Patterns Signaling Short-term Bullish Momentum

Over the past three trading sessions, XAUUSD has experienced significant volatility, dropping from the late February high near 5354 USD to close at 5139.59 USD on March 4. The market mood was largely driven by geopolitical tensions and a surging US dollar, causing a sharp 5% selloff despite escalating safe-haven demand. However, the recent drop in oil prices and ongoing Middle East tensions provided renewed safe-haven bids, supporting gold prices near critical support levels. For the average investor, this means although gold faced volatility this week, its role as a reliable safe haven remains intact and it is currently showing signs of a technical rebound worthy of close monitoring for trading opportunities.

XAUUSD: Gold Faces Key Resistance Amid Geopolitical Risks Igniting Safe-Haven Demand

Over the past three trading days, XAUUSD (Gold) has shown significant volatility, dropping from around $5321 on February 28 to closing at $5153 on March 4. The market was driven by escalating geopolitical tensions following the death of Iran’s Supreme Leader and the blockade of the Strait of Hormuz, sparking a surge in safe-haven buying that pushed gold close to $5400. However, the rally faced resistance due to a stronger US dollar and rising bond yields, reversing some of the gains. Despite the recent pullback, gold’s strong fundamentals remain intact, underscoring the importance of monitoring technical resistance and support levels as investors look for signs of sustained momentum in the current Trading Outlook.

GBPUSD: Technical Breakdown and Middle East Tensions Propel Dollar Strength – Key Support and Resistance Levels

Over the past three trading days, GBPUSD has shown a clear downward trajectory, closing yesterday at 1.33125, down nearly 0.31%. The US Dollar Index (DXY) surged to 98.73 amid escalating Middle East tensions, becoming the main catalyst for market volatility this week. The Pound faces pressure from anticipated interest rate adjustments and strong US dollar safe-haven demand, keeping GBPUSD weak in the short term. Investors are likely to see continued Sterling weakness while the dollar remains robust. By analyzing technical trends and critical price levels, traders should focus on the 1.3300 to 1.3400 range for support and resistance as they navigate the volatile market environment.

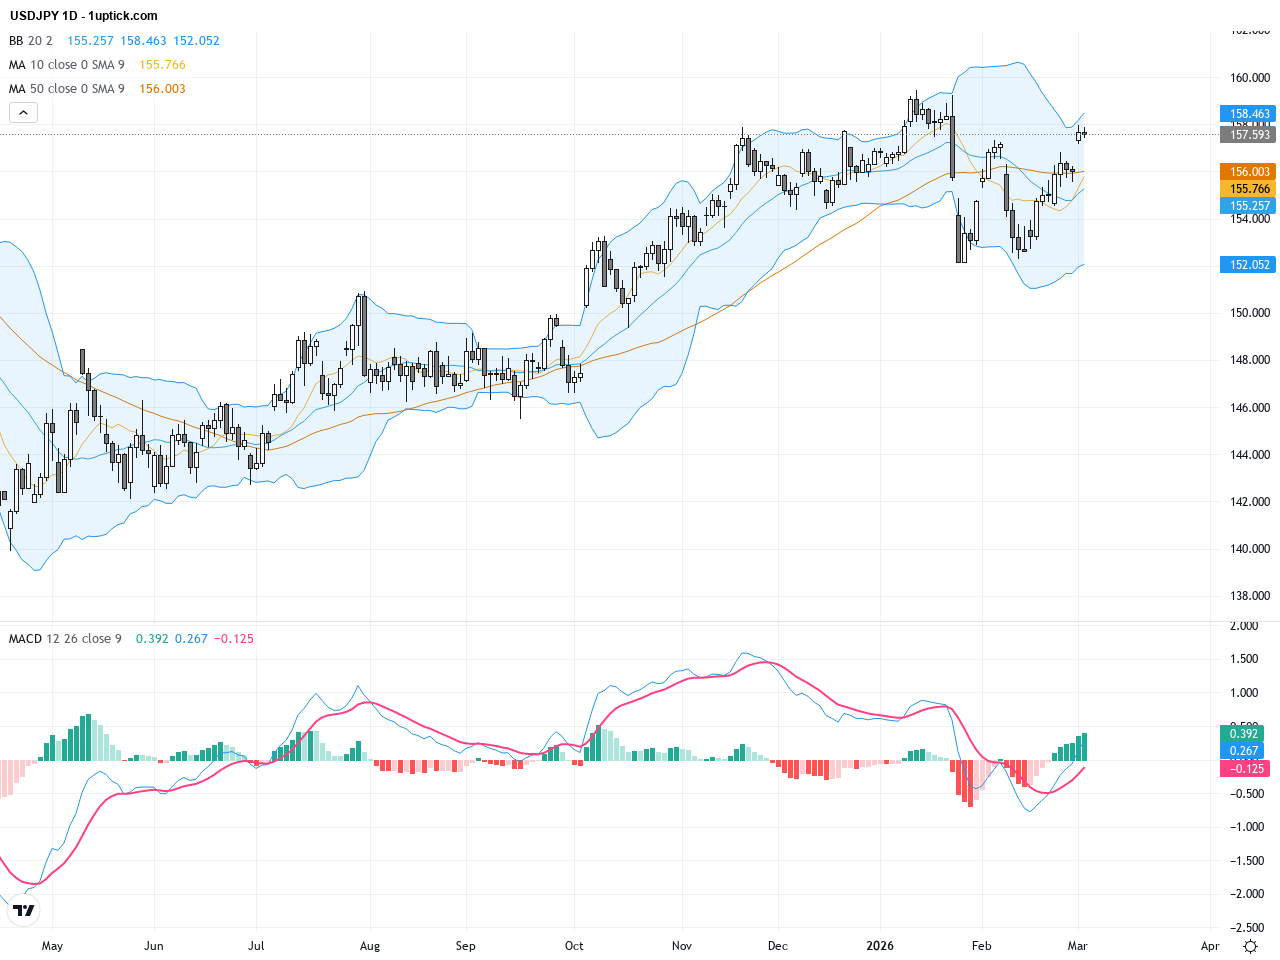
USDJPY Rallies as Fed Rate Cut Chances Diminish and Geopolitical Tensions Weigh on Yen

Over the past three trading days, USDJPY has exhibited a clear bullish momentum, with yesterday’s closing price at 157.598, near recent highs. The market is driven primarily by a strengthening US dollar amid reduced expectations for Fed rate cuts. Additionally, escalating geopolitical tensions in the Middle East have heightened yen weakness, continuing the pair’s upward grind. For everyday investors, this combination of monetary policy uncertainty and geopolitical risk is translating into increased volatility. Current USDJPY price action indicates potential further gains in the near term, but traders should remain cautious of key resistance levels and news developments that could sway market sentiment.

EURUSD Technical & Fundamental Outlook: Middle East Tensions Propel USD Strength, Euro Faces Continued Pressure

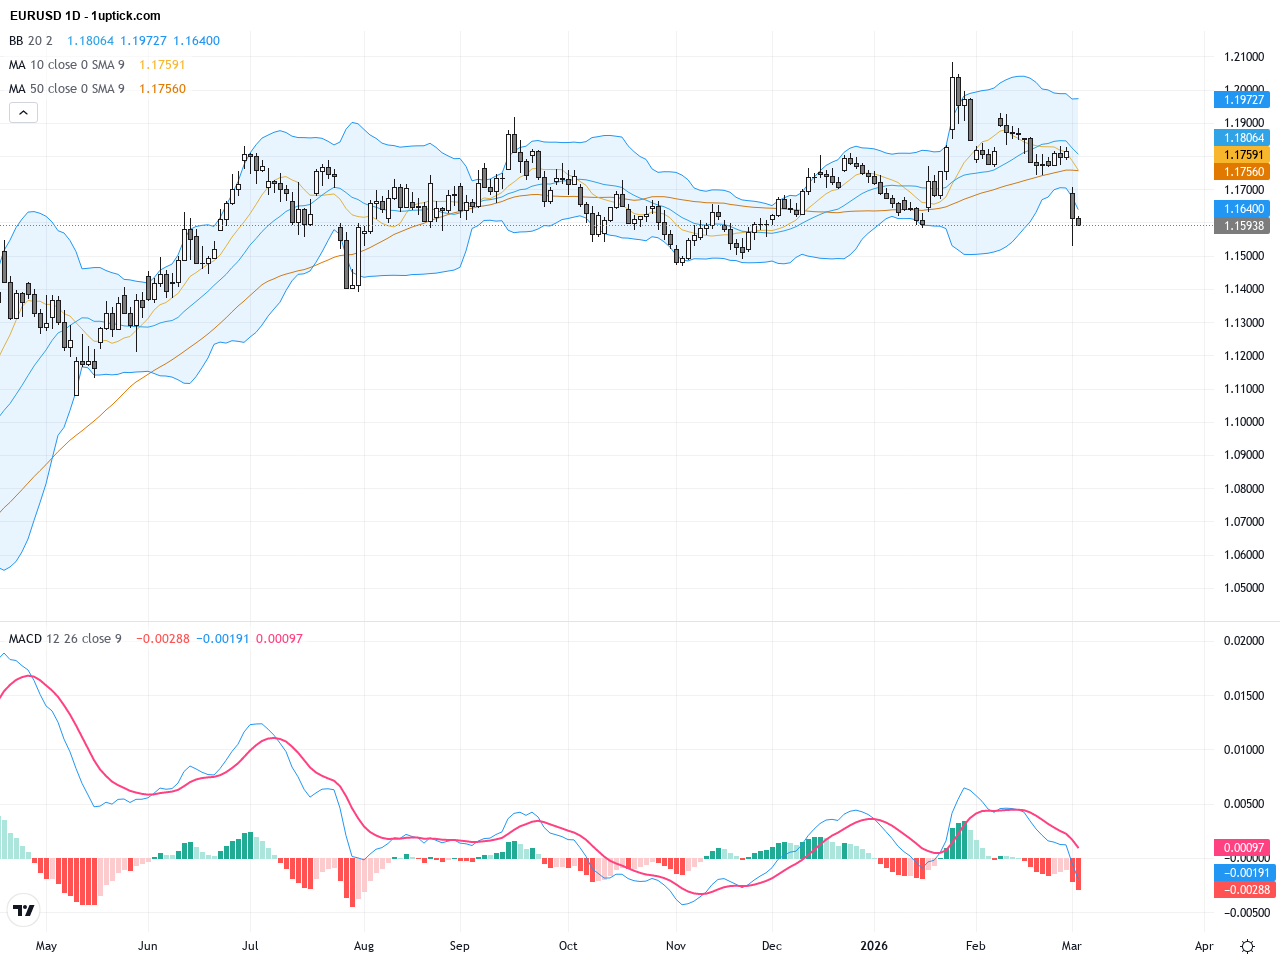
Over the past three trading days, EURUSD has exhibited notable volatility, dipping from around 1.1600 to lows near 1.1530, with yesterday’s close at 1.15935. Heightened geopolitical tensions in the Middle East have boosted USD demand as a safe haven, overshadowing the Eurozone’s hotter-than-expected inflation data. For everyday investors, this highlights how global events heavily sway forex markets, emphasizing the need to monitor geopolitical developments and European economic data for short-term trend guidance. Current EURUSD price action reflects market recognition of USD strength and doubts around Eurozone economic recovery, urging traders to watch key technical support and resistance levels carefully.

AUDUSD Breaks Below 0.7000 Amid Rising USD Strength and Middle East Tensions

Over the past three trading days, AUDUSD has faced increased volatility and bearish pressure, closing yesterday at 0.70346 with intraday lows near 0.69478. The pair plunged below the critical 0.7000 level driven by escalating tensions in the Middle East that boosted demand for the US dollar as a safe haven. Despite Australia’s unexpectedly higher inflation figures supporting the Aussie’s medium-term outlook, immediate market sentiment remains dominated by risk aversion, dripping AUDUSD to multi-week lows. For the average investor, this scenario highlights how geopolitical risks can quickly shift currency market dynamics, emphasizing the need to stay updated on global events and adapt trading strategies accordingly.

1uptick Analytics @

Risk Warning​

*Investment involves risk. You may use the information, strategies and trading signals on this website for academic and reference purposes at your own discretion. 1uptick cannot and does not guarantee that any current or future buy or sell comments and messages posted on this website/app will be profitable. Past performance is not necessarily indicative of future performance. It is impossible for 1uptick to make such guarantees and users should not make such assumptions. Readers should seek independent professional advice before executing a transaction. 1uptick will not solicit any subscribers or visitors to execute any transactions, and you are responsible for all executed transactions.

© 2022-26 1uptick Analytics all rights reserved.


Risk Warning​

*Investment involves risk. You may use the information, strategies and trading signals on this website for academic and reference purposes at your own discretion. 1uptick cannot and does not guarantee that any current or future buy or sell comments and messages posted on this website/app will be profitable. Past performance is not necessarily indicative of future performance. It is impossible for 1uptick to make such guarantees and users should not make such assumptions. Readers should seek independent professional advice before executing a transaction. 1uptick will not solicit any subscribers or visitors to execute any transactions, and you are responsible for all executed transactions.

© 1uptick Analytics all rights reserved.

Home
.AI
Analysis
Calendar
Tools