Month: March 2026

AUDUSD Technical & Fundamental Analysis: Key Support Holds Amid Geopolitical Drag

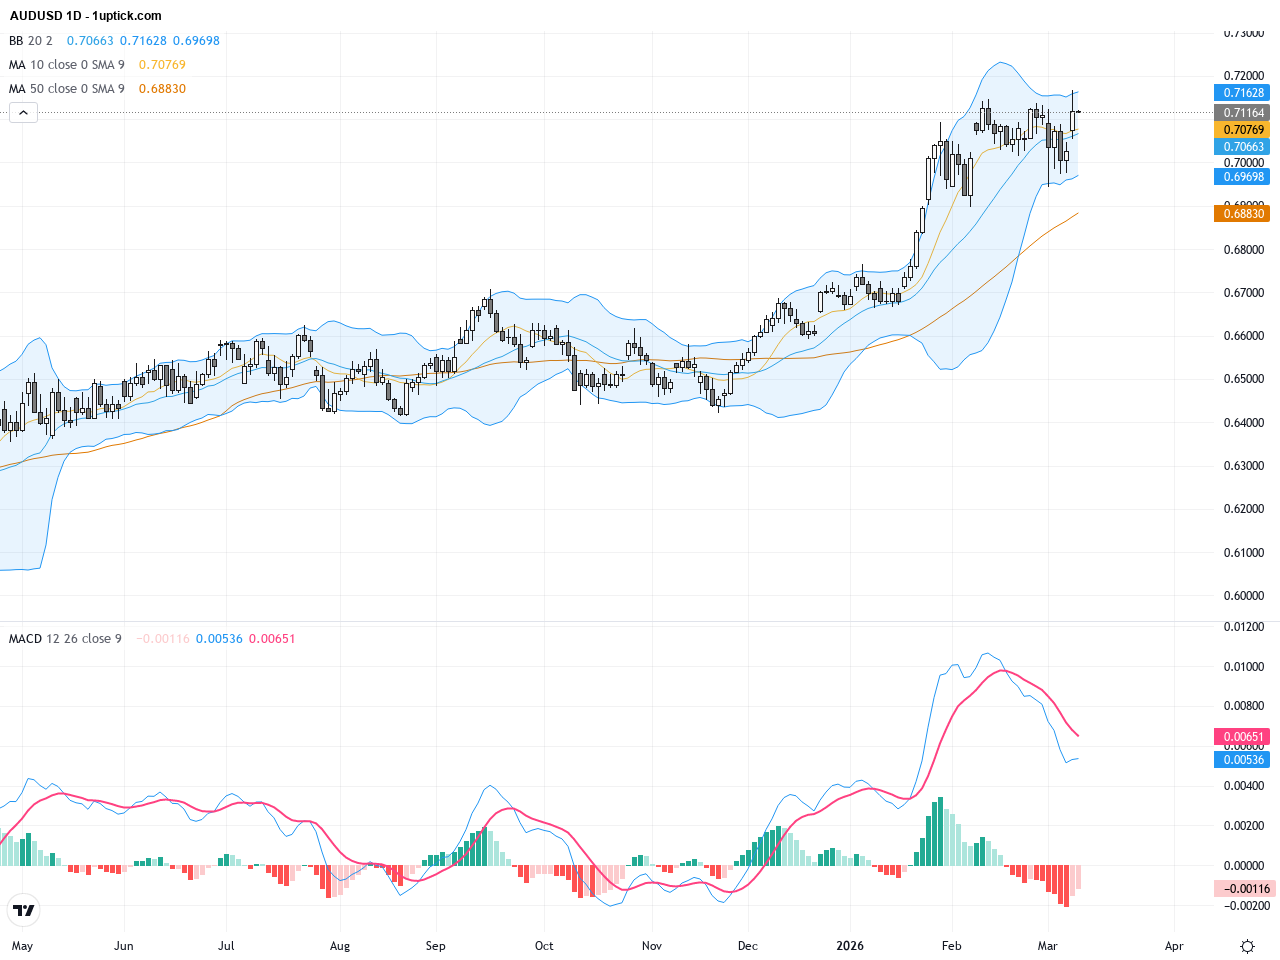
AUDUSD has experienced notable volatility over the past three trading sessions, with the pair closing near 0.70725 yesterday after retreating from a multi-year high of 0.7185 reached last week. Rising geopolitical tensions have strengthened the USD while sustaining expectations for further RBA rate hikes have pressured the AUD. This mix led to a short-term pullback fueled by risk aversion flows. For retail investors, this means heightened uncertainty and the need to carefully monitor evolving geopolitical and economic data impacting the Australian Dollar. Vigilance is key amid these shifting dynamics to navigate potential swings in the currency pair effectively.

XAUUSD Gold Price Outlook: Dollar Strength and Rate Cut Delays Cap Rally

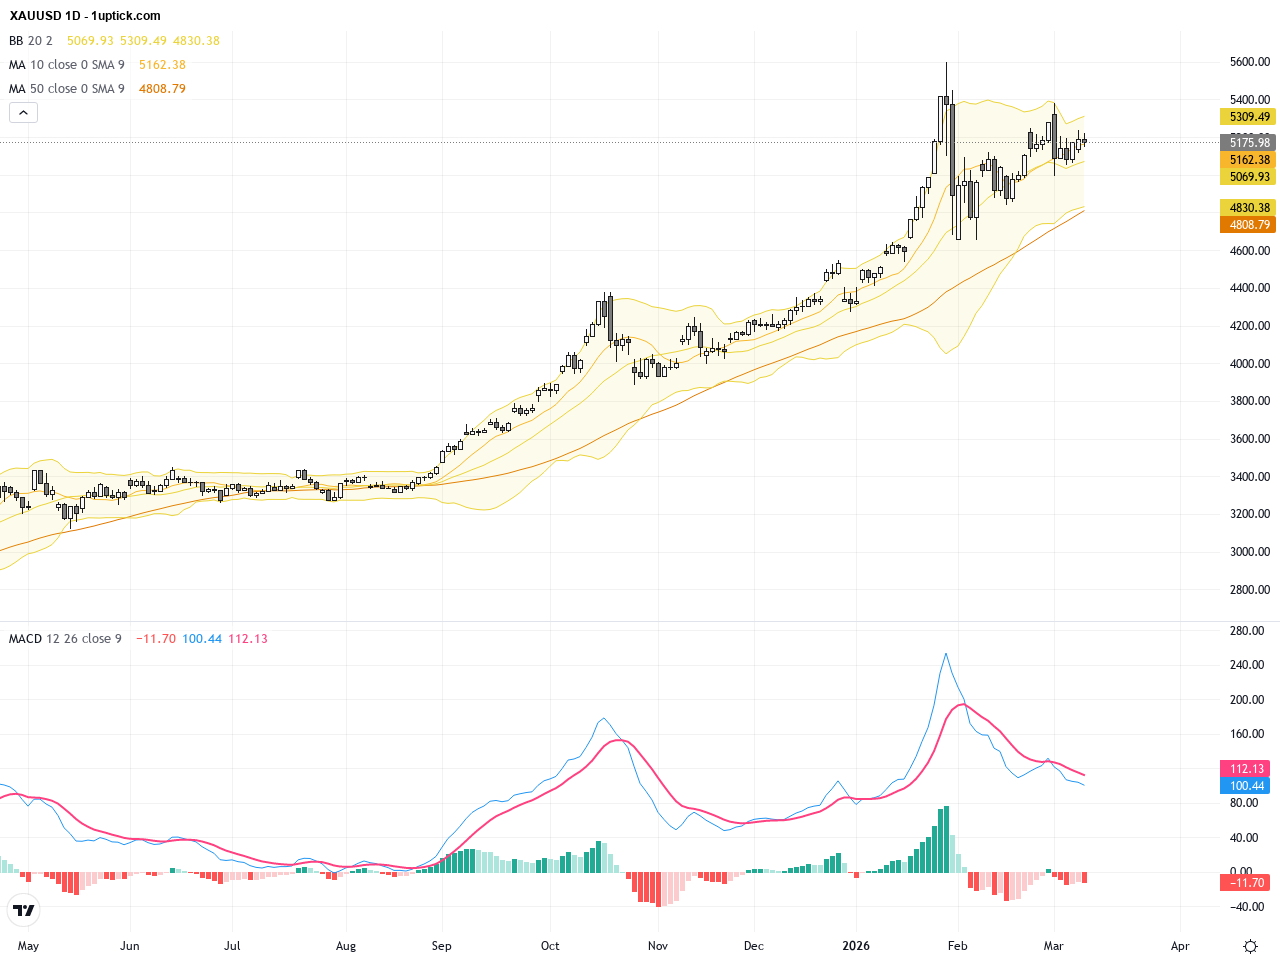
Over the past three trading days, XAUUSD gold prices witnessed significant volatility, falling from around 5192 on March 10th to close near 5081 on March 12th, reflecting the strong US dollar and rising Treasury yields weighing heavily on the metal. Market expectations for a delayed Fed rate cut further capped the upside momentum. The latest market news highlights that gold remains trapped near a critical pivot point, challenged by the dollar’s strength and rising oil prices. For everyday investors, this means gold is likely to remain range-bound in the short term, with safe-haven demand offering support but bearish forces still dominant. Our comprehensive technical and fundamental analysis provides clear insights into the XAUUSD trading outlook and key price levels to navigate the current market environment.

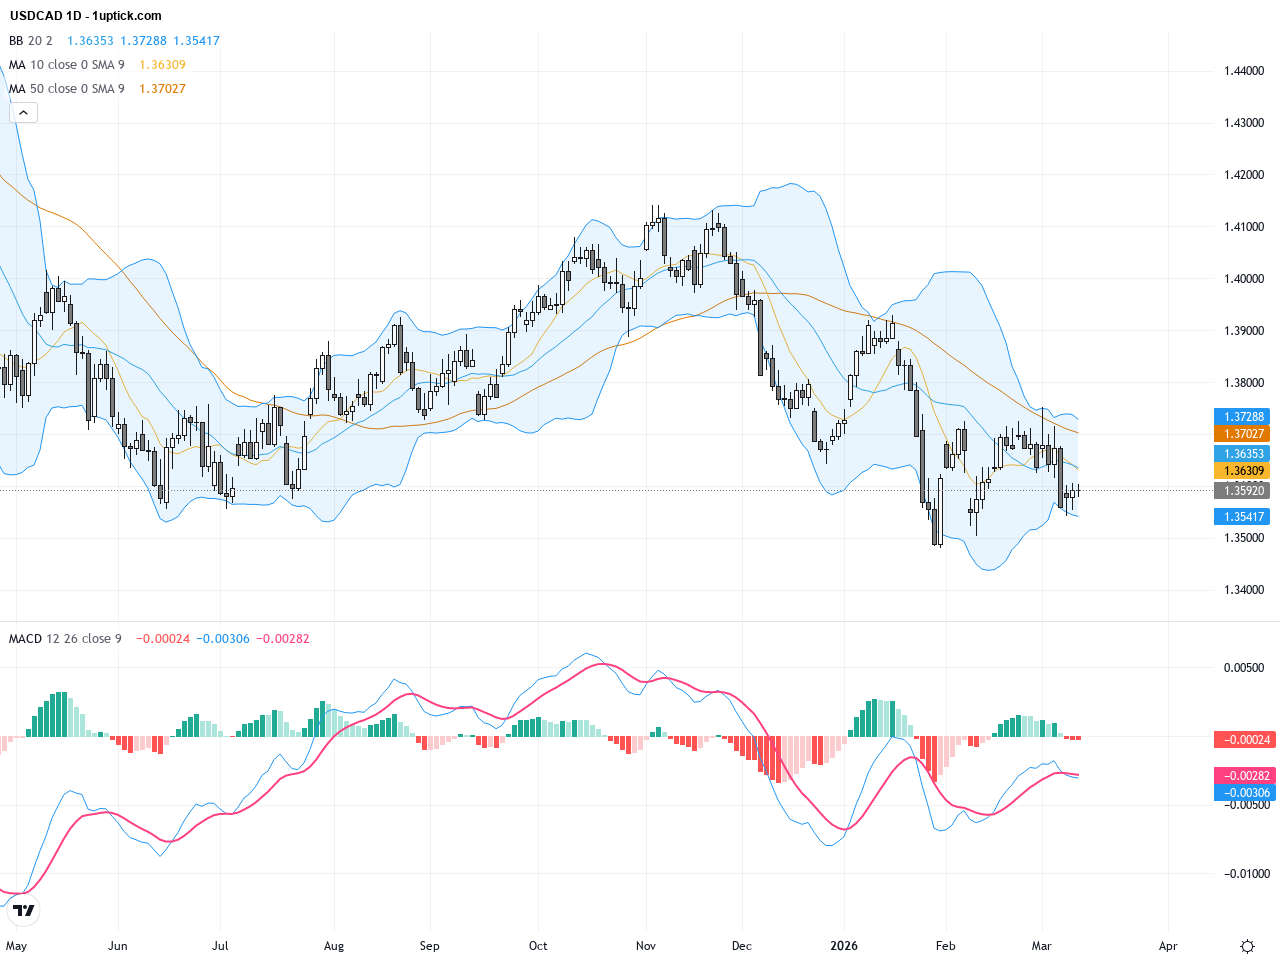
USDCAD: Oil Volatility and Dollar Strength Set the Stage for Key Support and Resistance Levels

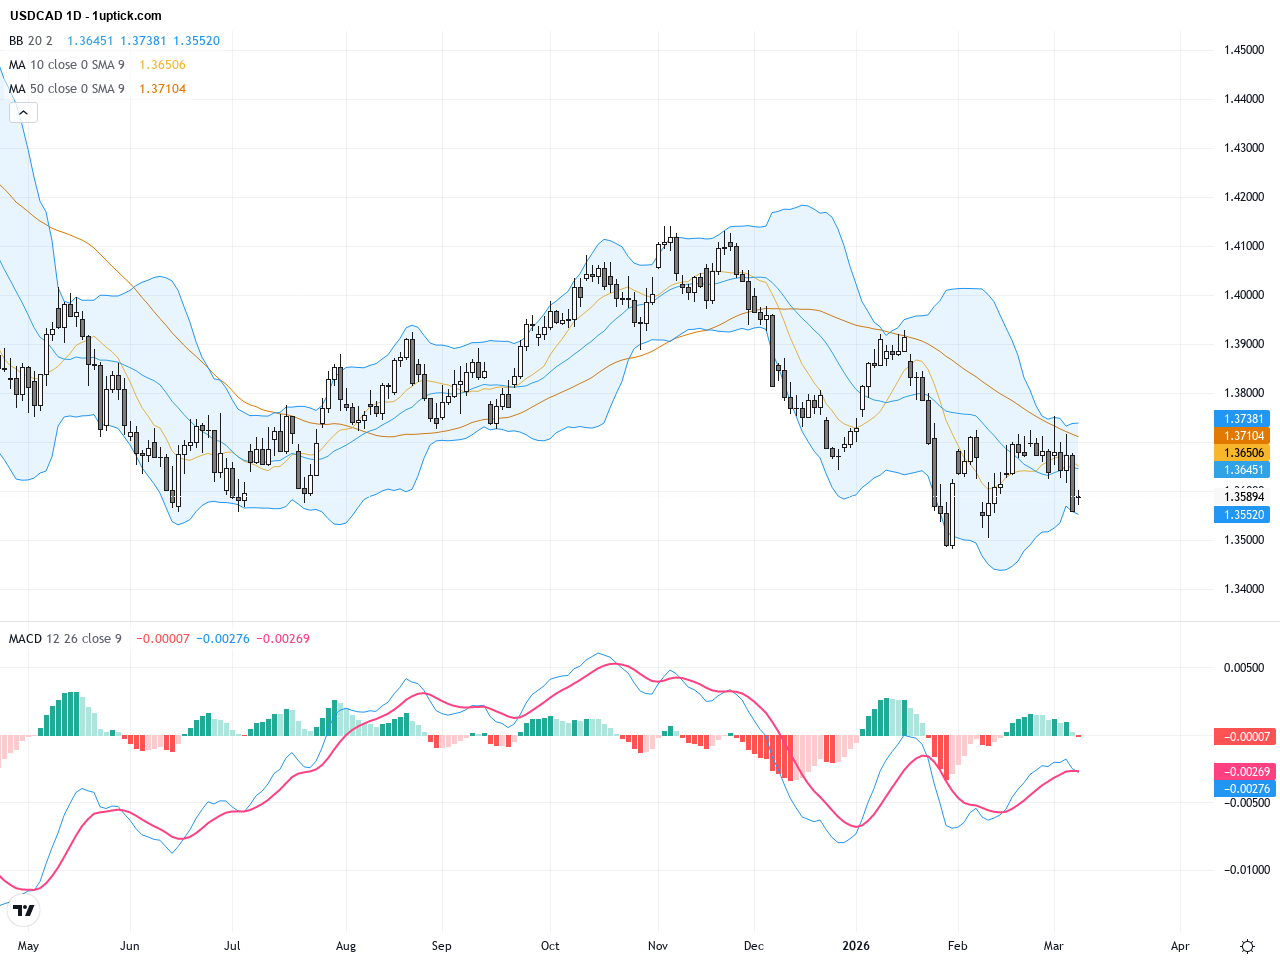
Over the past three trading days, USDCAD has witnessed volatile movement within the 1.3550 to 1.3600 range, closing yesterday at 1.3592. The pair is navigating a tug-of-war between surging oil prices and a rebounding US dollar. Market headlines emphasize that while oil prices have surged past $100 due to supply cuts, supporting the Canadian dollar, the US dollar’s rise fueled by strong US data and safe-haven demand has counterbalanced this effect. For investors, this dynamic signals near-term uncertainty in USDCAD price action, meaning traders should closely monitor key technical support and resistance levels to capitalize on upcoming opportunities.

WTI Crude Oil: Middle East Tensions Fuel Volatility as Triangle Pattern Emerges

Over the past three trading days, WTI Crude Oil displayed significant volatility, rising from around $62 at the end of February to nearly $120 before retreating to approximately $87 amid news of a historic oil reserve release and heightened tensions in the Middle East. The threat to oil shipments through the Strait of Hormuz remains the primary driver of market sentiment. For investors, this means that oil prices will continue to be influenced by supply risk and market balancing acts, resulting in sustained sensitivity. Analyzing the technical patterns on the charts can help project the next directional move.

XAUUSD Gold Breaks Key 5207.97 Resistance: Technical and Fundamental Trading Outlook

Over the past three trading sessions, XAUUSD has shown notable volatility, rising from a low near 5137.91 on March 9 to close around 5176.58 on March 11, with the critical resistance at 5207.97 drawing market attention. Recent market news highlights that oil nearing $100 and uncertainty around Fed rate cuts keep gold price rangebound. Despite USD strength and geopolitical pressures, gold benefits from expectations of potential rate cuts, maintaining a trading range between key support and resistance. For the average investor, this underscores gold’s continued appeal as a safe haven amid inflation and global risk concerns.

GBPUSD Technical & Fundamental Analysis: Key Resistance Holds Amid Bullish Consolidation

Over the past three trading days, GBPUSD has fluctuated around the 1.3400-1.3500 range, closing at 1.3454. The market mood was heavily influenced by Middle East geopolitical tensions and the US dollar’s strength fueled by inflation fears linked to a 25% oil price spike. The pound remains under pressure due to speculations of a possible UK interest rate cut in March. Currently, the price hovers near its 50-day and 200-day moving averages, indicating a technical consolidation phase. For investors, this is a waiting period ahead of key US CPI data and UK policy clarity, suggesting a potential directional breakout opportunity in the near term.

USDJPY: Key 158 Level Holds Amid Risk of Short-Term Technical Reversal

USDJPY has been consolidating around the 158 level amidst mixed influences from easing Middle East conflict and a weakening US dollar. Over the past three trading days, despite downward pressure on the dollar linked to hopes for de-escalation in Iran, safe-haven demand for the Japanese yen has kept USDJPY stable near 158.28. Investor sentiment remains highly uncertain amid geopolitical tensions and global trade concerns. This week’s conditions suggest heightened short-term volatility; traders should carefully monitor support and resistance levels and keep an eye on major economic releases that could sway the pair’s momentum further.

EURUSD Surges on Geopolitical Ease: Technical Patterns Signal Potential Rebound Momentum

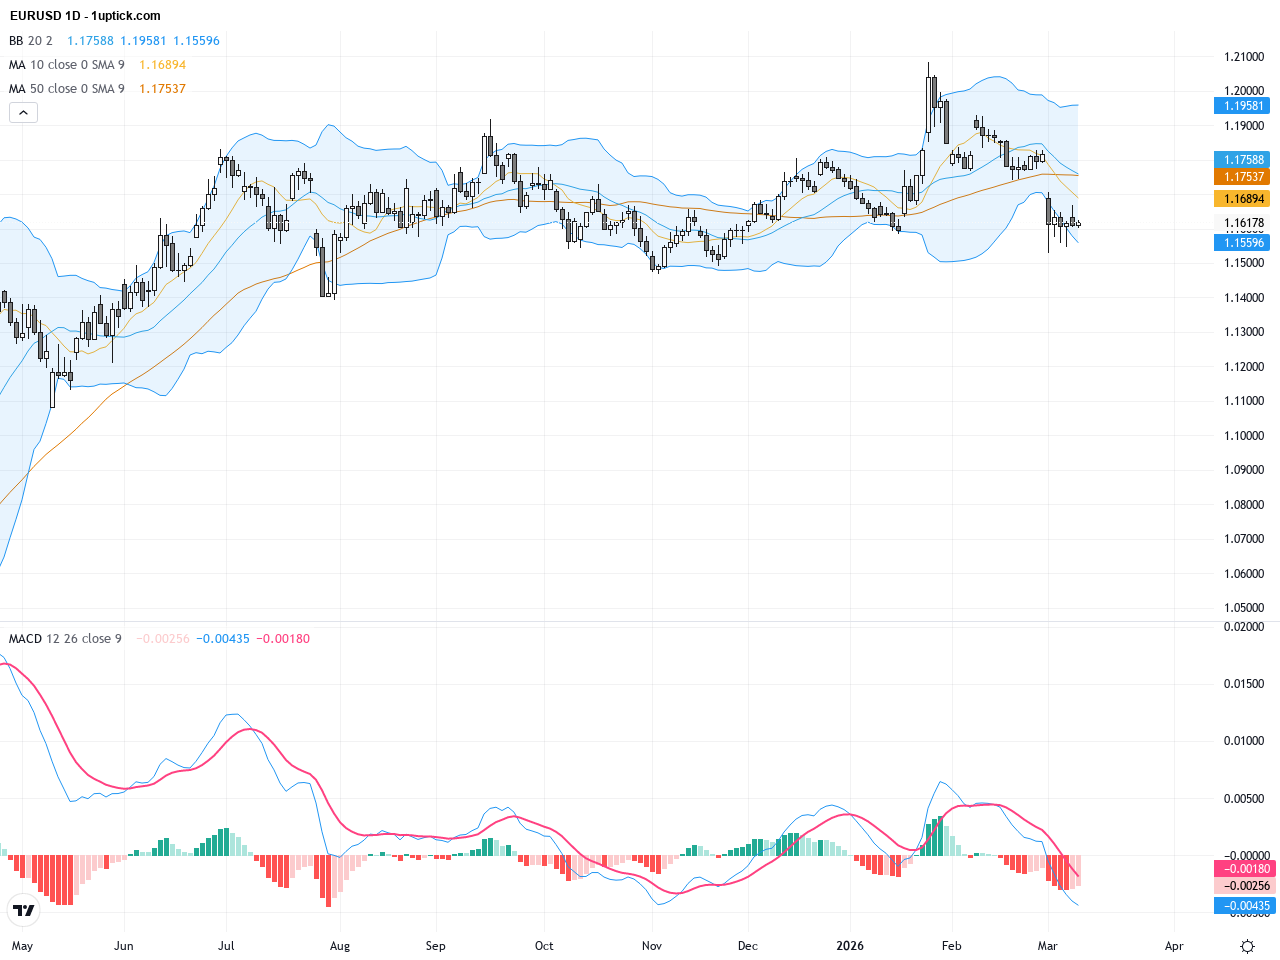
EURUSD has experienced notable volatility over the past three trading days, rallying more than 150 pips as geopolitical tensions eased, with the price currently hovering around 1.18289. Despite the US dollar’s strength supported by robust economic data, the euro is under pressure due to cooling inflation in the Eurozone and a critical test of the 1.1578 support level. For investors, this scenario reflects a short-term correction amid political relief and economic divergence between the US and Europe, suggesting key technical levels will dictate near-term price action. Upcoming US CPI data and ECB signals will be pivotal, framing the trading outlook for EURUSD in the days ahead.

AUDUSD: Multi-Year High Breakout at 0.7168 Signals Strong Trading Outlook

Over the past three trading days, AUDUSD has displayed strong bullish momentum, breaking through the multi-year high of 0.7168 and closing yesterday at 0.71164. The market is heavily influenced by the hawkish stance of the Reserve Bank of Australia (RBA) and a widening interest rate differential against the U.S. dollar, alongside mixed geopolitical risk aversion dynamics. Recent news highlights a bullish base forming at the 20-day moving average, pointing toward potential targets at 0.7200 and beyond. For everyday investors, it’s like a stock rally pushing through key resistance levels, signaling increased risk appetite but with caution needed below 0.7100 level that could trigger a pullback. Overall, the AUDUSD trading atmosphere is optimistic but warrants close monitoring of upcoming economic data and geopolitical events.

USDCAD: Oil Surge Pressures USD as Technical Patterns Signal Bearish Momentum

Over the past three trading days, USDCAD has experienced a steady decline from a recent high near 1.3660, closing yesterday at 1.35894. A sharp rise in oil prices above the $100 mark has strengthened the Canadian dollar, putting downward pressure on the pair. Additionally, weaker-than-expected U.S. employment data weighed on the U.S. dollar, further supporting the Loonie. The market’s mood this week is influenced by shifts in risk appetite and supply concerns in the energy market, key drivers of USDCAD volatility. For investors, this means a diminishing appeal of the U.S. dollar against the Canadian dollar in the near term, with oil prices and U.S economic data remaining critical to watch in shaping the trading outlook.

1uptick Analytics @

Risk Warning​

*Investment involves risk. You may use the information, strategies and trading signals on this website for academic and reference purposes at your own discretion. 1uptick cannot and does not guarantee that any current or future buy or sell comments and messages posted on this website/app will be profitable. Past performance is not necessarily indicative of future performance. It is impossible for 1uptick to make such guarantees and users should not make such assumptions. Readers should seek independent professional advice before executing a transaction. 1uptick will not solicit any subscribers or visitors to execute any transactions, and you are responsible for all executed transactions.

© 2022-26 1uptick Analytics all rights reserved.


Risk Warning​

*Investment involves risk. You may use the information, strategies and trading signals on this website for academic and reference purposes at your own discretion. 1uptick cannot and does not guarantee that any current or future buy or sell comments and messages posted on this website/app will be profitable. Past performance is not necessarily indicative of future performance. It is impossible for 1uptick to make such guarantees and users should not make such assumptions. Readers should seek independent professional advice before executing a transaction. 1uptick will not solicit any subscribers or visitors to execute any transactions, and you are responsible for all executed transactions.

© 1uptick Analytics all rights reserved.

Home
.AI
Analysis
Calendar
Tools