


 |
| Gold V.1.3.1 signal Telegram Channel (English) |

GBPUSD: GBP/USD Faces Resistance at 1.3600 as Rally Pauses near Key Fibonacci Level
2026-04-17 @ 13:01
Over the past 24 to 48 hours, the GBP/USD pair experienced notable volatility, drifting slightly from yesterday’s close of 1.3522 to hover around 1.3545. The pair made an attempt to break above the key 61.8% Fibonacci retracement level at 1.3600 but lacked momentum to sustain gains, reflecting a tug-of-war between bulls and bears.
Market focus has centered on several economic and geopolitical developments, notably the headlines that the “GBP/USD rally halts near the 1.3600 Fibonacci level” and the “US dollar slides to a six-week low amid renewed US-Iran talks.” The weakening US dollar amidst hopes of peace in the Middle East and a possible pause in Federal Reserve rate hikes has bolstered the pound’s appeal.
Meanwhile, reassessment of the Bank of England’s policy stance also shifted market sentiment toward a bullish outlook on sterling. Despite uncertainties stemming from war risks and UK energy challenges, the pound’s ability to hold above the critical 1.35 level highlights resilient buyer support, offering confidence for the medium to long term.
For everyday investors, the recent forex action underscores the importance of global political dynamics and central bank policies shaping currency moves. The positive momentum for GBP presents opportunities, but caution remains warranted as the dollar could still rebound. Staying agile and adjusting portfolio exposure accordingly is key in this evolving landscape.
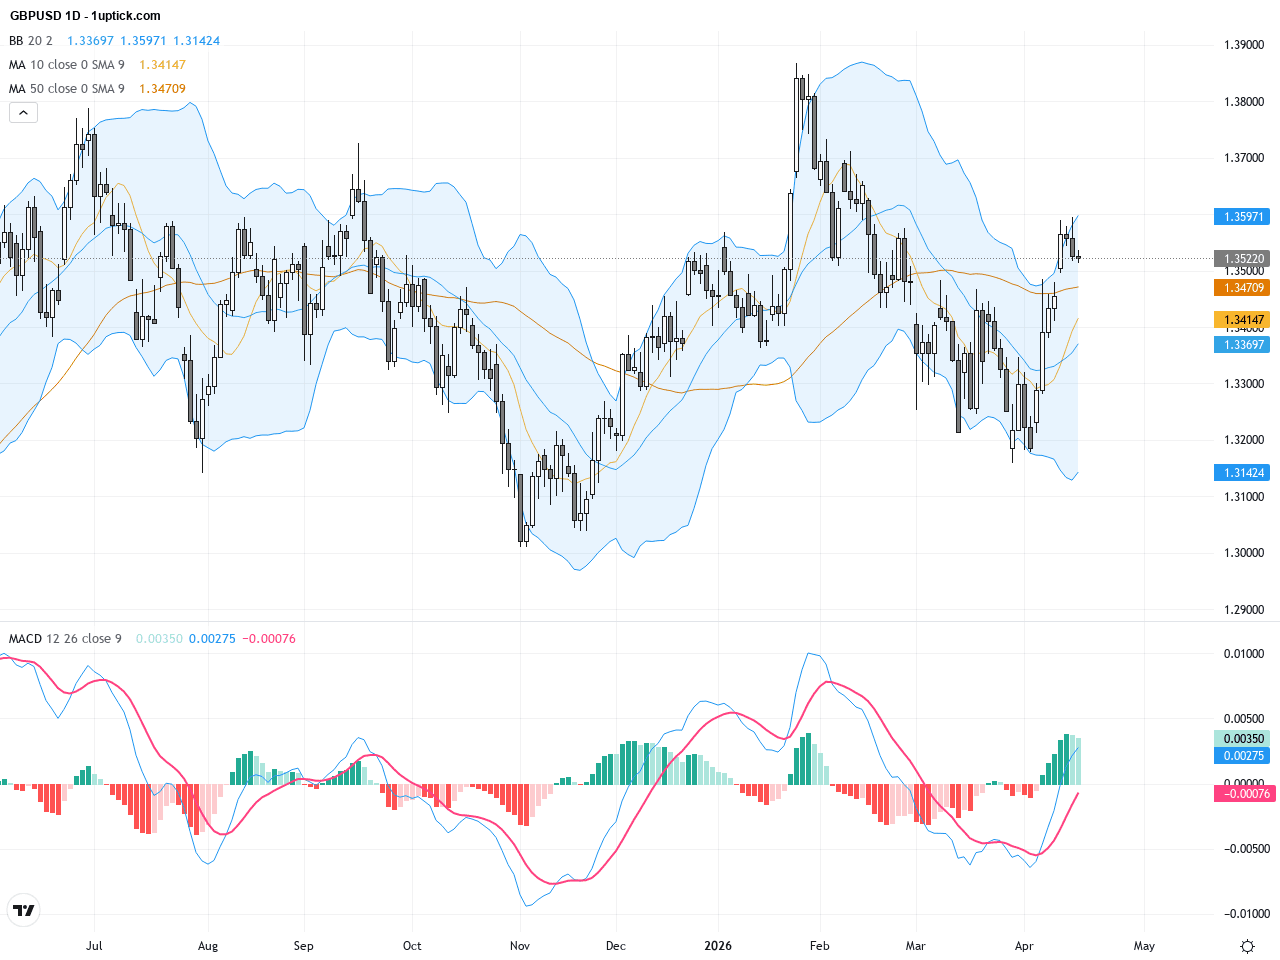
The GBPUSD daily chart depicts a steady upward trend since early 2026, with recent price action breaking above the 50-day and 200-day moving averages, confirming a bullish macro structure. The 1.3600 area, coinciding with the 61.8% Fibonacci retracement, acts as a significant resistance zone that the price has struggled to surpass. Bollinger Bands show contraction, signaling reduced volatility. The MACD histogram is narrowing but remains positive, indicating diminishing but still prevailing bullish momentum. The prevailing trend leans bullish, but a failure to break the resistance may trigger a corrective pullback. A successful breakout above this level could pave the way to retest the yearly high near 1.3868.
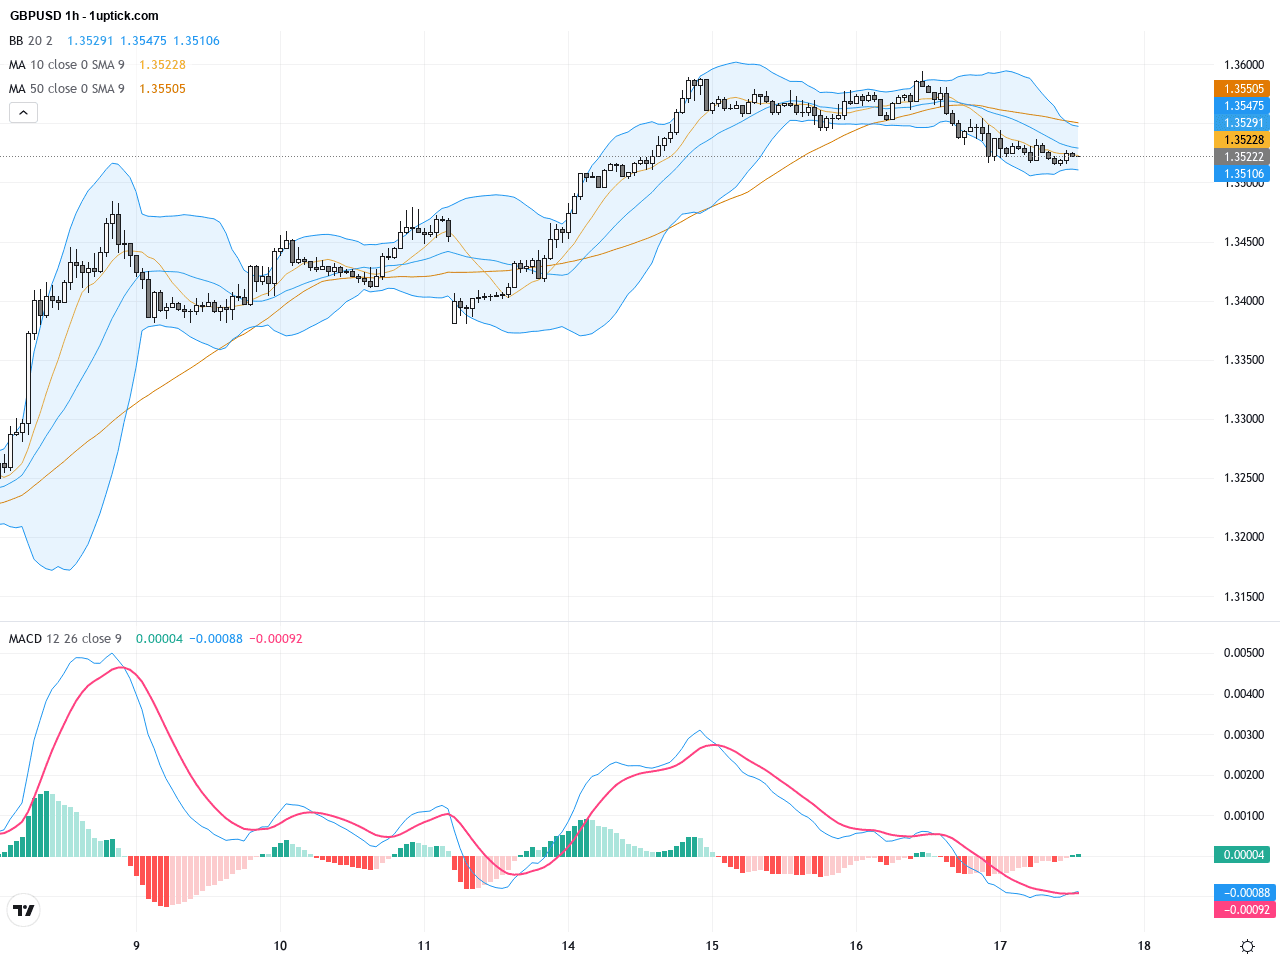
On the hourly timeframe, GBPUSD has formed an ascending triangle pattern over the last 3-5 days, reflecting buyers concentrating near the 1.3600 resistance. Short-term moving averages show bullish crosses supporting upward momentum. The MACD recently formed a minor bullish crossover, suggesting potential for a near-term breakout. However, the RSI is approaching overbought territory, cautioning that momentum may soon slow, possibly leading to short-term consolidation. Price has been oscillating between 1.3520 and 1.3600, and a clear break and close above 1.3600 on the hourly chart will likely trigger a continuation of the uptrend.
Technical Trend: Consolidation with bullish bias
Technically, GBPUSD has confirmed a structural breakout on the daily chart, signaling a bullish medium-term trend. Near-term price action is consolidating under the 1.3600 resistance zone, with MACD poised for an upward crossover that may mark renewed bullish momentum. The hourly ascending triangle also supports the continuation pattern suggesting a higher probability for an upside breakout. Key levels around 1.3600 remain critical to watch. Traders should consider waiting for confirmed breakout signals before entering new long positions to manage risk effectively. Fundamental factors including Bank of England policy signals and geopolitical developments continue to add directional uncertainty in the short term.Today’s economic calendar shows no significant data releases directly impacting GBPUSD. European trade balance and current account figures will be announced in the morning, but forecasted changes are expected to be modest with limited market impact. The US has no major economic data today, but several FOMC members are scheduled to speak. Market participants will monitor comments for any hints on future monetary policy stance. Overall, no major events today are expected to drastically move the GBPUSD pair, with price action more likely guided by technical factors and prevailing global risk sentiment.
Resistance & Support

The above financial market data, quotes, charts, statistics, exchange rates, news, research, analysis, buy or sell ratings, financial education, and other information are for reference only. Before making any trades based on this information, you should consult independent professional advice to verify pricing data or obtain more detailed market information. 1uptick.com should not be regarded as soliciting any subscriber or visitor to execute any trade. You are solely responsible for all of your own trading decisions.