


 |
| Gold V.1.3.1 signal Telegram Channel (English) |

AUDUSD: Critical Triangle Breakout and Dollar Strength Define Trading Outlook, May 15, 2026
2026-05-15 @ 06:01
Over the past 48 hours, the Australian Dollar against the US Dollar (AUD/USD) has experienced notable fluctuations, catching the attention of market traders. Closing yesterday at 0.72203, down slightly from the previous close of 0.72585, this reflects a mild pullback near recent highs. The US Dollar extended gains for the fourth consecutive day, driven by hotter than expected inflation data and fading expectations for Federal Reserve rate cuts, which served as a major headwind for AUD/USD.
Moreover, the highly anticipated US-China summit yielded no concrete breakthroughs, adding to market uncertainty and weighing on the Australian Dollar. While expectations had been high for the summit to boost AUD/USD, the lack of substantive outcomes prevented sustained upward momentum. Investors are also focusing on the Reserve Bank of Australia’s interest rate stance, with rising oil prices and a slowing Chinese recovery influencing the currency pair’s outlook.
For the average investor, this means the AUD/USD exchange rate is currently sensitive to a blend of international political and economic factors. The US Dollar’s strong rebound increases downside risks for the Australian Dollar amid unclear US-China relations and uncertain global recovery momentum. Investors should closely monitor US inflation trends and economic developments in China as these will be key drivers of AUD/USD performance in the near term.
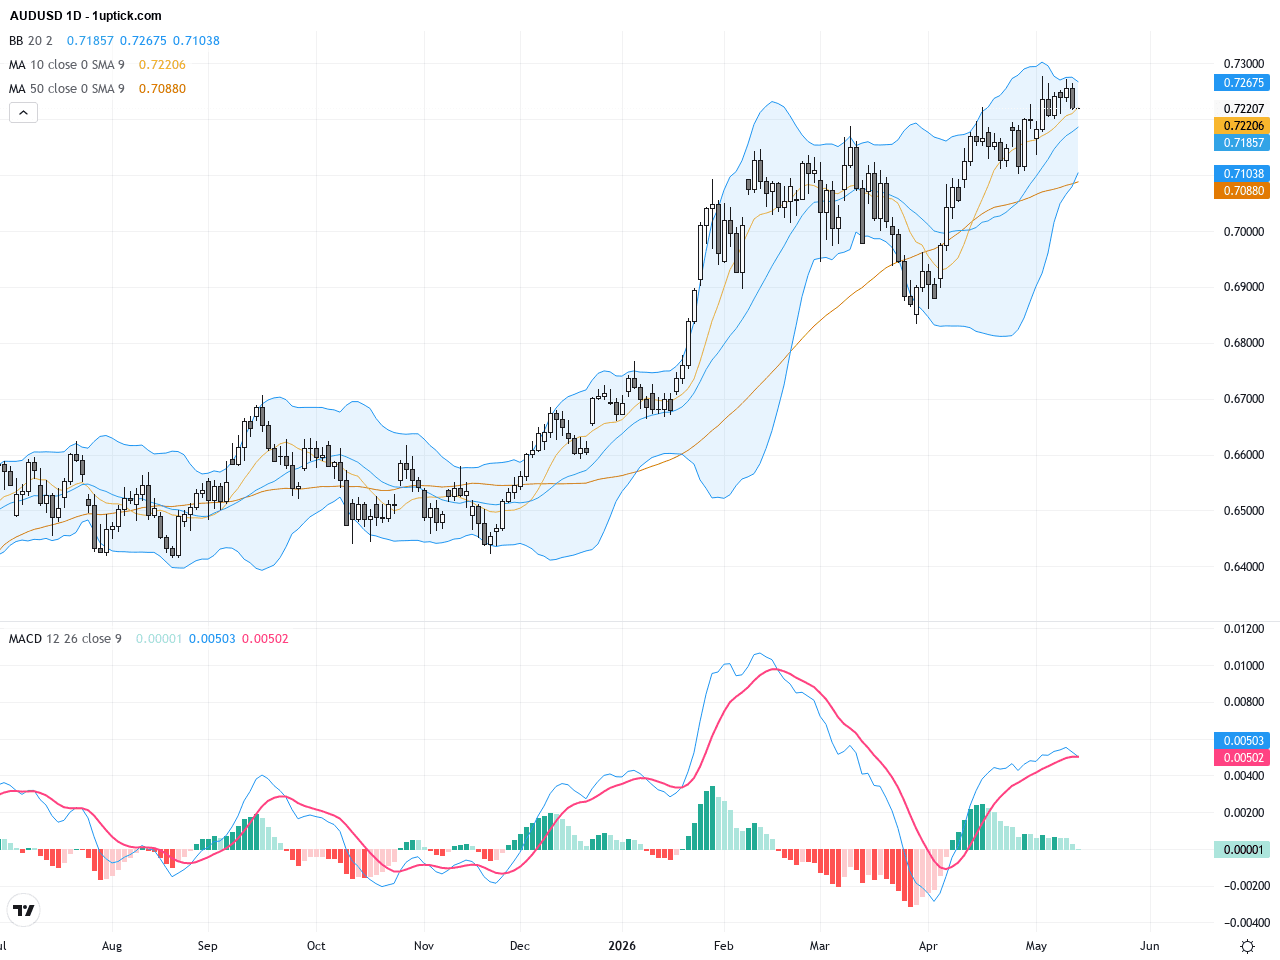
The daily chart shows a clear uptrend for AUDUSD since the start of the year, with higher highs and higher lows firmly established, confirming a strong bullish market. The price touches the upper Bollinger Band, suggesting possible short-term overextension. MACD remains positive but is showing signs of momentum slowing down. The 200-day and 100-day moving averages provide sturdy support beneath the price, reinforcing the long-term bullish structure. A dominating ascending triangle pattern has been forming since early April, indicating a potential strong breakout ahead, although a slight pullback has occurred recently.
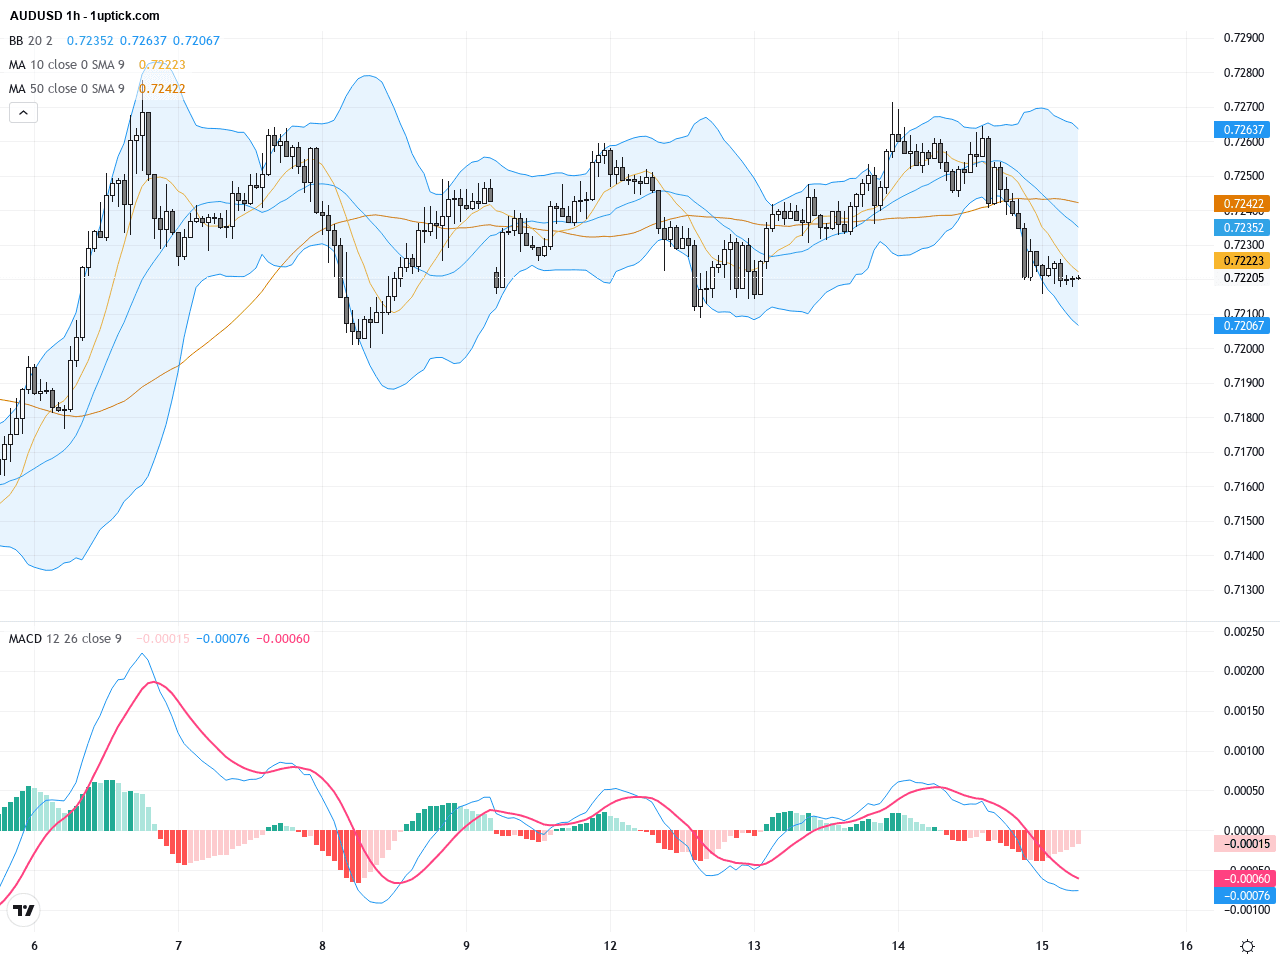
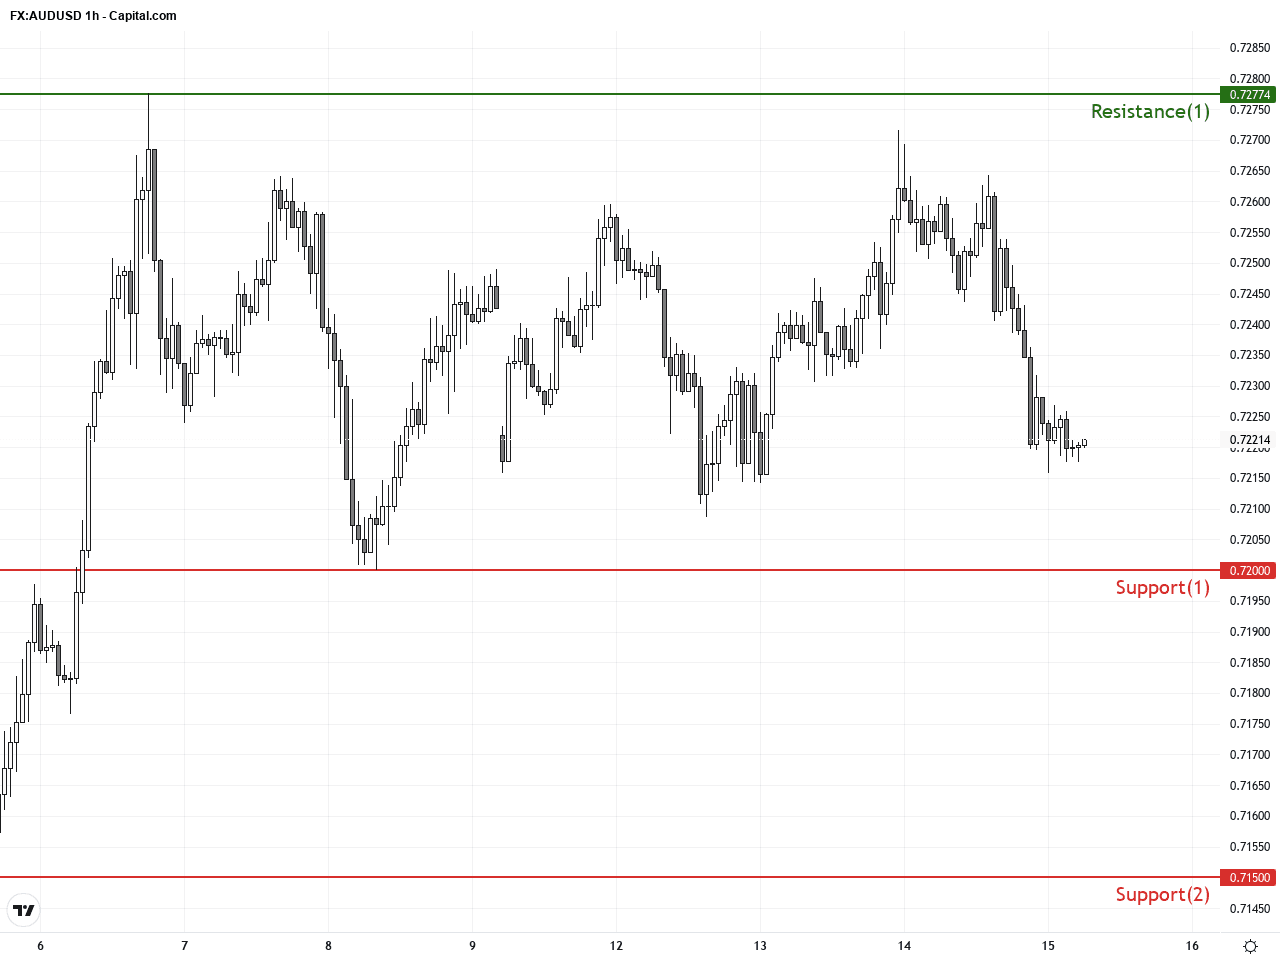
The hourly chart over the last 3-5 days reveals short-term consolidation with prices retreating from around 0.726 to 0.720, aligning with yesterday’s close of 0.72203. The short-term moving averages have witnessed a bearish crossover, signaling increasing selling pressure. MACD histogram contraction and Bollinger Band squeeze indicate diminishing volatility and a potential upcoming breakout. A significant bearish engulfing candlestick has emerged, suggesting the possibility of continued downside pressure in the next 24 hours. Traders should watch key support zones for reaction.
Technical Trend: Cautiously bullish with short-term correction
AUDUSD is technically forming a well-defined ascending triangle, reflecting a predominantly bullish longer-term structure. However, the proximity to the upper Bollinger Band and recent bearish engulfing pattern on the hourly chart indicate momentum has waned in the near term, with short-term retracement likely. MACD crossovers and moving average behaviors provide actionable signals for trade entries and exits. While the three key moving averages hold firm as support, the strong USD remains a limiting factor. Cautious traders should await a clear breakout or breakdown confirmation before committing to directional trades.Today’s GMT+1 economic calendar shows no major direct events impacting AUDUSD. Key scheduled events include speeches from multiple Fed officials overnight (HK time) which could briefly influence USD volatility. UK economic data including robust March GDP and industrial production figures may indirectly affect USD strength. However, absence of Australian data indicates AUD movement will largely hinge on USD trends and global risk sentiment. Traders should monitor Fed communications closely for cues that might affect dollar positioning and AUDUSD price action.
Resistance & Support
The above financial market data, quotes, charts, statistics, exchange rates, news, research, analysis, buy or sell ratings, financial education, and other information are for reference only. Before making any trades based on this information, you should consult independent professional advice to verify pricing data or obtain more detailed market information. 1uptick.com should not be regarded as soliciting any subscriber or visitor to execute any trade. You are solely responsible for all of your own trading decisions.