
 |
| Gold V.1.3.1 signal Telegram Channel (English) |
USDCAD: Key 50% Fibonacci Resistance at 1.3755 Emerges as Crucial Trading Barrier, May 19, 2026
2026-05-19 @ 13:01
Over the past 24 to 48 hours, the USD/CAD exchange rate has exhibited mild fluctuations, hovering near yesterday’s closing price of 1.37519. Influenced by economic data from the US and Canada as well as geopolitical developments, the market has maintained a cautious stance, resulting in no major breakout, with highs reaching 1.37528 and lows dipping to 1.37321.
The most notable recent driver has been the risk-off sentiment affecting the USD and CAD movements, especially against the backdrop of unresolved US-China trade and diplomatic tensions. This has lent some support to the US dollar. Meanwhile, with upcoming Federal Reserve and Bank of Canada meetings, investors have adopted a wait-and-see approach, dampening volatility.
For the average investor, this currency movement signals a market in a state of uncertain transition—like walking on a slightly uneven path, with minor bumps but no sudden drops or spikes. Caution is advised, with close attention to potential central bank policy cues and international events. In the short term, USD/CAD is likely to stay relatively stable but investors should remain prepared for sudden moves triggered by breaking news.

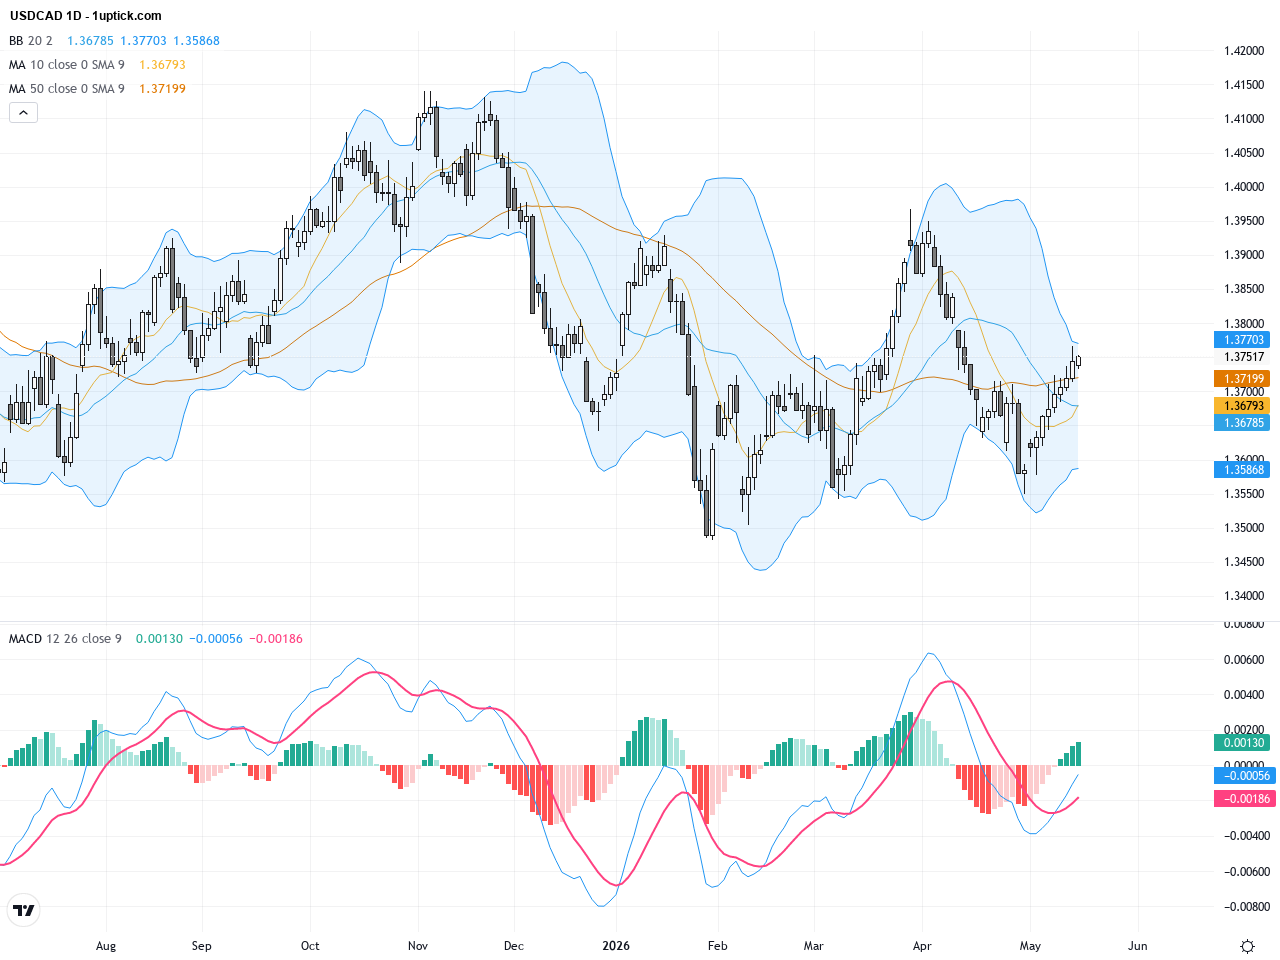
The daily chart of USDCAD shows a downtrend from the year’s high of 1.41405, with prices consolidating between 1.348 and 1.380. The 50-day moving average at approximately 1.3748 is slightly below the 200-day moving average at 1.3810, suggesting a mildly bearish bias. Bollinger Bands are contracting, indicating reduced volatility. The MACD hovers near the zero line without clear momentum bias. The daily trend remains range-bound, testing the 50% Fibonacci resistance repeatedly; failure to break above may see a renewed downward move.
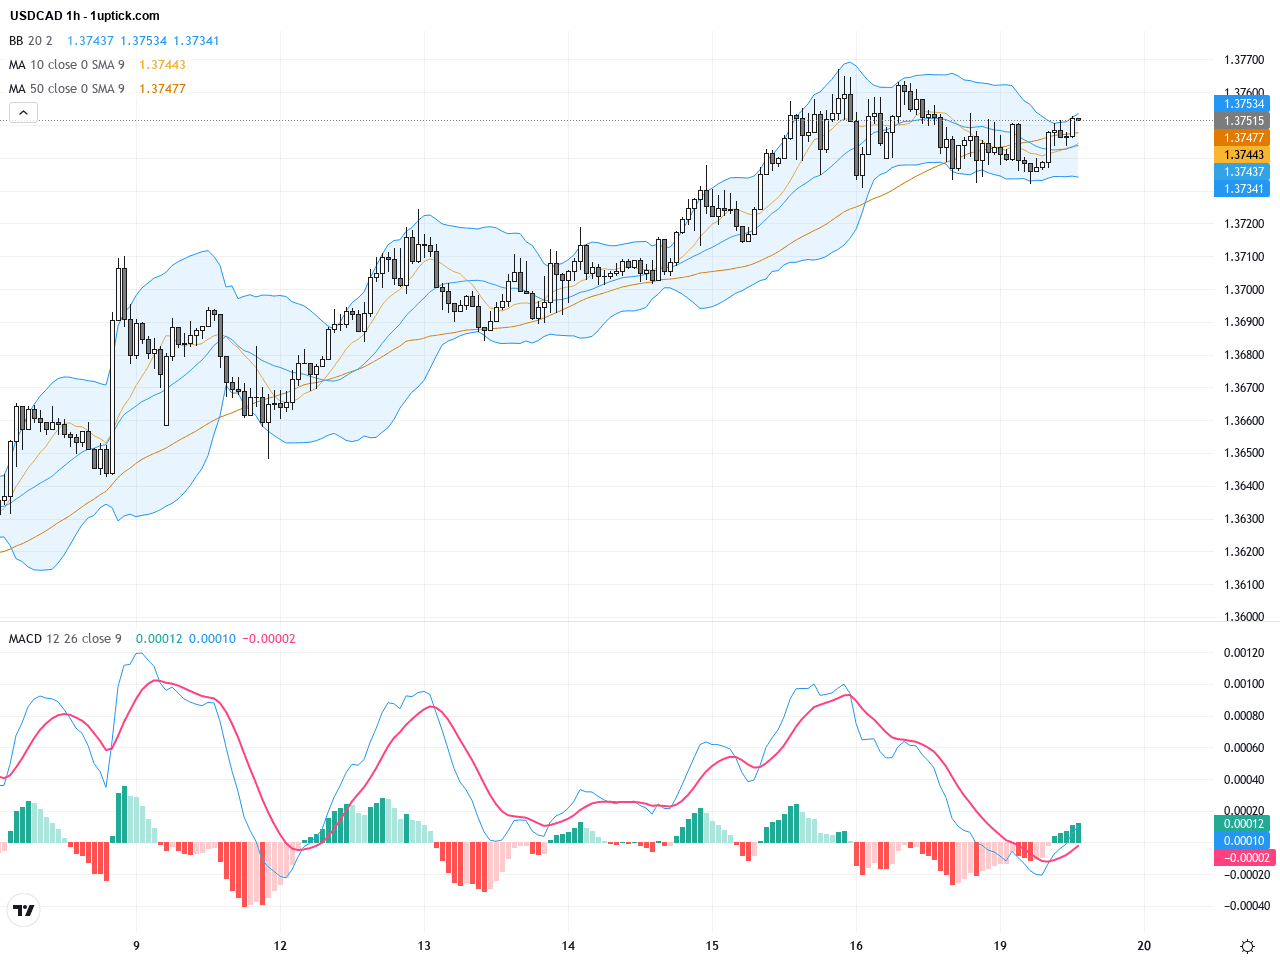
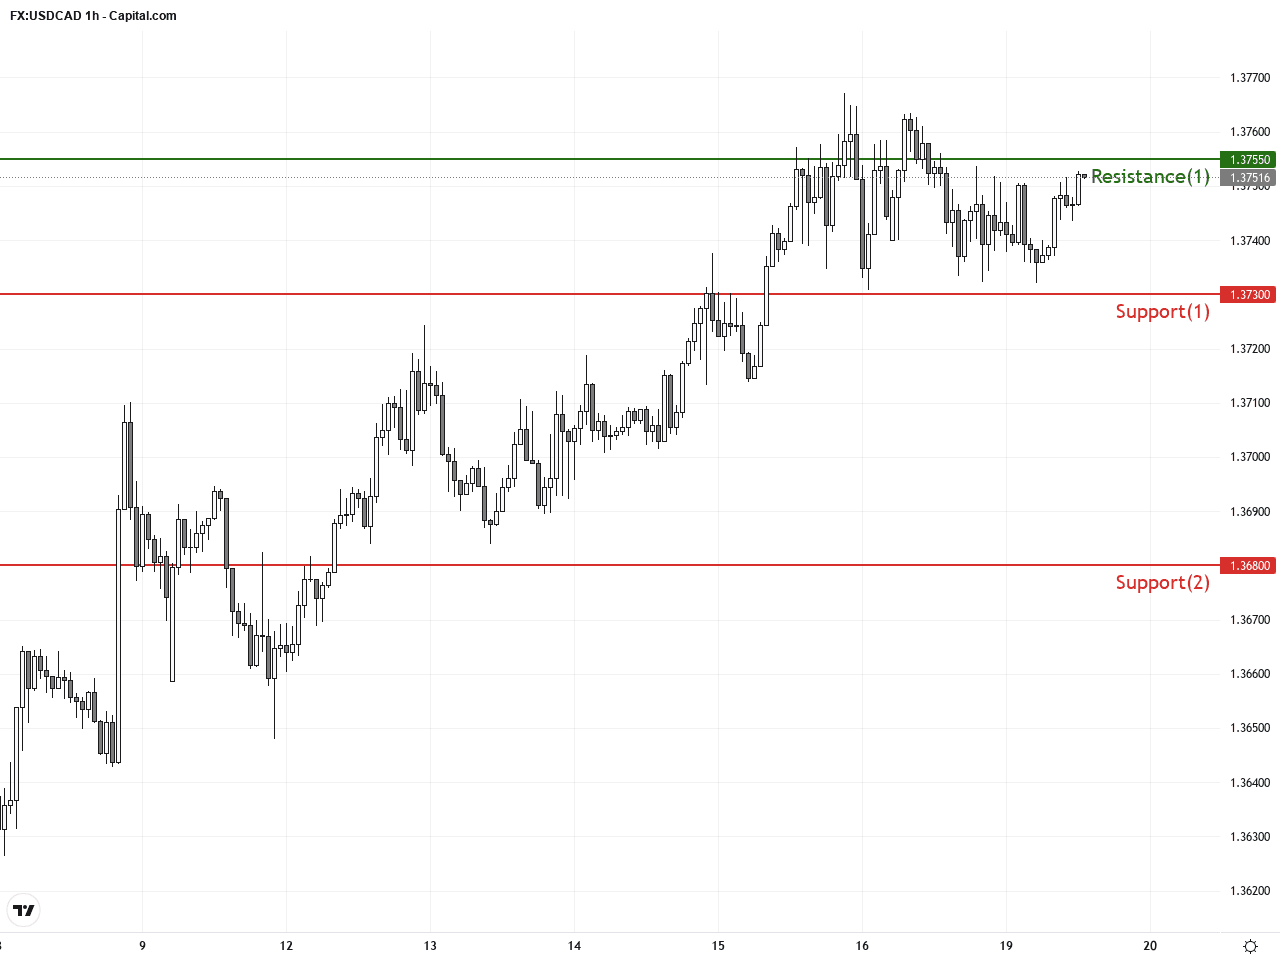
On the hourly chart, USDCAD has shown mostly a sideways to slightly bearish movement over the past 3-5 days, finding support around 1.3730 but repeatedly challenged at the 1.3755 resistance area. A golden cross formed by the 50-hour over the 200-hour moving averages indicates building short-term bullish momentum. The MACD is bullish while Bollinger Bands indicate increased volatility. A small bullish flag pattern suggests a potential breakout scenario if volume supports it.
Technical Trend: The current USDCAD trend is cautiously consolidative with emerging short-term bullish momentum but overall remains range-bound and volatile.
Technically, USDCAD shows a balance of forces with a pivotal resistance at the 1.3755 Fibonacci level. Daily chart momentum is subdued, but the hourly chart’s golden cross and positive MACD momentum hint at a short-term bullish shift. The recent hammer candlestick pattern provides a strong signal of support holding and potential for near-term upside over the next 24 hours, especially if volume expands to confirm the move.Today’s (GMT+1) economic calendar features no major U.S. or Canadian releases during the trading session until the afternoon, when key Canadian inflation data — Consumer Price Index (CPI) and Core CPI — will be released at 14:30. These figures are crucial for USDCAD trading, as higher-than-expected CPI would likely boost USD strength and push USDCAD higher, while a softer CPI could weaken the pair. Other events, such as FOMC member speeches, have limited direct impact today.
Resistance & Support
The above financial market data, quotes, charts, statistics, exchange rates, news, research, analysis, buy or sell ratings, financial education, and other information are for reference only. Before making any trades based on this information, you should consult independent professional advice to verify pricing data or obtain more detailed market information. 1uptick.com should not be regarded as soliciting any subscriber or visitor to execute any trade. You are solely responsible for all of your own trading decisions.