


 |
| Gold V.1.3.1 signal Telegram Channel (English) |
USDJPY Breaks Above 160: Yen Intervention Warning Sparks Technical and Fundamental Surge, May 1, 2026
2026-05-01 @ 21:28
Over the past 24 to 48 hours, the USD/JPY market has exhibited significant volatility. The pair closed yesterday at 157.216, reflecting a modest rise of 0.654 points or about 0.42% from the previous close of 156.562. Market sentiment was shaped by multiple factors, including strong intervention warnings from the Japanese government regarding exchange rate volatility and subtle shifts in the Federal Reserve’s policy stance.
Tokyo authorities issued stern warnings about the rapid appreciation of the yen and hinted at possible intervention to support the currency, prompting a swift surge in the yen which then eased slightly but remained elevated. Nonetheless, the USD/JPY breached a 21-month high, reaching an intraday level of 160.67, underscoring the dollar’s overall resilience, partly driven by the Fed’s relatively hawkish posture.
For the average investor, this swing represents a tug-of-war between the dollar and yen. Japan’s intervention warnings aim to curb excessive yen strength, which could hurt Japanese exporters’ competitiveness, while solid US economic data and rate policy support push the dollar higher, leading to ongoing currency fluctuations. Going forward, investors should watch closely for actual interventions from Japan to manage the yen’s strength, and keep an eye on the Fed’s rate policy for clues on future dollar momentum.

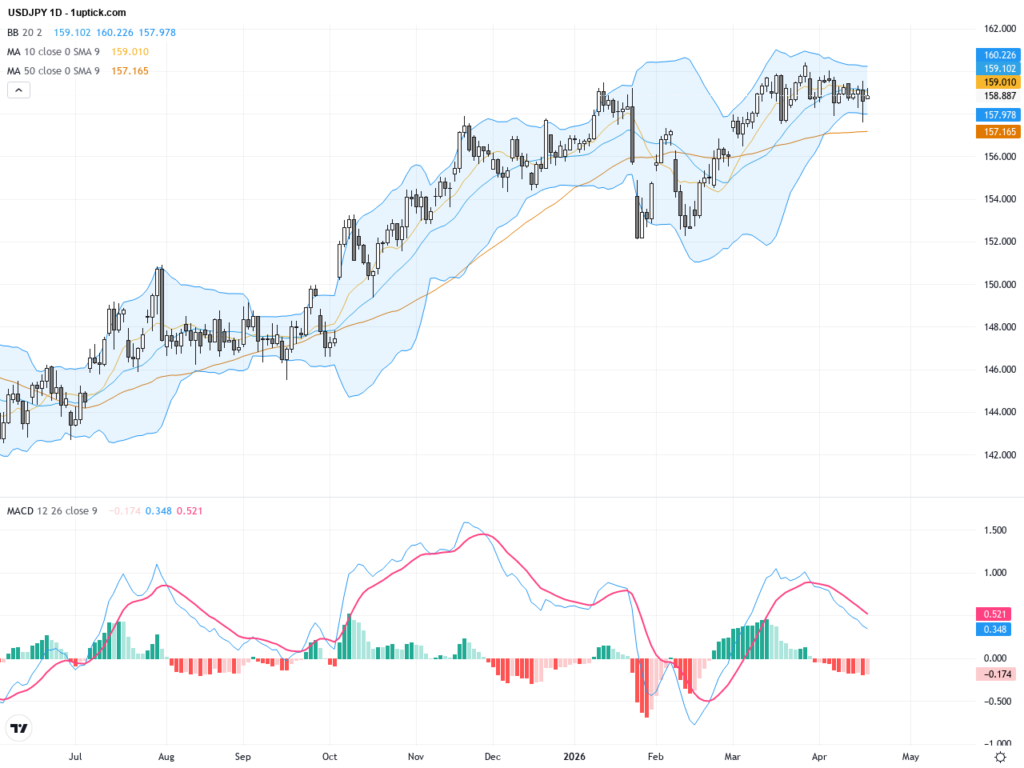
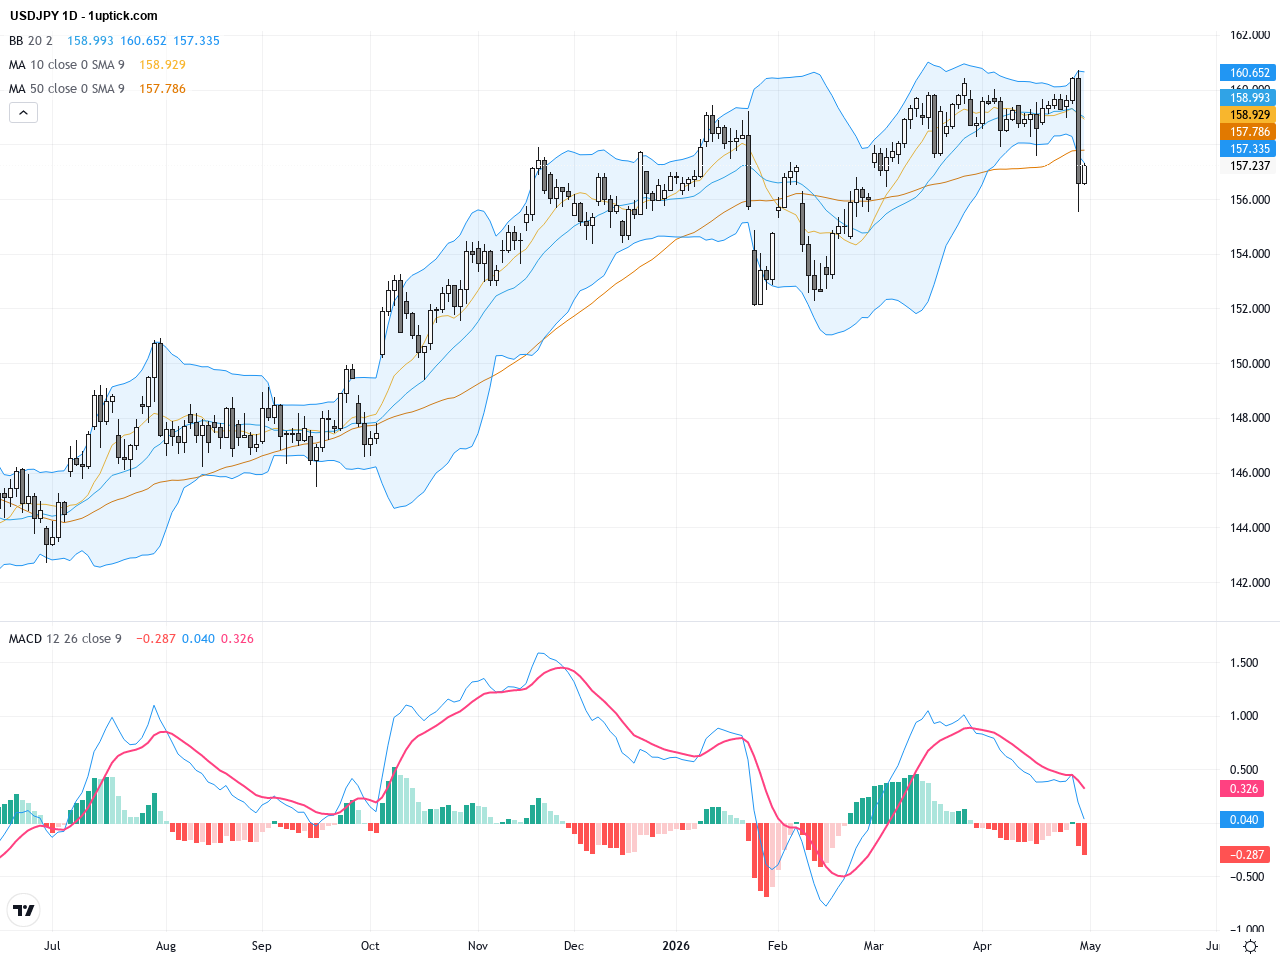
The daily chart for USDJPY shows a robust upward trend since early this month, with prices consistently closing above the key 160 resistance, riding the upper Bollinger Band which signals strong bullish momentum. The MACD remains positive and is widening, while the short and medium-term moving averages align bullishly. This technical setup reflects the fundamental reaction to the yen intervention risk and Fed policy dynamics.
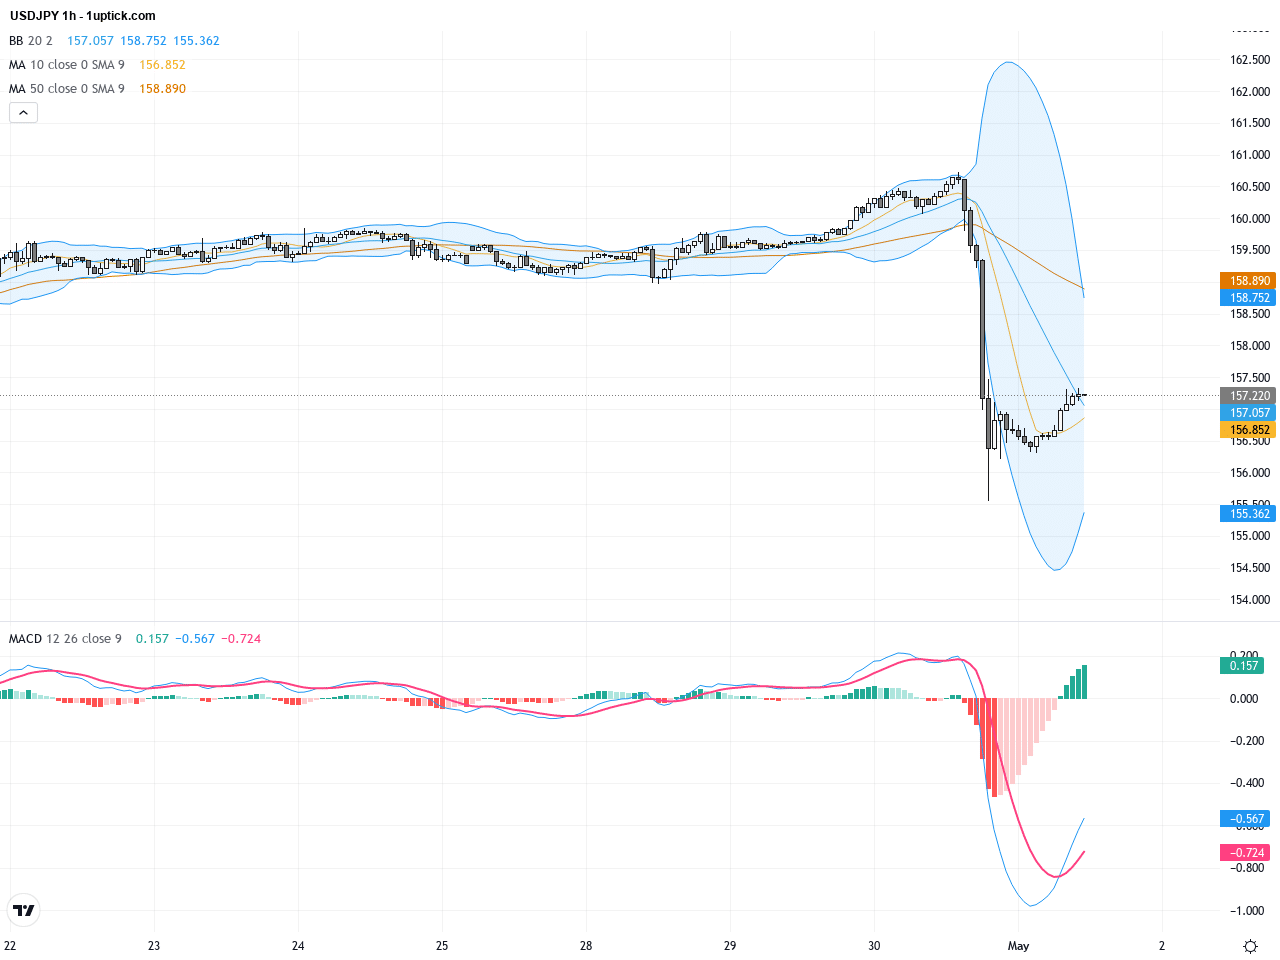
On the hourly chart covering the last 5 days, USDJPY has been consolidating within a flag pattern between 159.5 and 160.7, indicating a brief pause before the next leg up. The latest candlestick formed a bullish engulfing pattern, suggesting that an upward continuation is likely within the next 24 hours. Bollinger Bands are tightening slightly but MACD histogram is rising, hinting at potential breakout momentum.
Technical Trend: The trend is best described as a ‘Volatile but Strong Uptrend’ where bulls dominate amid intervention uncertainties causing fluctuations.
Key technical insight is USDJPY’s breakout above the 160 psychological level, supported by expanding positive MACD and bullish daily moving averages, signaling sustained momentum. However, the hourly chart’s flag pattern suggests short-term consolidation or pullback is possible. Given increased warnings of BOJ intervention, traders should brace for volatile swings and watch critical price areas closely.Today’s GMT+1 economic calendar highlights the release of Japan’s Tokyo Core CPI and Manufacturing PMI, crucial for judging inflation pressure and economic momentum in Japan. Better-than-expected readings may strengthen the yen further, pressuring USDJPY downward. Other releases such as U.S. ISM Manufacturing Index are less likely to have immediate impact on USDJPY today.
Resistance & Support

The above financial market data, quotes, charts, statistics, exchange rates, news, research, analysis, buy or sell ratings, financial education, and other information are for reference only. Before making any trades based on this information, you should consult independent professional advice to verify pricing data or obtain more detailed market information. 1uptick.com should not be regarded as soliciting any subscriber or visitor to execute any trade. You are solely responsible for all of your own trading decisions.