

 |
| Gold V.1.3.1 signal Telegram Channel (English) |
AUDUSD: Key Support at 0.7090 Sparks Fresh Bullish Momentum, July 13, 2026
2026-07-13 @ 06:01
In the past 24 to 48 hours, the Australian Dollar against the US Dollar (AUD/USD) has demonstrated relative stability, consolidating just above the 0.69 level, slightly below yesterday’s closing price of 0.69404. Expectations of a negotiated end to Iran’s conflict have supported the AUD, allowing it to show resilience amid a weakening USD. Moreover, softer US jobs data and less hawkish Fed comments have triggered a rebound, boosting investor risk appetite.
Risk sentiment has noticeably improved recently, pushing AUD/USD’s correlation with global equities to 0.95, indicating that this currency pair is currently driven by risk-on dynamics. For example, gains in the S&P 500 and Nasdaq have encouraged capital inflows into higher-risk assets, further strengthening the Australian Dollar.
For the average investor, the recent international uncertainties and softer US economic data have caused some volatility. However, Australia’s steady inflation and the prospect of prolonged higher interest rates continue to make the AUD appealing. Simply put, as markets await clearer direction on US and global policies, investors are seeking relatively stable refuge assets, with AUD standing out due to a blend of supportive risk sentiment and solid fundamentals.
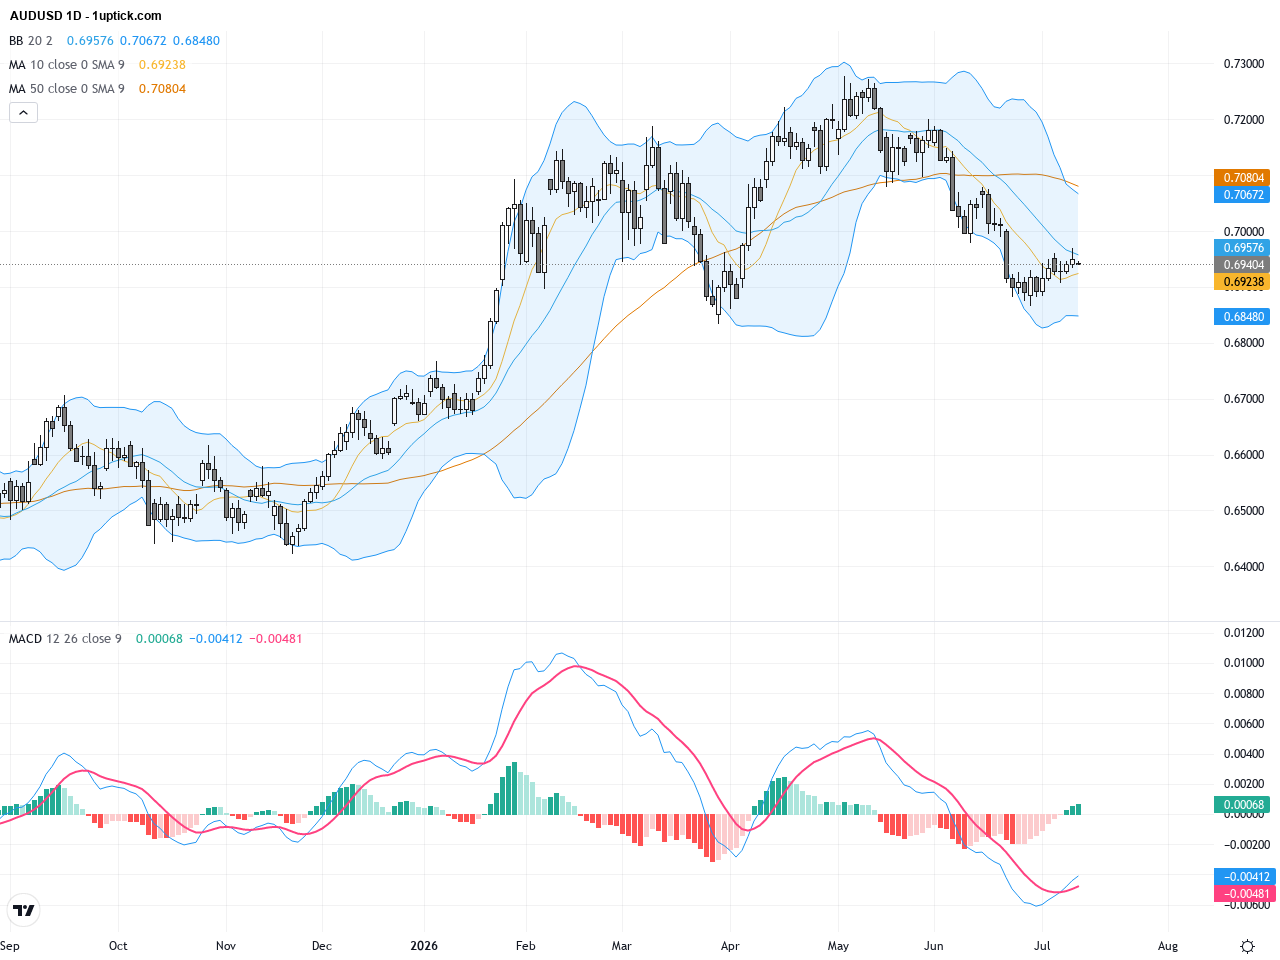
The daily chart shows AUDUSD rallying strongly after finding support near 0.7090, completing a corrective structure and initiating a new bullish sequence. Price has broken out of a month-long consolidation, retesting the confluence of the 50-day moving average (around 0.7074) and the 200-day moving average (around 0.6865), signaling medium-term buyers gaining control. Bollinger Bands have expanded after a squeeze, and MACD histogram turned positive with a bullish crossover, confirming momentum is shifting upward. The trend favors further upside if support levels hold firm.
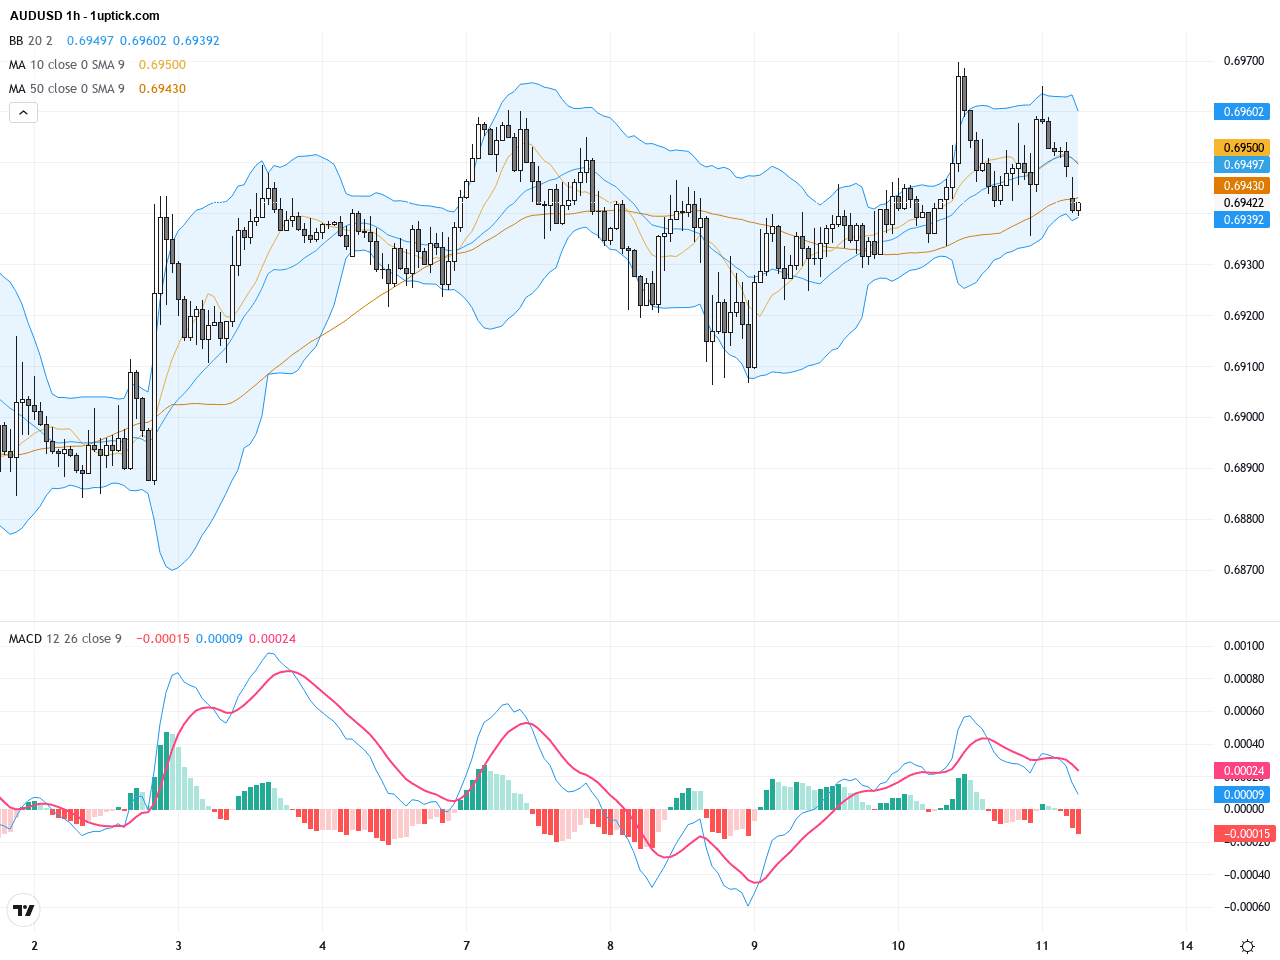
On the hourly chart over the last 3-5 days, price action shows a narrowing range near the 0.6900 level with occasional upper wicks suggesting short-term selling pressure. Moving averages have flattened indicating consolidation, and the MACD is near a cross point hinting at an impending breakout. Watch the key resistance at 0.6955 – a successful break above could fuel further bullish momentum, while failure may prolong sideways action in the short term.
Technical Trend: Short-term consolidation, medium-term bullish bias, with cautious optimism awaiting confirmation from key resistance break.
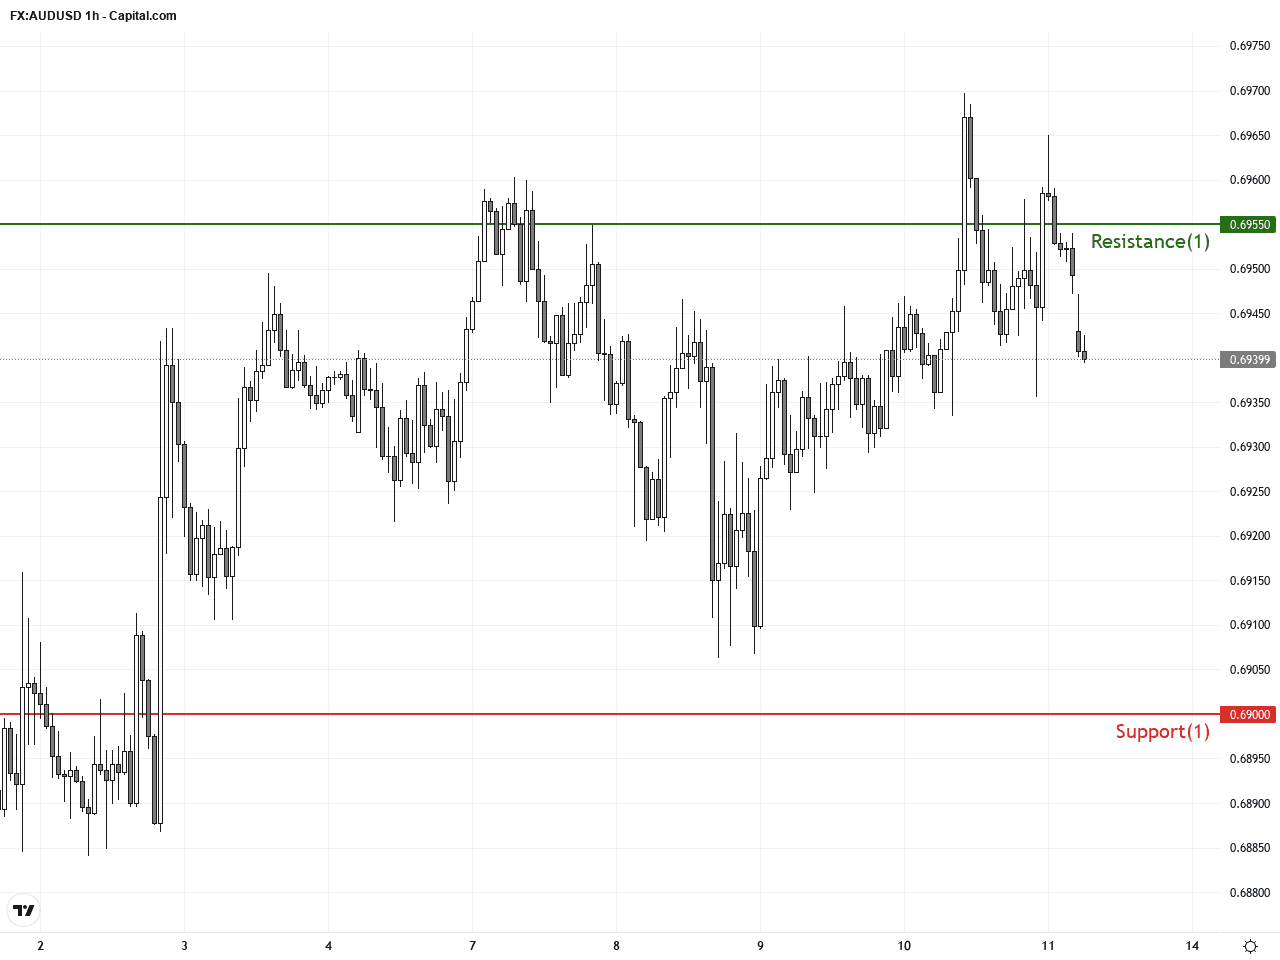
Technically, AUDUSD is in a medium-term uptrend supported by rising highs and lows and confirmed by the positioning of the 50- and 200-day moving averages. Key resistance at 0.6955 is critical; a break above it would likely accelerate buying interest. The MACD is edging toward a bullish crossover but has yet to confirm one, so short-term caution is warranted. Price action with upper wick shadows and slightly overbought RSI signal potential short-term pullbacks. Maintaining support near 0.7090 is crucial for sustaining bullish momentum.No significant or directly relevant economic events impacting AUDUSD are scheduled for today. Price action will likely remain driven by technical factors and broader risk sentiment until fresh fundamental catalysts emerge.
Resistance & Support
The above financial market data, quotes, charts, statistics, exchange rates, news, research, analysis, buy or sell ratings, financial education, and other information are for reference only. Before making any trades based on this information, you should consult independent professional advice to verify pricing data or obtain more detailed market information. 1uptick.com should not be regarded as soliciting any subscriber or visitor to execute any trade. You are solely responsible for all of your own trading decisions.