

 |
| Gold V.1.3.1 signal Telegram Channel (English) |
GBPUSD: Breaks Above 1.34 Resistance as Bullish Momentum Builds, July 13, 2026
2026-07-13 @ 13:01
Over the past 24 to 48 hours, GBP/USD exhibited notable volatility, with prices rising slightly above the previous closing price of 1.33834, reaching a near three-week high above 1.340. The British Pound strengthened amid a softer US dollar backdrop, primarily driven by a reassessment of the US economic outlook and easing political risk in the UK.
Recent market news highlighted a new round of strikes between the US and Iran, which briefly weakened the US dollar and supported the Pound. Meanwhile, persistent US core inflation maintained the dollar’s firm stance in terms of interest rates and monetary policy divergence. On the UK front, reaffirmation of fiscal rules reduced political uncertainty, improving investor risk appetite and further boosting GBP/USD.
For the average investor, this market turbulence illustrates how global political and economic risks directly impact currency markets. When geopolitical tensions spike, the dollar often strengthens as a safe haven, but if confidence in the dollar wanes, major currencies like the Pound gain ground. The recent Pound’s upward momentum is a clear reminder that market sentiment and geopolitical events remain key drivers in currency movements.

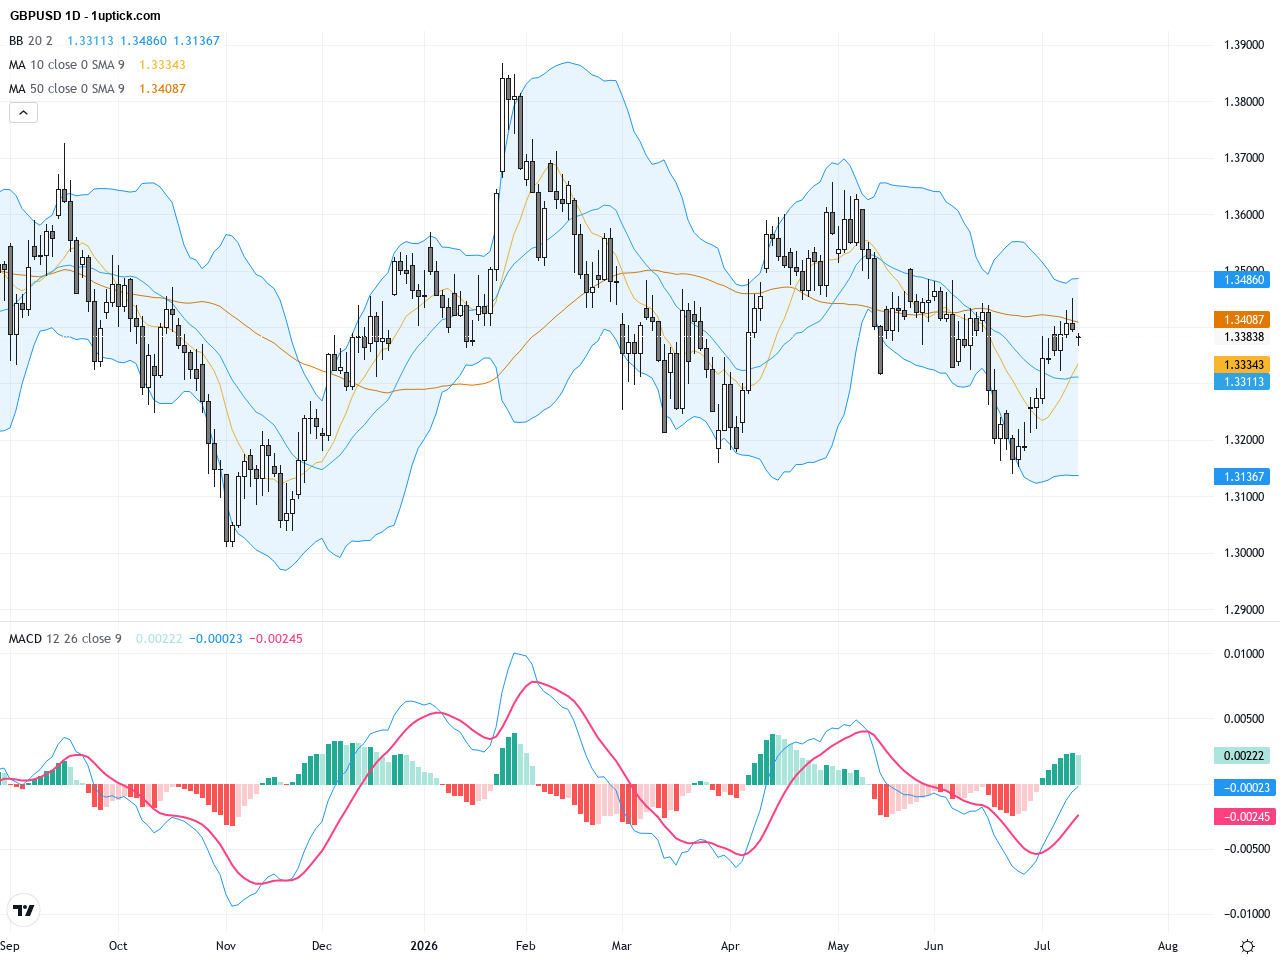
The daily chart reveals a steady uptrend in GBPUSD since lows near 1.3010 earlier this year. Recently, the pair broke above the 1.34 resistance level and closed above the 50-day moving average at 1.3357 but remains slightly below the 200-day moving average at 1.3420, indicating bullish bias with some overhead pressure. Bollinger Bands have widened, suggesting increased volatility. The MACD remains above zero without a bearish crossover, reinforcing bullish momentum in the medium term.
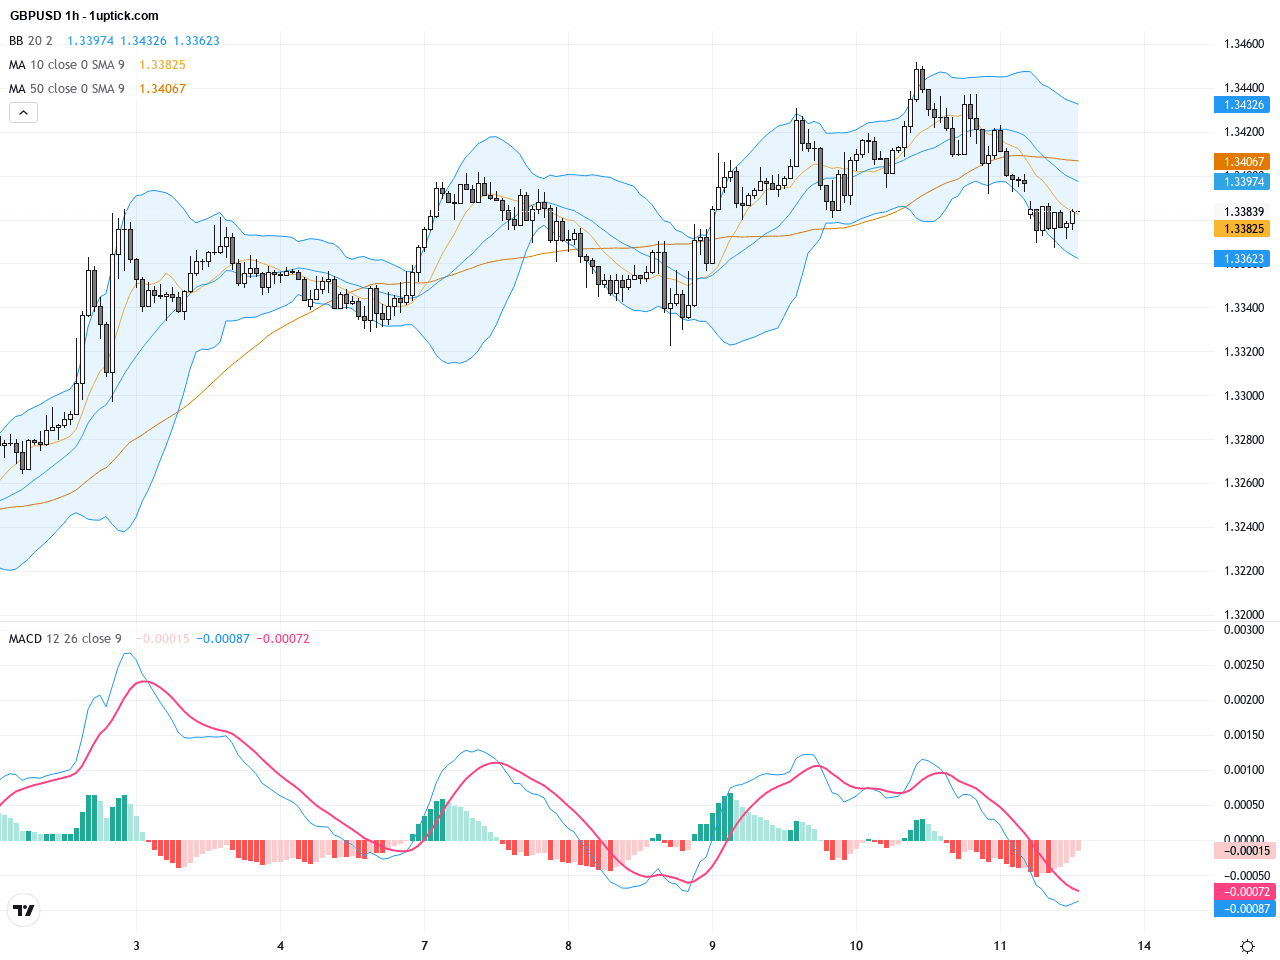
The hourly chart over the past 3 to 5 days shows increased short-term volatility with price oscillating between 1.3350 and 1.3420. The 5-hour moving average supports the price near current levels, and the MACD shows a bullish crossover indicating increasing upward momentum. Price frequently touches the upper Bollinger Band, highlighting strong bullish pressure and concentrated volatility. An ascending triangle pattern has emerged, signaling potential further upside continuation.
Technical Trend: The current GBPUSD trend is decisively bullish, with price above key moving averages and technical indicators supporting further upside.
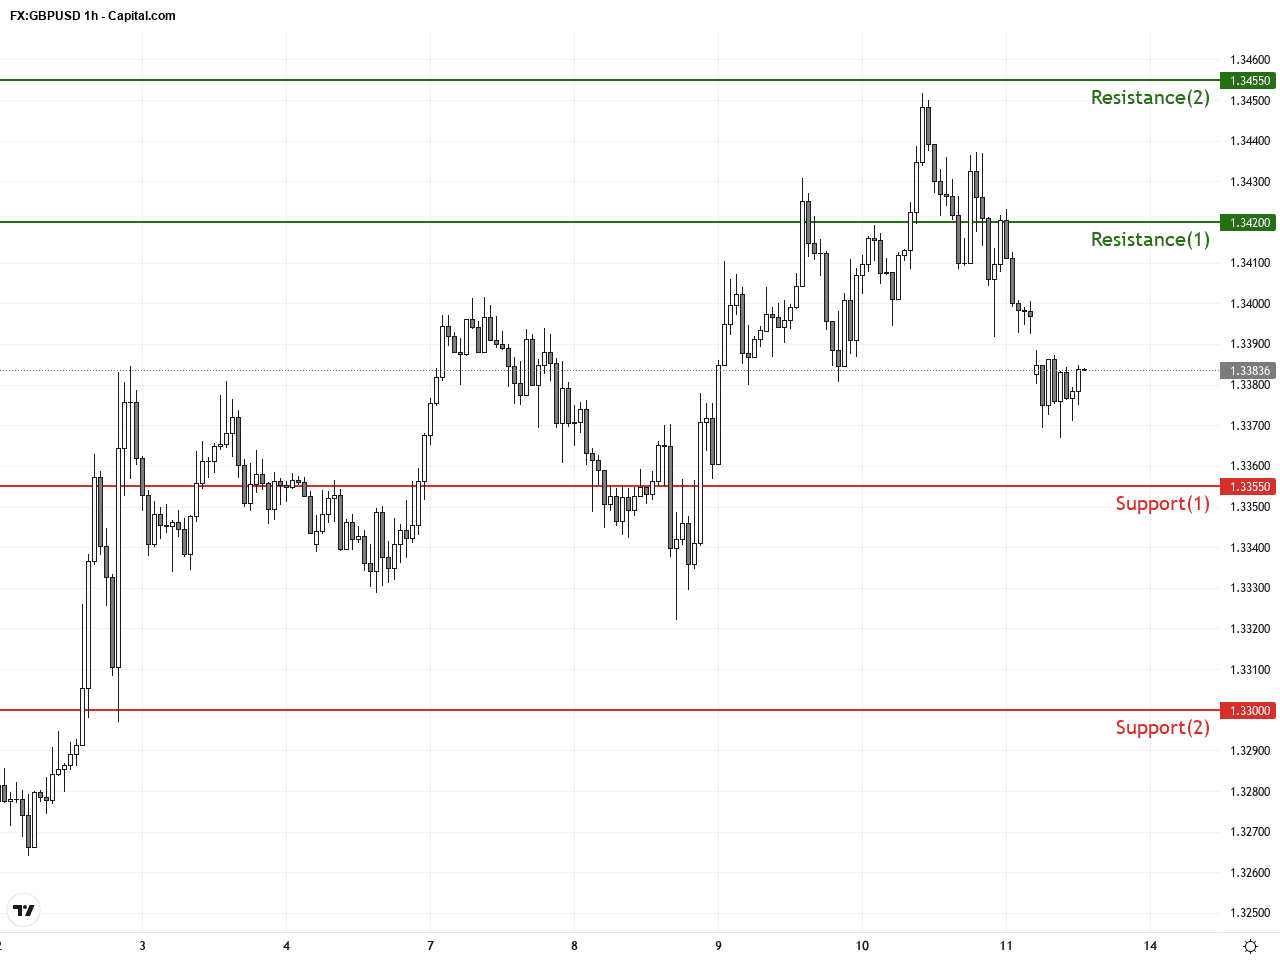
Technically, GBPUSD has broken above the short-term 1.34 resistance and the MACD supports sustained bullish momentum. The expanding Bollinger Bands on the daily chart indicate rising volatility, suggesting more defined price moves ahead. A bullish engulfing candlestick recently formed, signaling strong buying interest and likely continuation of the upward move over the next 24 hours. Traders may consider following the momentum post-confirmation of 1.34 support for short-term trading opportunities.Today’s GMT+1 economic calendar does not feature major events that directly impact GBPUSD. US scheduled events such as FOMC member speeches and the federal budget are set for later today but unlikely to cause immediate price swings. Chinese and Norwegian data releases may influence market sentiment indirectly but pose minimal direct risk to GBPUSD. Traders should keep an eye on upcoming US data but expect limited volatility from today’s calendar.
Resistance & Support
The above financial market data, quotes, charts, statistics, exchange rates, news, research, analysis, buy or sell ratings, financial education, and other information are for reference only. Before making any trades based on this information, you should consult independent professional advice to verify pricing data or obtain more detailed market information. 1uptick.com should not be regarded as soliciting any subscriber or visitor to execute any trade. You are solely responsible for all of your own trading decisions.