








 |
| Gold V.1.3.1 signal Telegram Channel (English) |
EURUSD Retraces After 1.1555 Peak, Eyeing Key 1.1600 Resistance Level, August 5, 2026
2026-08-05 @ 09:01
Over the past 24 to 48 hours, the EUR/USD saw a volatile retracement after reaching a six-week peak near 1.1555, edging slightly above yesterday’s closing price of 1.15316, before settling around 1.1519.
The drop in U.S. JOLTs job openings data, combined with gains in U.S. stock futures, triggered a pullback in the U.S. Dollar Index. This weaker dollar stance helped lift the euro, yet the rally was capped near technical resistance levels, as traders remain cautious about the next directional move.
For an average investor, this movement can be likened to a cautious negotiation where doubts about the U.S. economic outlook weigh on the dollar, while European factors like energy prices bolster the euro. The market is tentatively bullish on EUR/USD in the short term but remains watchful for any potential reversals in dollar strength.
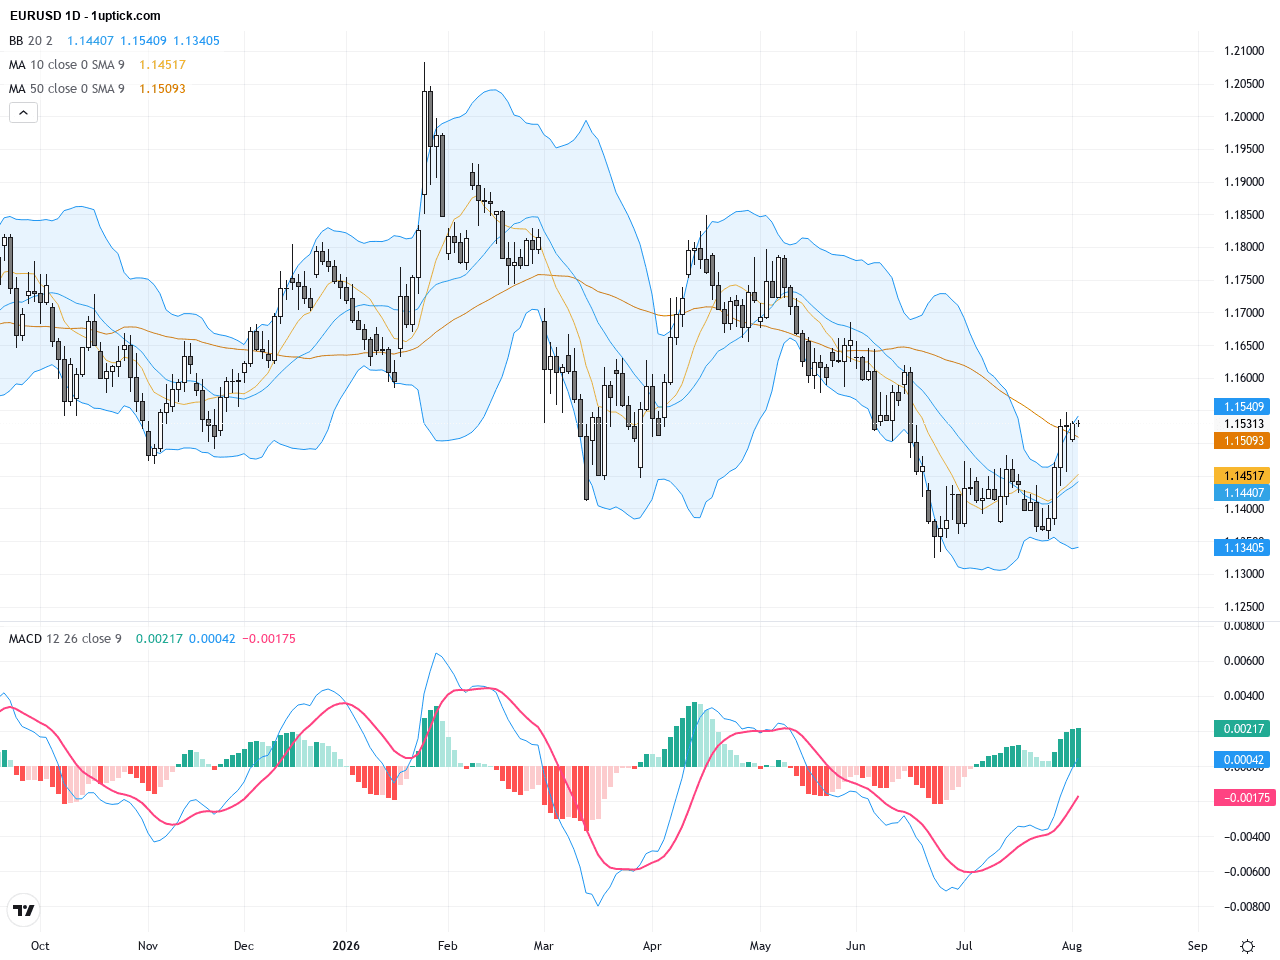
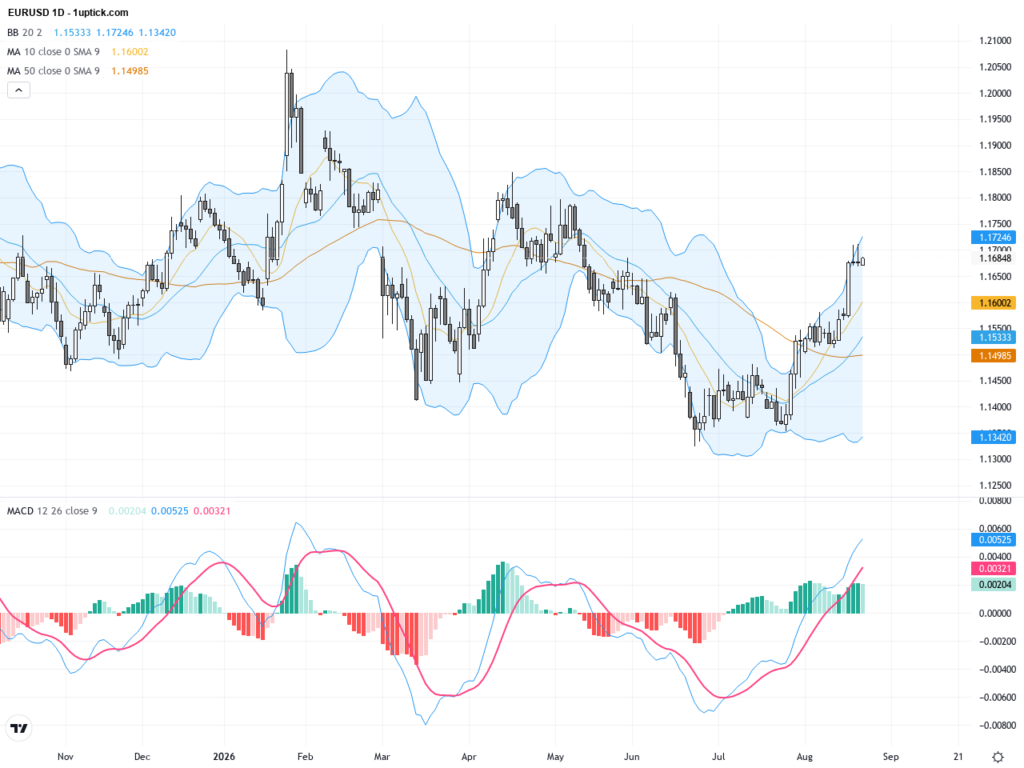
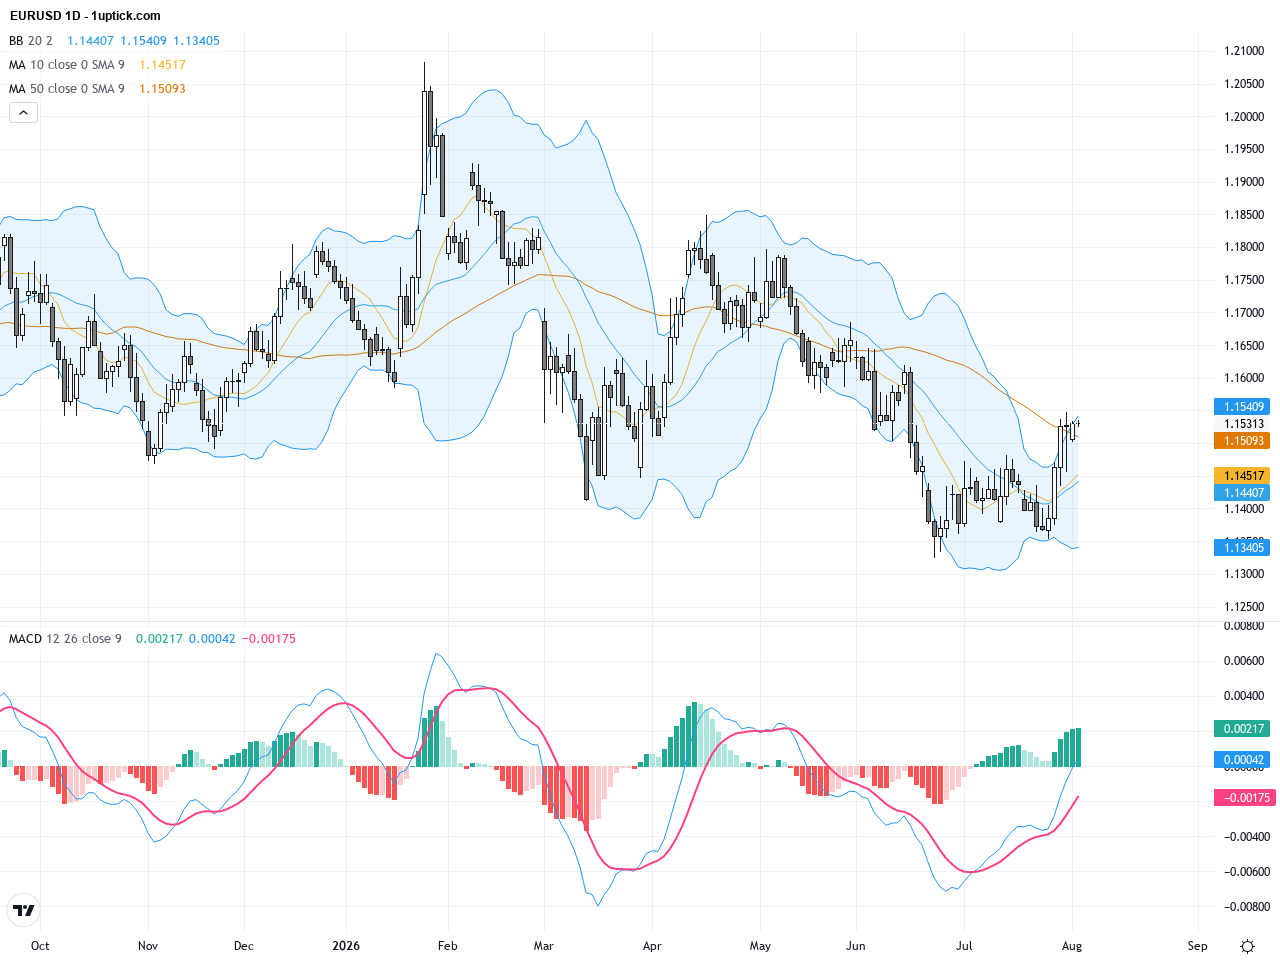
The daily chart of EURUSD depicts an overall uptrend since early 2026, with recent price action breaking above the 50-day moving average (~1.14821) and facing resistance near the 200-day moving average (~1.16284). Currently, the pair is consolidating around 1.153. The Bollinger Bands show moderate width, indicating stable volatility. The MACD remains positive but signals momentum weakening as the signal lines converge. The medium-term trend is bullish, yet short-term correction risks exist with the 200-day MA acting as a key resistance barrier.
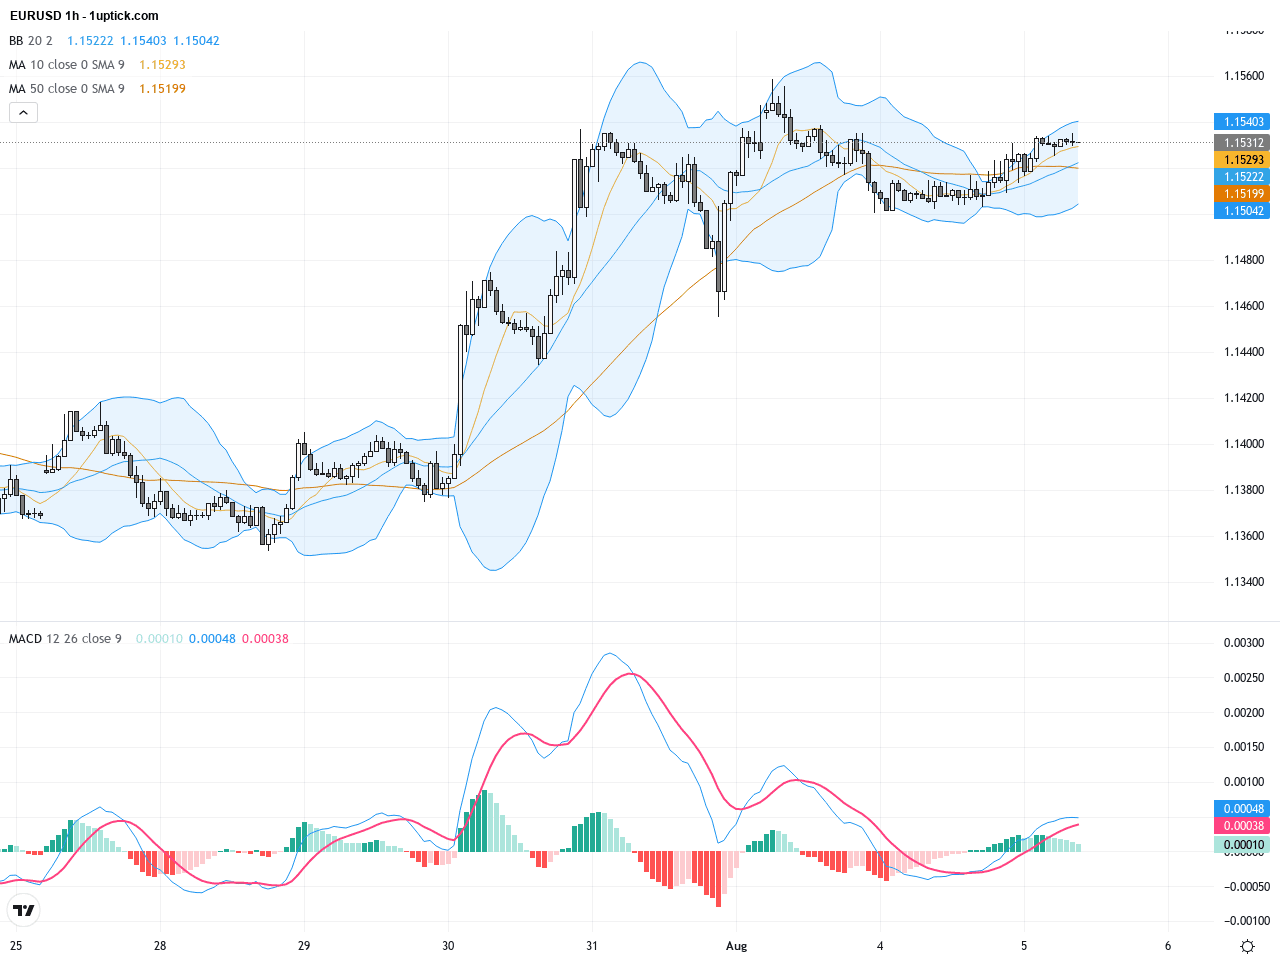
The hourly chart over the past 3-5 days shows EURUSD oscillating between 1.151 and 1.155. The short-term moving averages (20 and 50 EMA) are intertwined, and price tends to hover around the middle Bollinger Band. A recent bearish engulfing candlestick suggests a potential short-term pullback. The MACD crossover confirms momentum indecision. Immediate support can be seen near 1.1495, which has held firm multiple times in recent sessions.
Technical Trend: Current trend direction for EURUSD is cautiously bullish, characterized by short-term consolidation amid a medium-term uptrend.
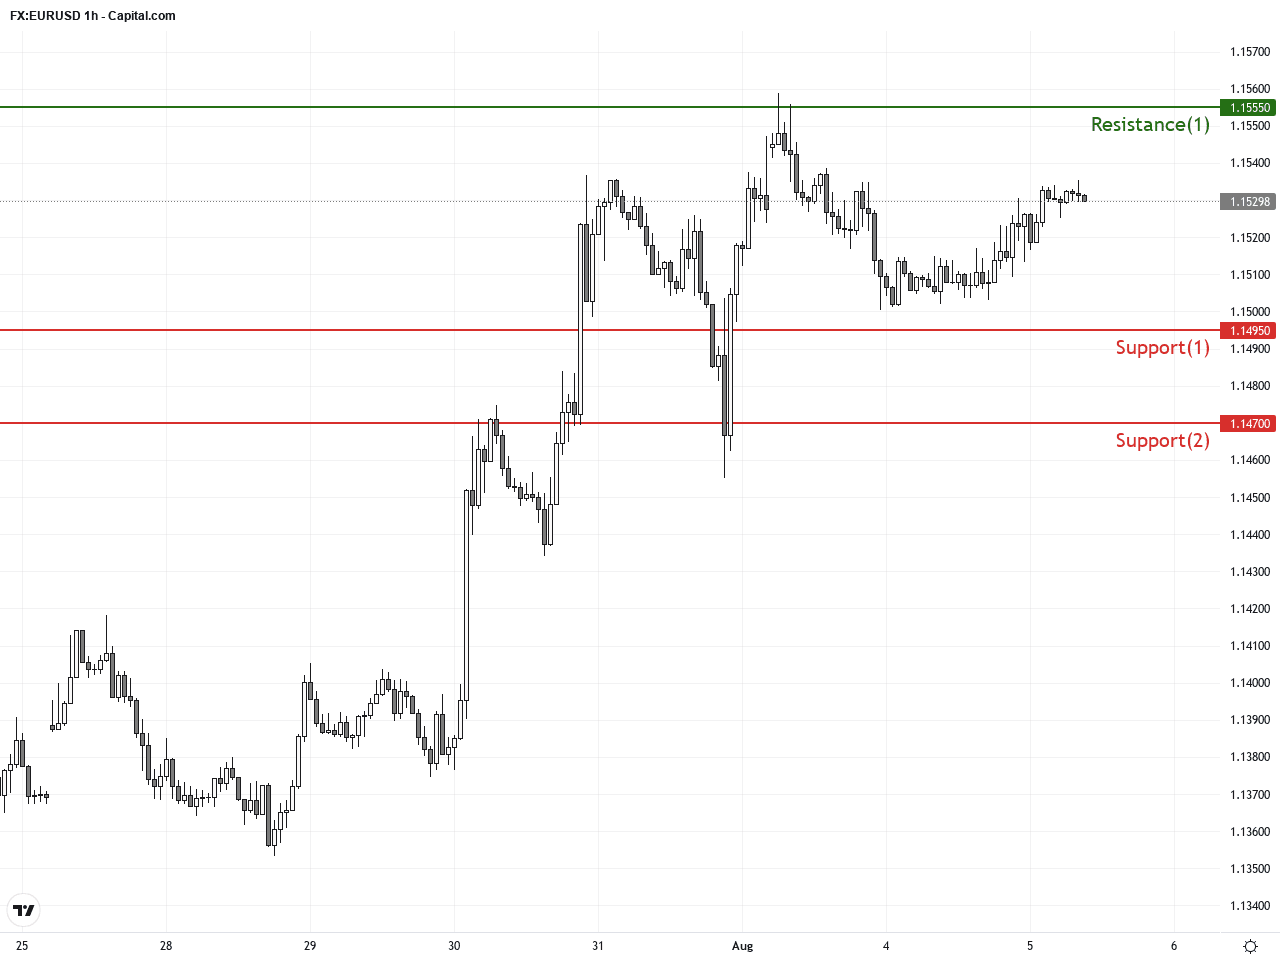
Technically, EURUSD is forming an expanding wedge pattern on the daily chart, reflecting a balance of bulls and bears. The 1.1555 level acts as immediate resistance, with key support around 1.1495. The recent bearish engulfing candle signals increased selling pressure in the short term, though the overall structure remains bullish. MACD crossovers indicate waning momentum, so guarding the support zone is vital to maintain bullish odds. A breakout above 1.1600 would signal a fresh upside leg.Today’s GMT+1 calendar includes several key Eurozone services PMI final readings and industrial production figures. The Eurozone Services PMI forecast at 51.6 (up from 49.4) may support EURUSD strength. Meanwhile, US data releases like the ADP employment report and ISM Non-Manufacturing Index could cause volatility. Strong US data may pressure EURUSD lower by boosting the dollar, while weaker data could support euro advances. Traders should watch timing and outcomes closely for trading cues.
Resistance & Support
The above financial market data, quotes, charts, statistics, exchange rates, news, research, analysis, buy or sell ratings, financial education, and other information are for reference only. Before making any trades based on this information, you should consult independent professional advice to verify pricing data or obtain more detailed market information. 1uptick.com should not be regarded as soliciting any subscriber or visitor to execute any trade. You are solely responsible for all of your own trading decisions.