









 |
| Gold V.1.3.1 signal Telegram Channel (English) |
WTI Crude Oil: Geopolitical Tensions with Iran Shake Prices Amid Key Support and Resistance Test, August 25, 2026
2026-08-25 @ 06:03
Over the past 24 to 48 hours, WTI crude oil prices have experienced notable volatility, closing at $85.01 on August 24, 2026, down about 2% from the previous day’s close. This decline was primarily driven by U.S. Treasury Secretary Scott Bessent’s announcement of new economic sanctions targeting Iran. The so-called “Operation Economic Outcast” sparked concerns among investors about potential disruptions to Iranian oil supplies. However, uncertainty around global energy demand kept prices under pressure, resulting in a near-term price drop.
On the other hand, from a speculative perspective, net long positions in crude oil futures hit a two-month high during this timeframe, indicating that some market players remain optimistic about a potential rebound. The intertwining of geopolitical tensions surrounding Iran and the U.S. sanctions created short-term market swings. Simply put, investors are navigating a complex landscape of political and economic risks, showing how geopolitics continues to keep the crude oil market highly sensitive and reactive.
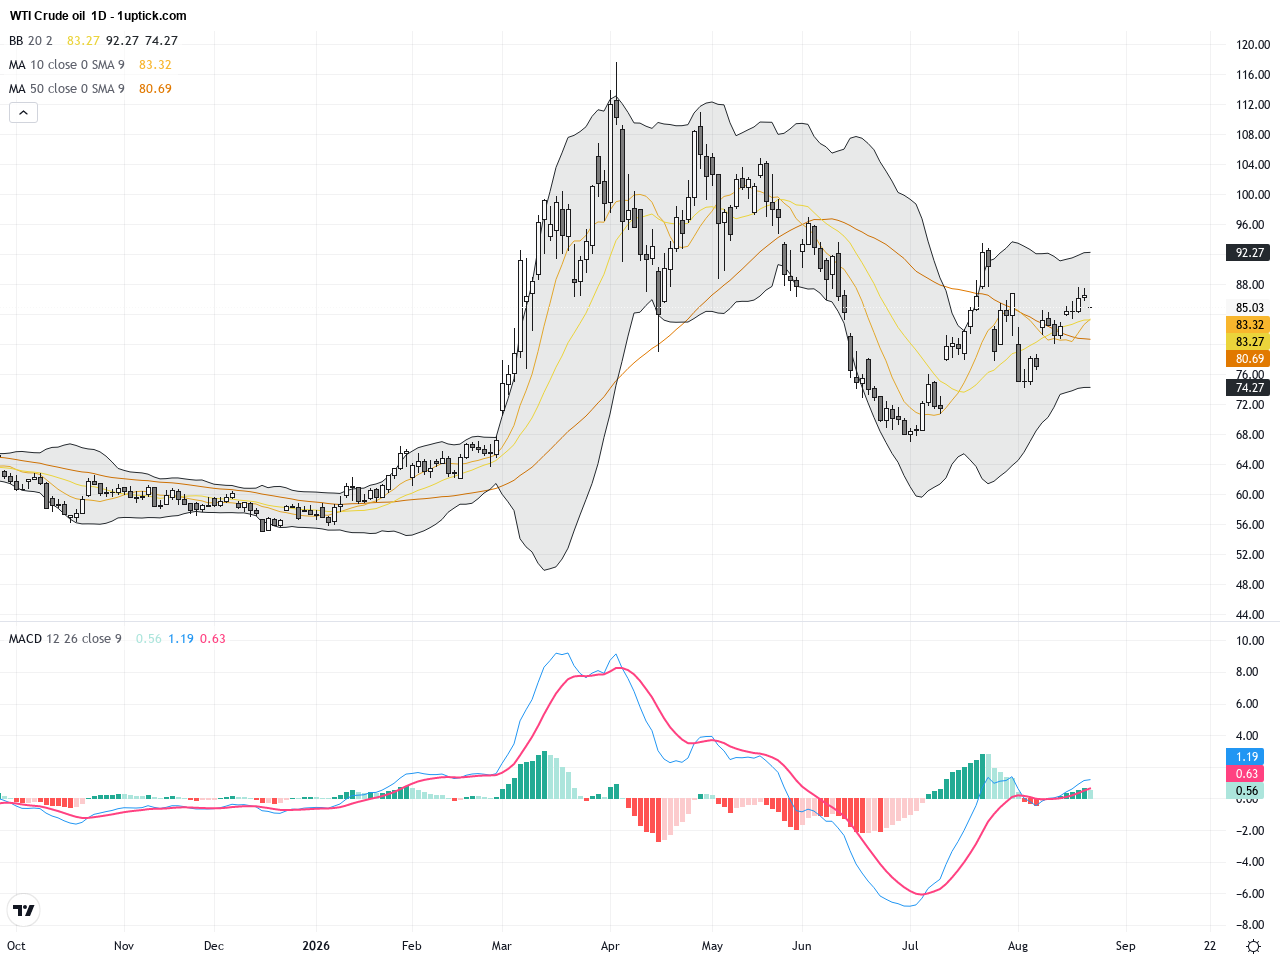
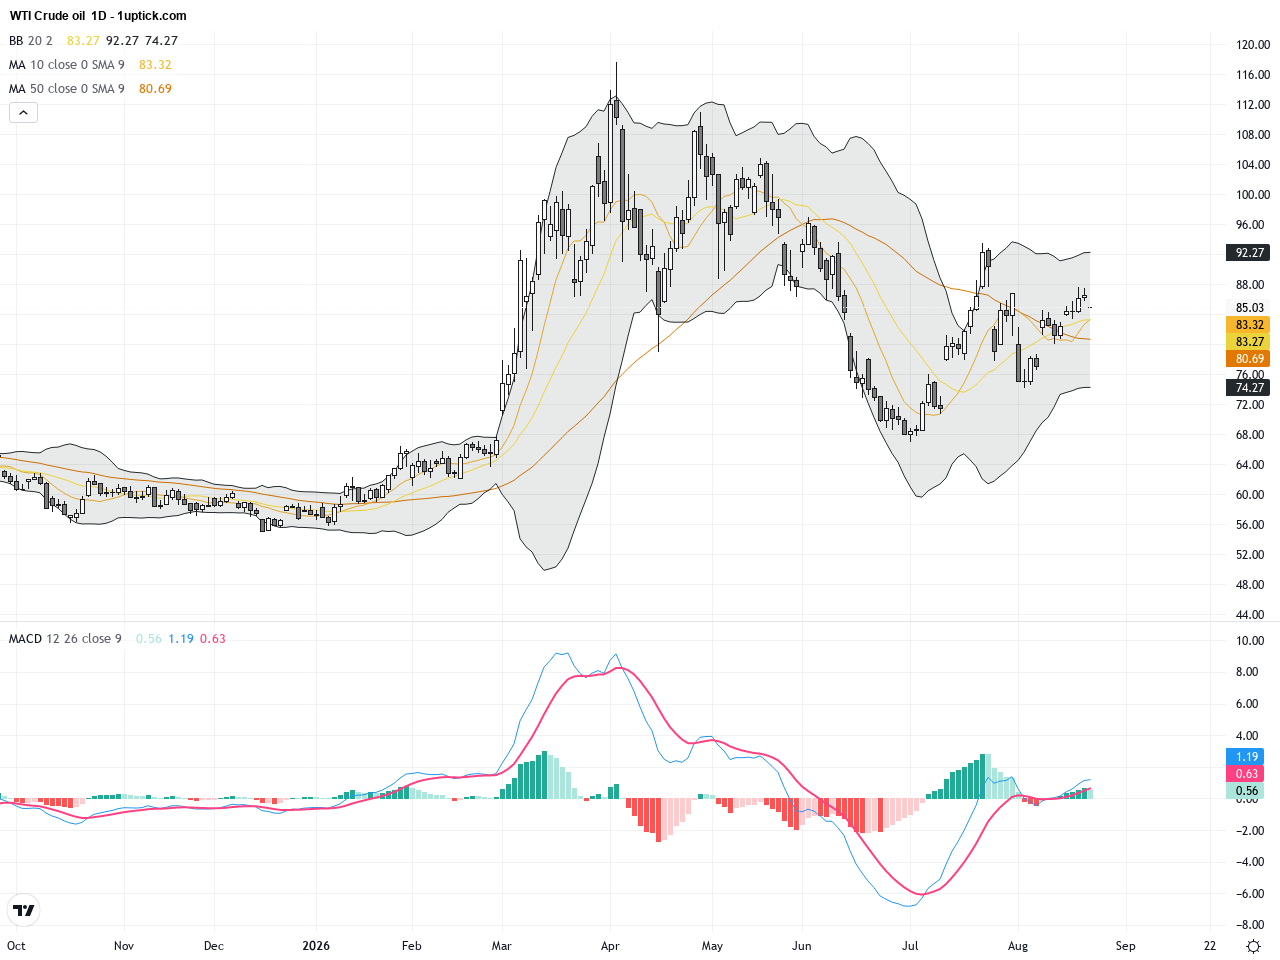
The daily chart illustrates a strong upward trend for WTI crude over the past month, rising from around $78 to above $87. Yet, in the last three days, prices have retraced, with the moving averages flattening slightly and Bollinger Bands narrowing, signaling reduced volatility. The MACD is nearing the zero line, hinting at weakening momentum and a possible trend reversal. While the overall trend remains bullish, the presence of bearish headlines could trigger a correction. Currently, prices are testing support near the 20-day moving average, which will be crucial in determining the next directional move.
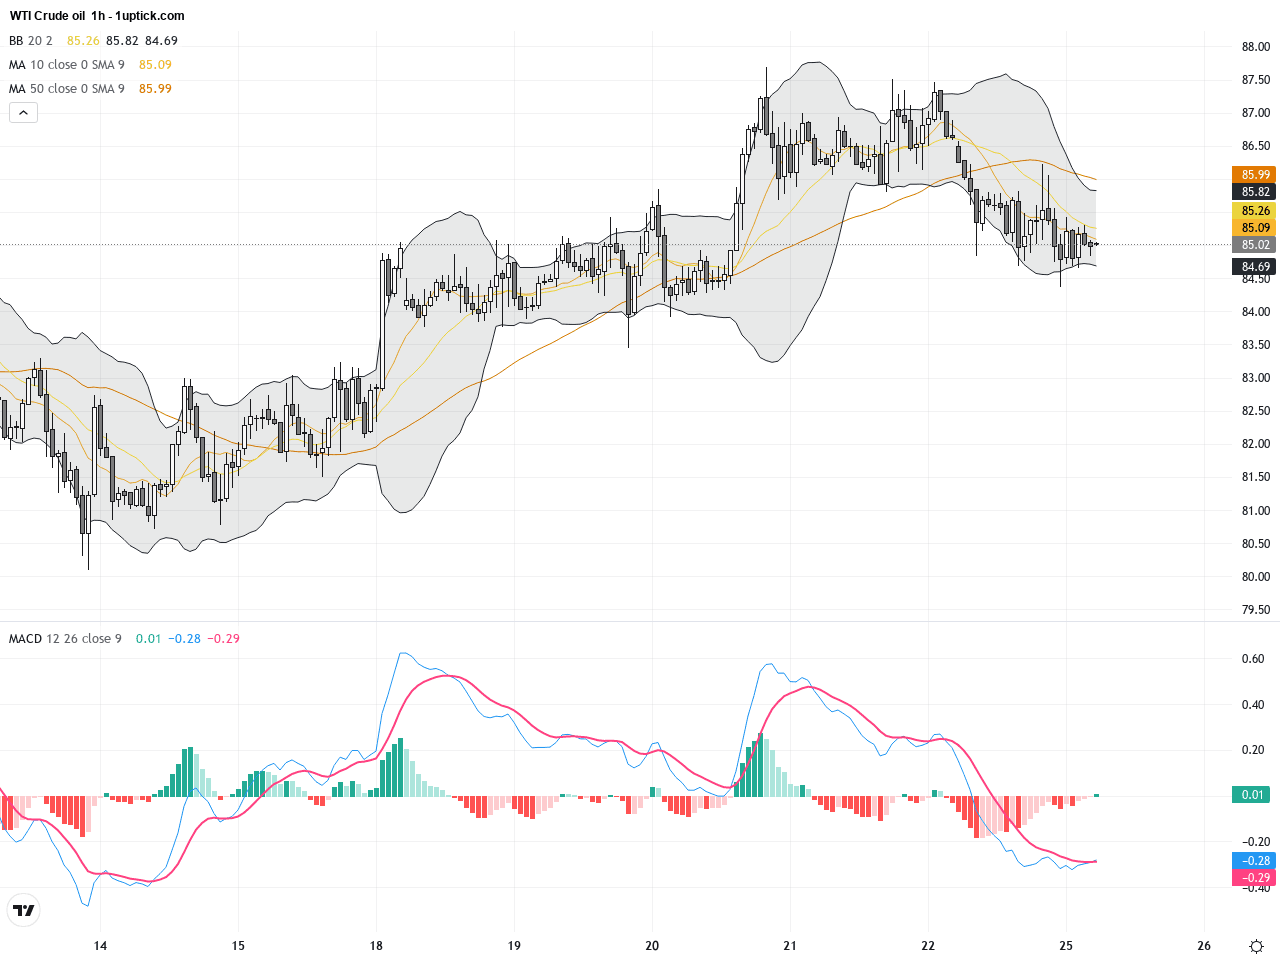
The hourly chart reveals intensified fluctuations for WTI in the past 3-5 days, with prices oscillating between $85 and $87. Bollinger Bands are contracting, suggesting a potential imminent breakout. The MACD has recently formed a bearish crossover, indicating short-term weakness, but RSI remains neutral, not yet oversold. Formation of a descending triangle pattern started roughly three days ago, pointing to increased downside pressure. Additionally, a bearish engulfing candlestick pattern appeared yesterday, hinting at potential continuation of downward momentum. Traders should closely monitor key support zones for potential defensive maneuvers.
Technical Trend: WTI crude oil is presently in a cautiously bearish consolidation phase, facing short-term correction pressures while maintaining a longer-term uptrend conditional on key support levels holding.
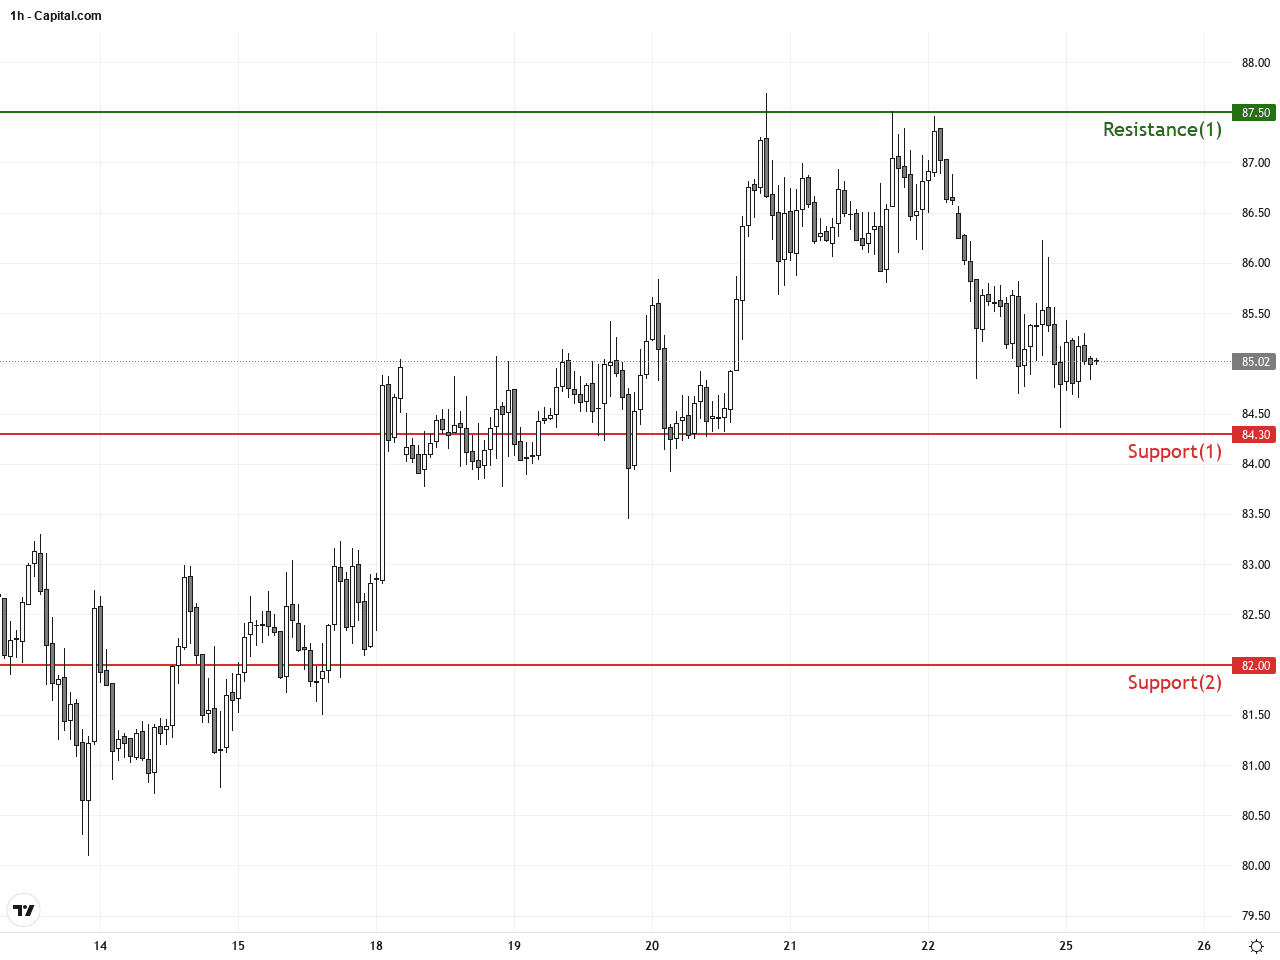
WTI crude oil currently stands at a critical technical juncture. The daily MACD is approaching a bearish crossover and Bollinger Bands are tightening, signaling weakening momentum but not yet breaking the medium-term bullish structure. The hourly descending triangle and bearish engulfing candlestick reinforce short-term downside risks. While speculative net longs have risen, reflecting optimism, the mounting U.S. sanctions against Iran are creating downward pressure on prices. Close attention to support and resistance levels is essential for adjusting trade strategies based on breakout or hold scenarios.There are no significant or directly relevant economic events scheduled today (GMT+1) that are expected to impact WTI crude oil prices. Market focus remains on geopolitical developments and fundamental supply-demand factors. Investors should watch for upcoming global economic releases for possible future influence on oil prices.
Resistance & Support
Run Live WTI Crude Oil Analysis
The above financial market data, quotes, charts, statistics, exchange rates, news, research, analysis, buy or sell ratings, financial education, and other information are for reference only. Before making any trades based on this information, you should consult independent professional advice to verify pricing data or obtain more detailed market information. 1uptick.com should not be regarded as soliciting any subscriber or visitor to execute any trade. You are solely responsible for all of your own trading decisions.