







 |
| Gold V.1.3.1 signal Telegram Channel (English) |
USDCAD: Key Support and Technical Consolidation Amid Rising Oil Prices, August 25, 2026
2026-08-25 @ 13:01
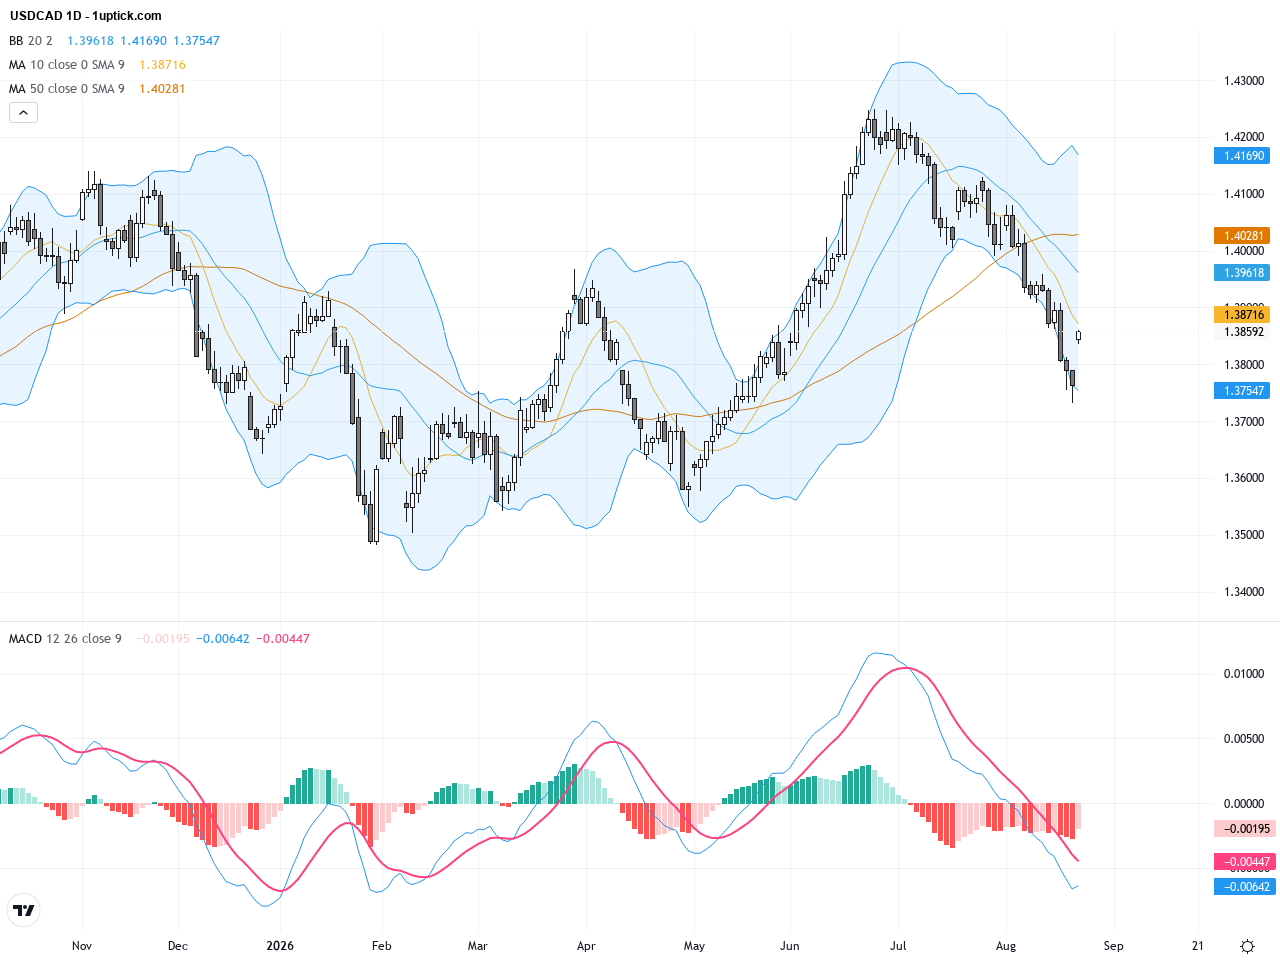
Over the past 24 to 48 hours, the USD/CAD pair exhibited notable volatility, reinforcing its position around the mid-1.38 range, closing slightly higher yesterday at 1.38591. This movement reflects the market’s sensitivity to escalating trade tensions between the US and Canada, alongside reactions to rising oil prices.
Latest market news highlights that the Canadian Dollar remains depressed as a firmer USD and trade war concerns counterbalance the benefits of higher oil prices. Specifically, new US tariffs on Canadian imports and anticipation of further Iran sanctions details have bolstered USD/CAD gains. For the average investor, this scenario is akin to increased friction in US-Canada negotiations undermining Canada’s resource-linked currency temporarily, while investors gravitate toward the US dollar as a safe haven, driving short-term USD strength and pushing the USD/CAD rate higher.
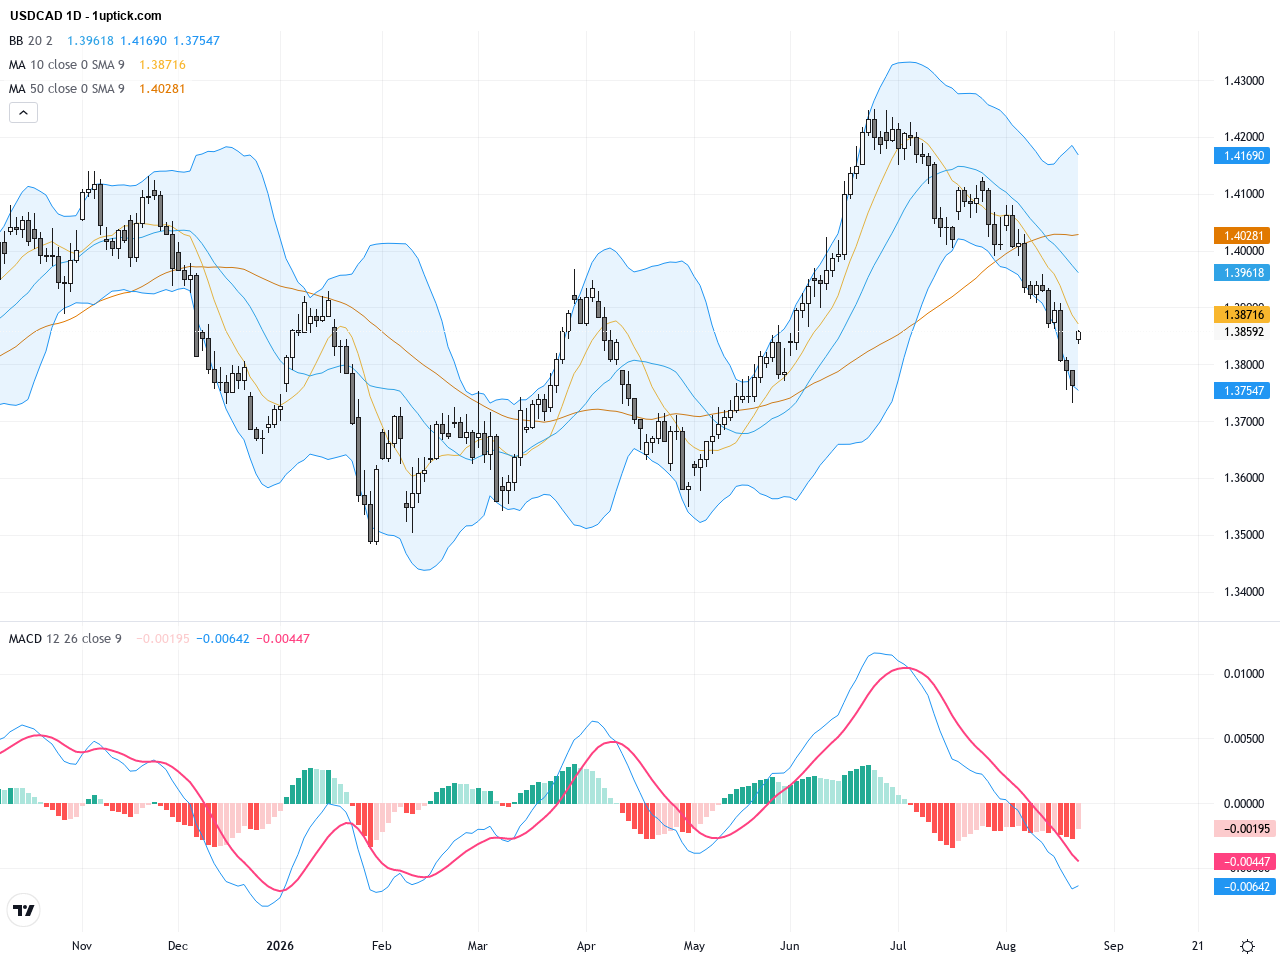
The daily chart reveals USDCAD trading within a horizontal range since mid-July between approximately 1.37 and 1.40. The price hovers near the 200-day moving average around 1.38, showing notable support, though the 50-day MA at around 1.40 remains unbroken. The Bollinger Bands are tightening, indicating reduced volatility, while the MACD fluctuates around a neutral crossover, signaling a lack of decisive trend and a market awaiting fresh catalysts.
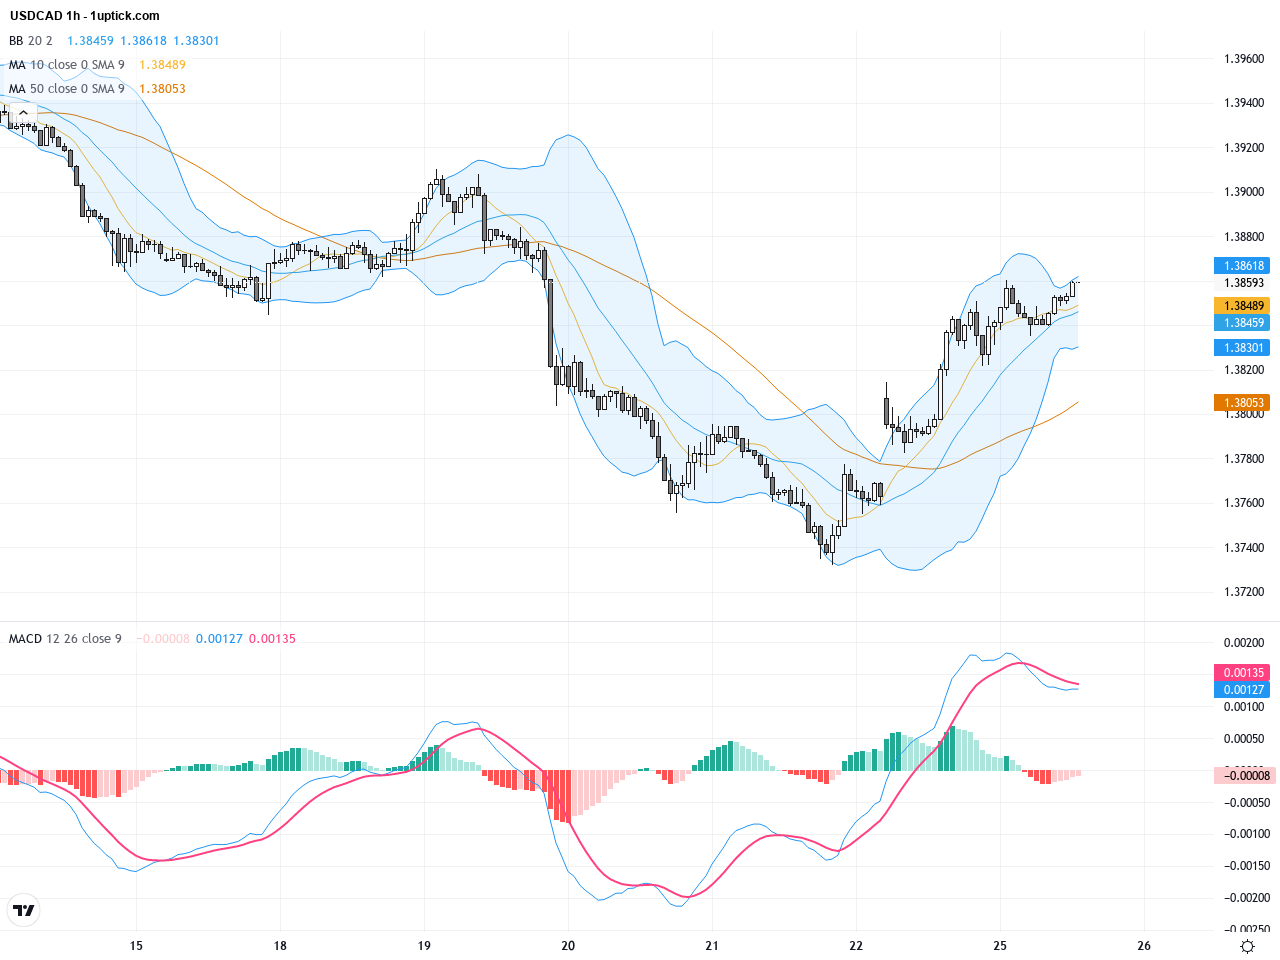
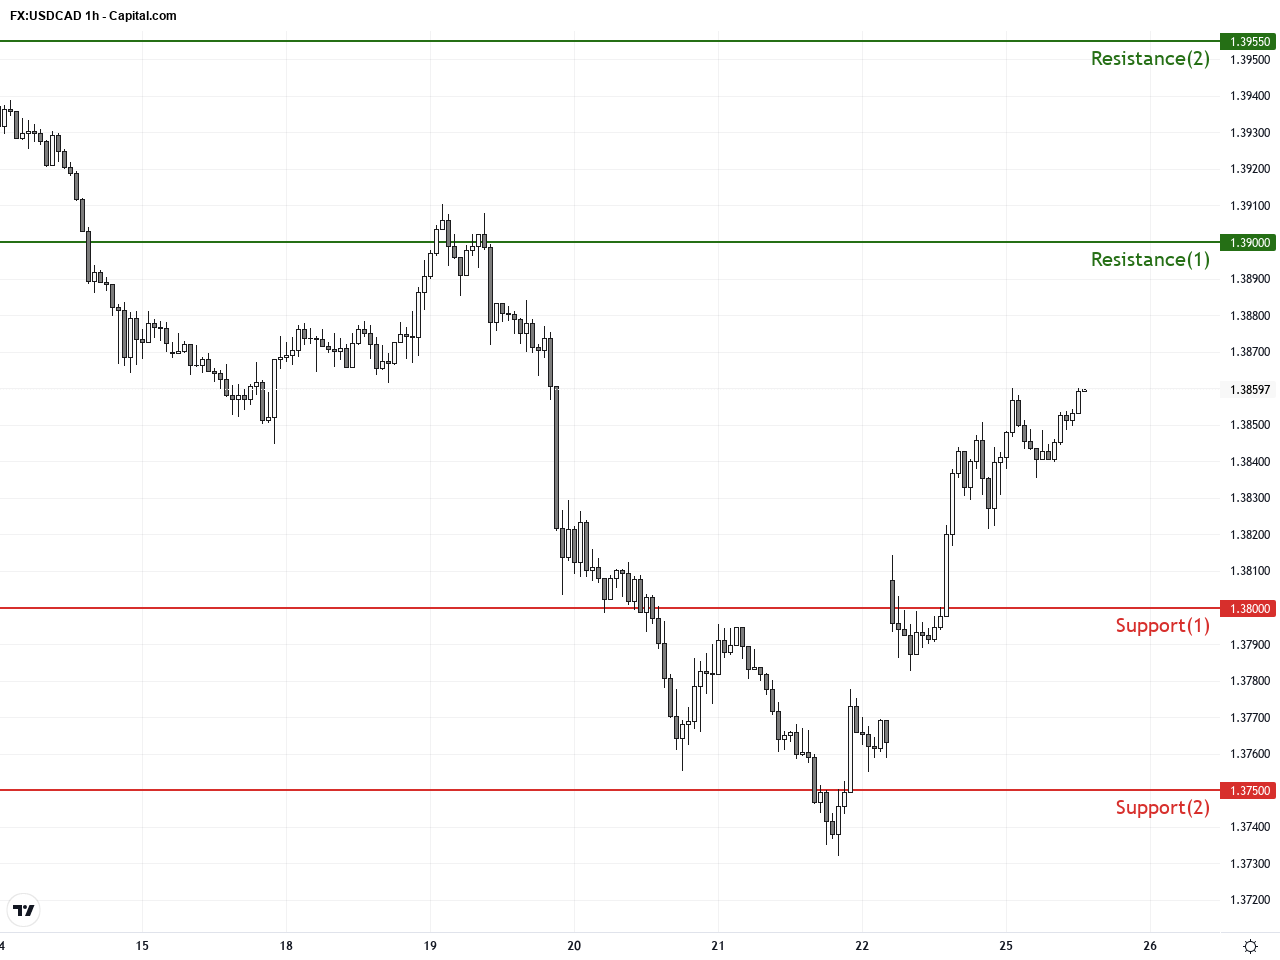
Over the past 3-5 days on the hourly chart, USDCAD exhibits a mild short-term upward trend. The price rebounded from below 1.3750 and is testing to hold above 1.3850. The 50-period moving average is trending upwards, supporting price action, while the Bollinger Bands’ middle line gradually lifts, evidencing improving short-term momentum. The recent MACD bullish crossover and steady volume suggest potential for a cautious rebound, yet overarching consolidation weighs on strong directional conviction.
Technical Trend: USDCAD is currently in a cautious sideways consolidation phase characterized by indecision and range-bound movement. The short-term trend is volatile sideways, awaiting decisiveness from fundamental triggers or technical breakouts.
Technically, USDCAD’s daily and hourly charts signal indecision, yet the hourly MACD golden cross and ascending Bollinger Bands midline suggest short-term bullish momentum. The dominant technical pattern is a horizontal triangle consolidation forming since mid-August, reflecting a balance of buyer and seller pressures. The recent doji candlestick with upper and lower shadows indicates market probing at the current support zone, implying a potential breakout within the next 24 hours. Traders should watch the 1.3850 level closely for a high-probability trade setup.Today’s economic calendar does not include any significant or direct data releases impacting USDCAD. Key economic events from Canada and the US are absent, aside from speeches by Federal Open Market Committee (FOMC) member Barkin, which could indirectly influence sentiment. Additionally, the weekly crude oil inventory report may affect oil prices, indirectly impacting the commodity-linked Canadian dollar. Overall, the market news flow today is subdued, keeping the technical landscape as the primary driver of price movement.
Resistance & Support
The above financial market data, quotes, charts, statistics, exchange rates, news, research, analysis, buy or sell ratings, financial education, and other information are for reference only. Before making any trades based on this information, you should consult independent professional advice to verify pricing data or obtain more detailed market information. 1uptick.com should not be regarded as soliciting any subscriber or visitor to execute any trade. You are solely responsible for all of your own trading decisions.