AUDUSD Technical Analysis

Home  Technical Analysis  AUDUSD Technical Analysis
AUDUSD
AUDUSD: Technical Breakout Above 0.7200 Signals Strong Aussie Bullish Momentum, May 1, 2026
01May

AUDUSD: Technical Breakout Above 0.7200 Signals Strong Aussie Bullish Momentum, May 1, 2026

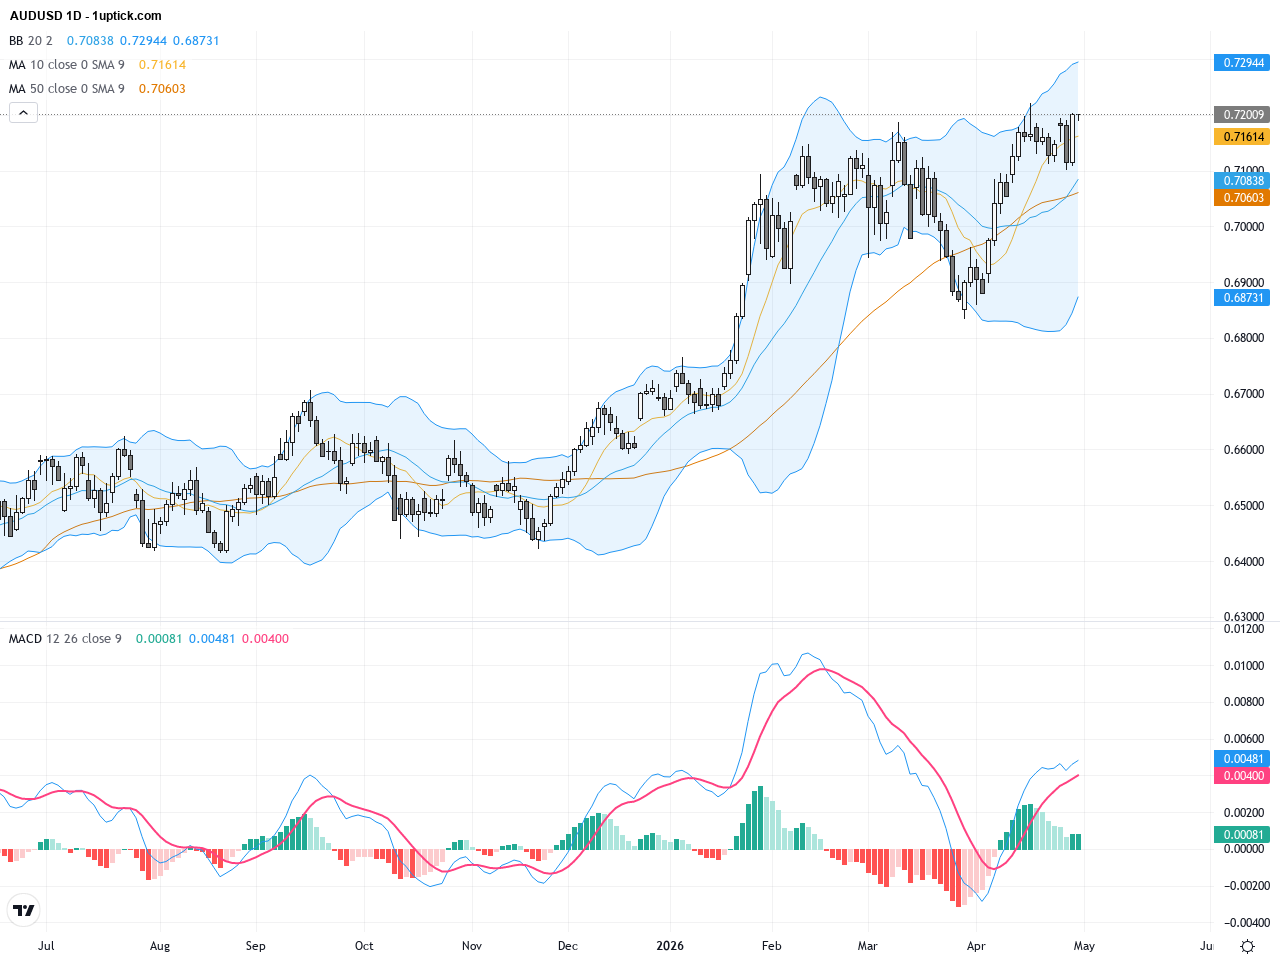
Over the past three trading days, AUDUSD surged significantly, closing yesterday at 0.72005 with a 1.19% gain, mainly driven by Japan’s intervention weakening the USD. This intervention helped the Australian Dollar reclaim the key 0.7200 level. Geopolitical developments, including US-Iran negotiations and oil price dynamics, have also boosted market risk appetite, favoring the AUD. For the average investor, when the USD shows short-term weakness coupled with easing geopolitical tensions, AUDUSD shows promising upside potential.
AUDUSD Technical Update: Bulls Rally Above 0.7090 Key Support Amid Risk Sentiment Boost
29Apr

AUDUSD Technical Update: Bulls Rally Above 0.7090 Key Support Amid Risk Sentiment Boost

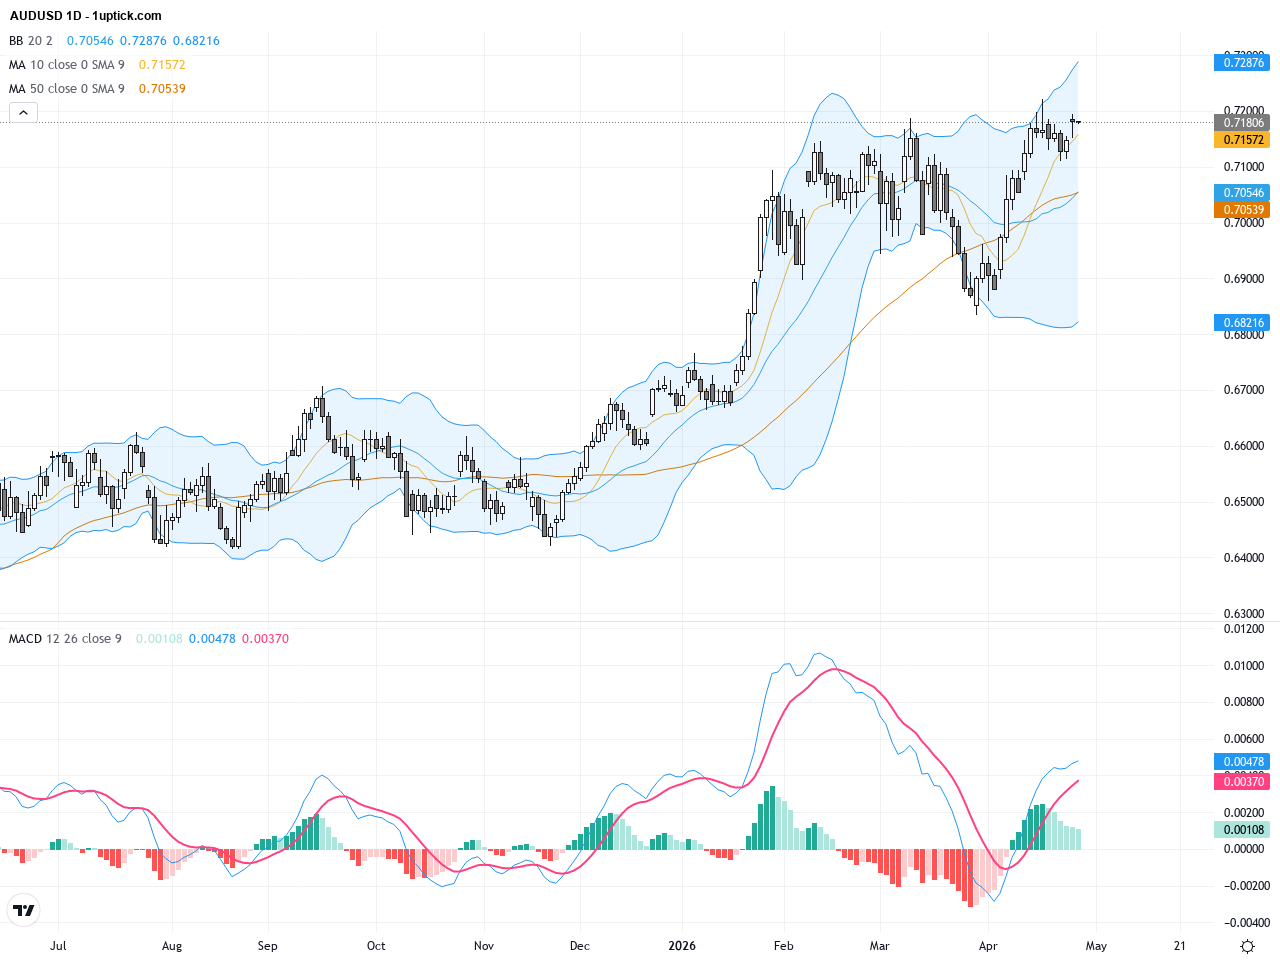
Over the past three trading sessions, AUDUSD hovered around 0.7181, driven heavily by shifts in risk appetite. Key news highlights include Iran’s olive branch on crucial oil routes, easing concerns over energy supplies and lifting risk sentiment globally. Despite headwinds from US economic challenges and safe-haven demand for the dollar, AUDUSD held firm at the pivotal 0.7090 support, initiating a new bullish impulsive sequence. For the average investor, this suggests the Australian dollar is showing resilience amidst improved geopolitical clarity, signaling potential buying opportunities near key support levels.

AUDUSD: Bulls Poised for Breakout Near Key Resistance Level
27Apr

AUDUSD: Bulls Poised for Breakout Near Key Resistance Level

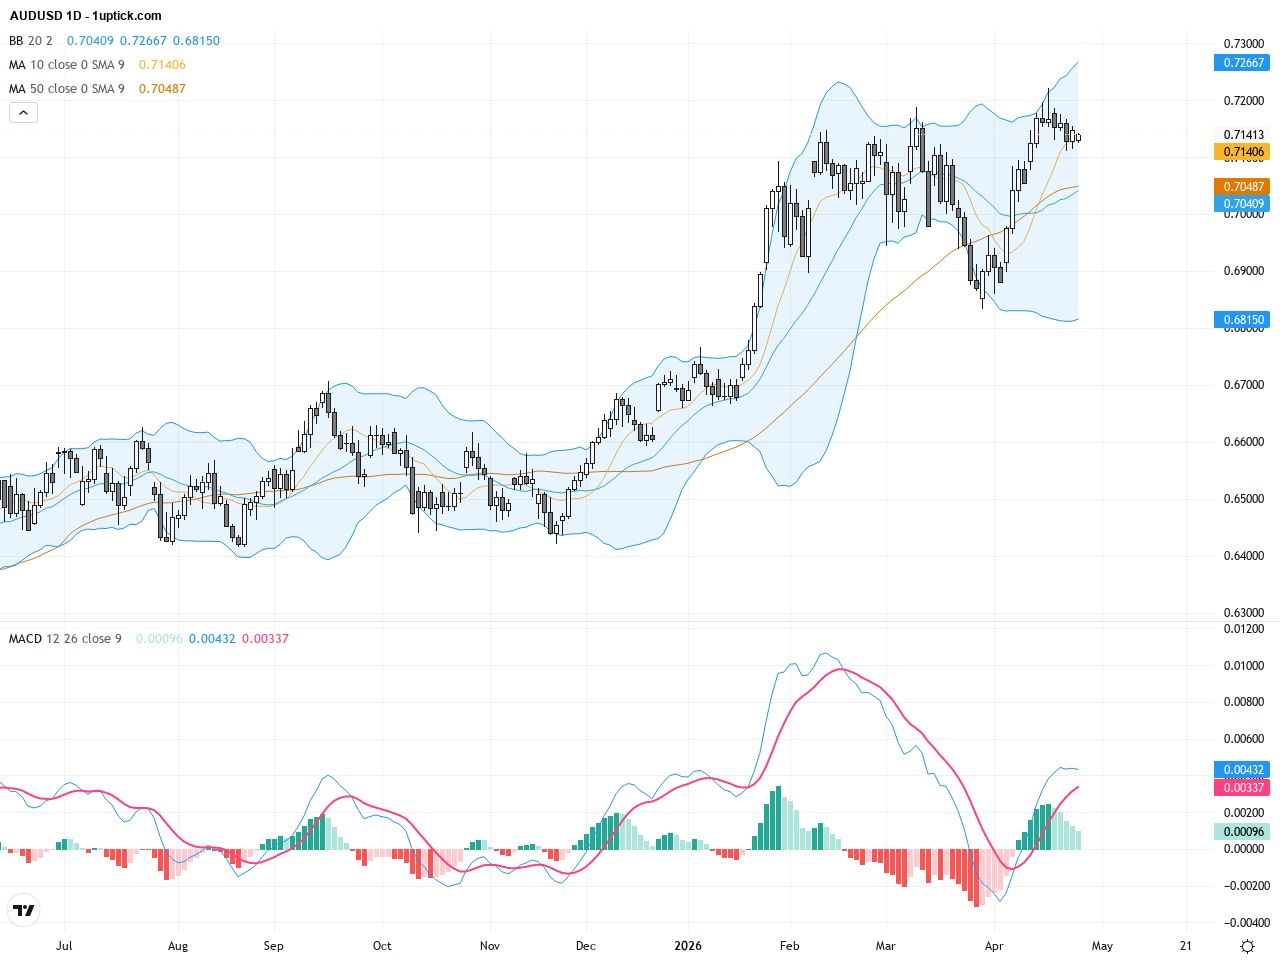
Over the past three trading days, AUDUSD has maintained an upward consolidation between 0.7129 and 0.7155, closing yesterday at 0.71407. Driven by Australian CPI data and geopolitical uncertainties, market sentiment remains cautious yet bullish. Recent news highlights that AUDUSD bulls are targeting a breakout above key resistance at 0.7150, with the upcoming Federal Reserve meeting (FOMC) adding directional impetus. For investors, this scenario is akin to standing at a crossroads—careful monitoring of inflation data and global risk developments will be critical to gauge price direction. This week’s market action emphasizes the importance of trading around support zones to capture opportunities amid volatility.

AUDUSD Technical & Fundamental Report: Aussie Bulls Defend 0.7200 Resistance Amid Hormuz Risk
24Apr

AUDUSD Technical & Fundamental Report: Aussie Bulls Defend 0.7200 Resistance Amid Hormuz Risk

Over the past three trading days, AUDUSD experienced notable volatility, hovering near the key resistance level of 0.7200 and maintaining near multi-year highs with yesterday’s close at 0.71298. The pair’s price action has been influenced heavily by energy supply concerns from the Hormuz Strait and escalating geopolitical tensions, while positive Australian economic signals and Scotiabank’s view of AUD undervaluation near 0.75 have bolstered bullish momentum. The interplay between a recovering crude price and a firming US Dollar index has created a tug-of-war scenario. For investors, this means AUDUSD is poised at a critical juncture—potentially ready to break higher but still facing external risk factors. Think of it as guarding a doorway with upside potential and downside caution.

AUDUSD Technical & Fundamental Report: Key Resistance Levels and Geopolitical Risk Impact
22Apr

AUDUSD Technical & Fundamental Report: Key Resistance Levels and Geopolitical Risk Impact

Over the past three trading days, AUDUSD hovered near 0.7151 with notable volatility driven by escalating Middle East tensions boosting the US dollar and pressuring the Australian dollar down over 0.3%. Despite this, a rebound in crude oil prices and strong Chinese inflation data supported Aussie resilience, particularly around the crucial 0.7200 resistance level. Market attention remains on geopolitical developments and upcoming Australian labor market data, vital for directional cues. For traders, this underscores the need to closely monitor global risk sentiment and commodity movements to navigate AUDUSD’s short-term fluctuations and medium-term outlook effectively. Recent market news points to ongoing instability, setting the stage for cautious but strategic trading moves.

1 10 11 12 13 14 23
AUDUSD: Key Support Tested Amid Ongoing Downtrend – Technical & Fundamental Trading Outlook
06Apr

AUDUSD: Key Support Tested Amid Ongoing Downtrend – Technical & Fundamental Trading Outlook

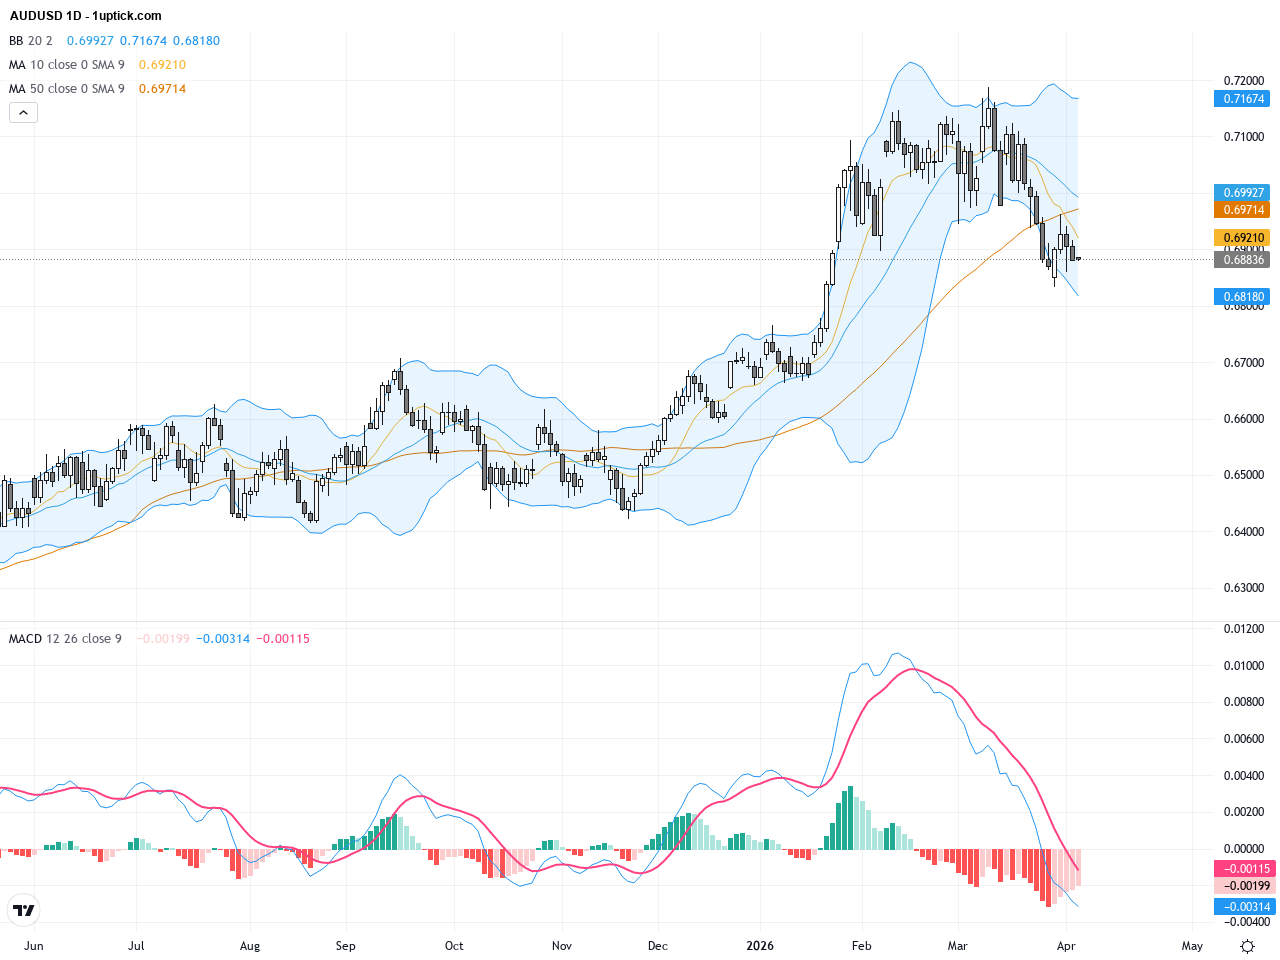
Over the past three trading days, AUDUSD has exhibited continued volatility with a downward bias, closing yesterday at 0.68872, pressured by a strong US dollar. Market mood shifted sharply after US dollar strength surged following Trump’s market-rattling speech. Despite a brief boost from hawkish RBA commentary, geopolitical risks and rising oil prices favored the USD, pushing AUDUSD lower toward a critical support level near 0.6835. For everyday investors, the prevailing environment is clearly bullish for the USD, suggesting caution and tight risk management until there is a decisive breakout or a confirmed reversal in price action.

AUDUSD Technical Outlook: Key Support at 0.6830 in Focus Amid Strong US Dollar
03Apr

AUDUSD Technical Outlook: Key Support at 0.6830 in Focus Amid Strong US Dollar

Over the past three trading days, AUDUSD has experienced significant volatility, retreating from around 0.6945 to near 0.6870, closing yesterday at 0.6907. The market mood was heavily influenced by a strong US dollar driven by political developments including President Trump’s speech, which heightened risk-off sentiment and bolstered USD strength, putting pressure on the Australian dollar. Meanwhile, rising geopolitical tensions in the Middle East have driven oil prices higher, further damping risk appetite and weighing on AUD. Despite short-term rebounds amid shifting risk sentiment, uncertainty prevails. Investors should monitor USD dynamics and geopolitical risks closely, as these will shape the upcoming AUDUSD trading outlook.

AUDUSD: Technical Patterns Signal Potential Rebound, Key Support and Resistance Levels to Watch
01Apr

AUDUSD: Technical Patterns Signal Potential Rebound, Key Support and Resistance Levels to Watch

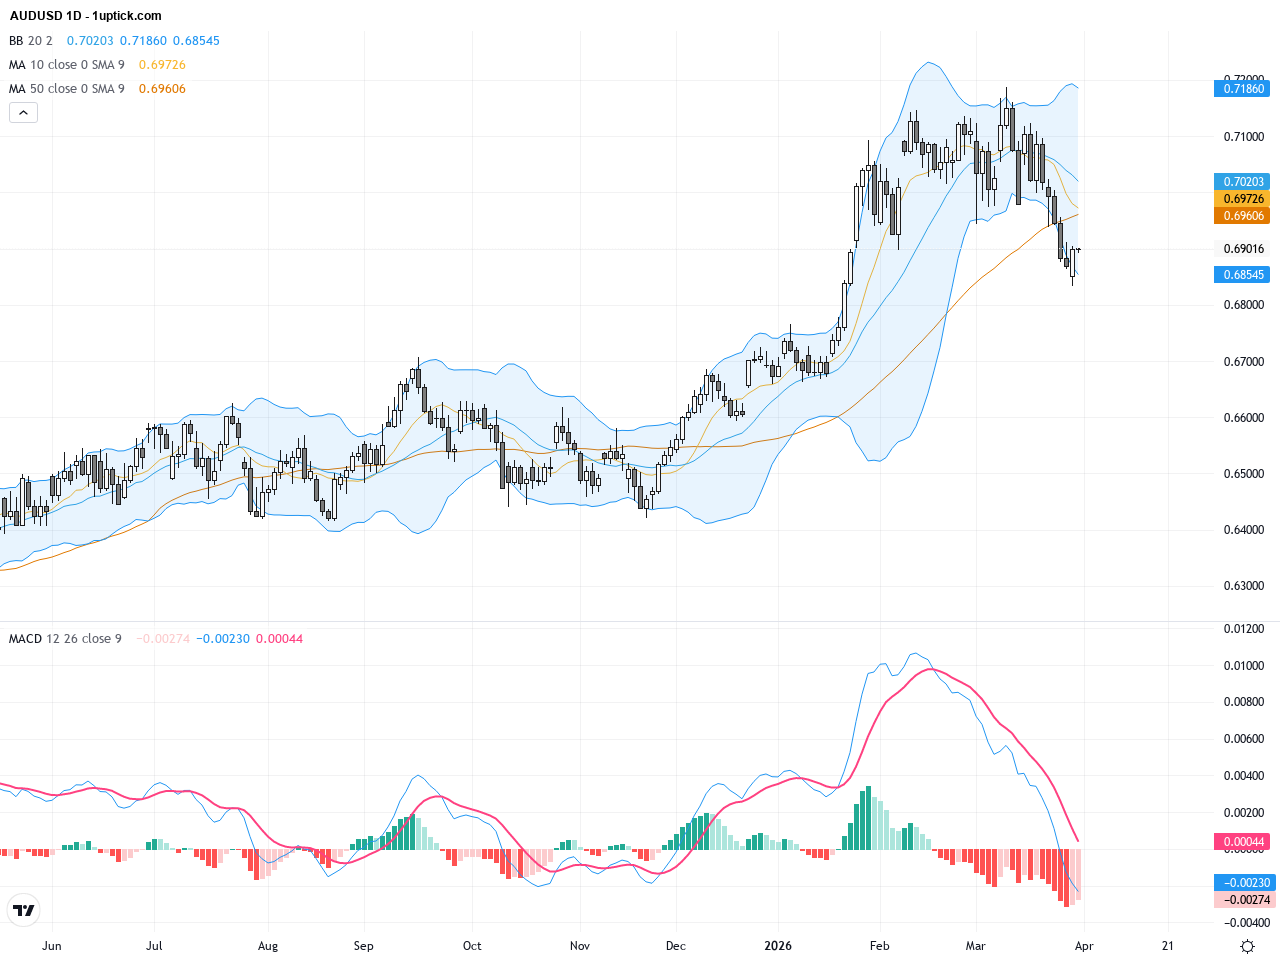
Over the past three trading days, AUDUSD experienced notable volatility with a significant rebound of 0.69% on Tuesday, closing near 0.6900, roughly unchanged from yesterday’s close at 0.69015. Renewed hopes for peace in the Middle East boosted risk appetite, driving this recovery after a five-session slide. For everyday investors, imagine receiving positive news after a tough streak, prompting a currency or stock to bounce back sharply. This shift reflects improved market sentiment for the Australian dollar. Going forward, monitoring key support and resistance levels will be crucial in navigating trading opportunities effectively.

AUDUSD: Navigating Middle East Risks Amid Key Support and Technical Patterns
30Mar

AUDUSD: Navigating Middle East Risks Amid Key Support and Technical Patterns

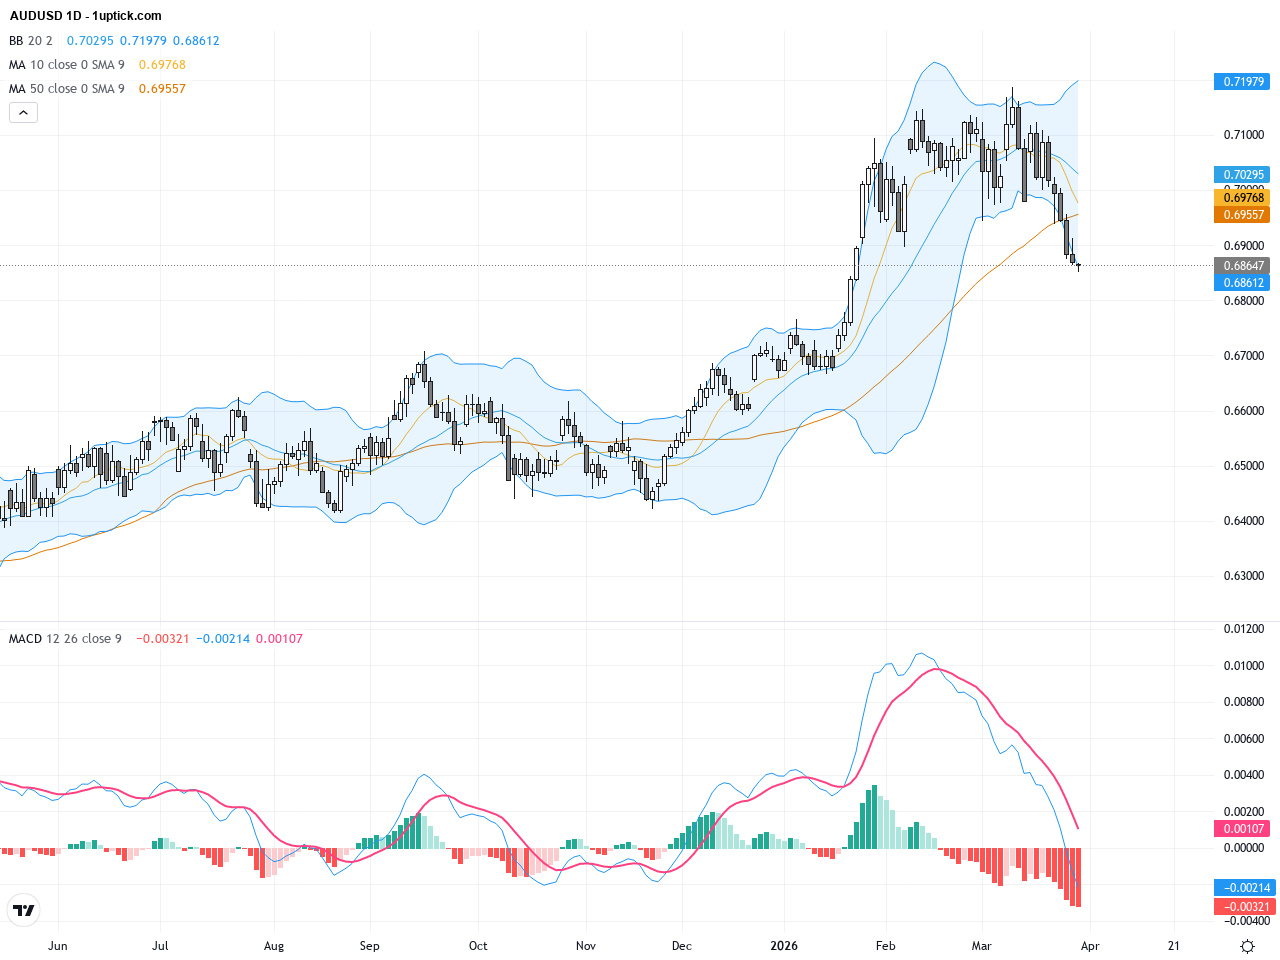
Over the past three trading days, AUDUSD has experienced notable volatility, declining about 0.27% from yesterday’s close at 0.68646. Heightened geopolitical tensions in the Middle East have been the primary driver influencing risk-sensitive currencies like the Australian dollar. News highlights show that political uncertainties have pressured commodity-linked currencies, reflected in fluctuating copper and oil prices. However, the Reserve Bank of Australia’s hawkish tone and the anticipated commodity boom driven by AI create opposing forces for the pair. For the average investor, it’s akin to navigating through a storm where staying vigilant on global developments and domestic fundamentals is crucial to understanding AUDUSD’s next directional moves.

AUDUSD: Technical Consolidation Signals Critical Support and Resistance Levels
27Mar

AUDUSD: Technical Consolidation Signals Critical Support and Resistance Levels

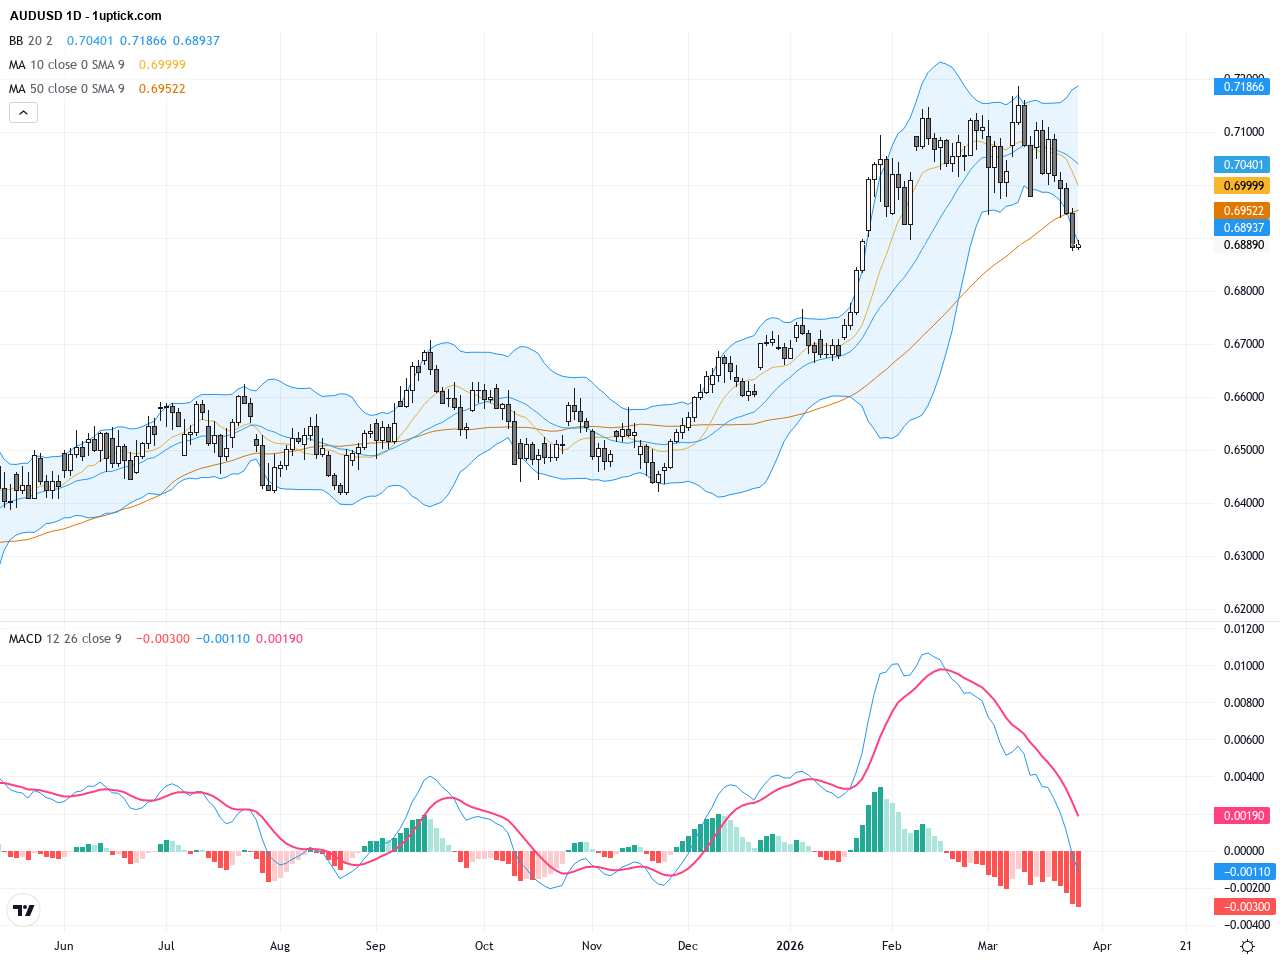
Over the past three trading days, AUDUSD experienced heightened volatility, dropping from around 0.695 to a close near 0.68886, pressured by mixed Australian inflation data and global risk sentiment shifts. Rising geopolitical tensions, particularly in the Middle East, strengthened the US dollar, adding bearish pressure to AUDUSD. The market mood reflects cautious skepticism about peace prospects, fueling dollar strength and prompting a technical squeeze between 0.6980 and 0.7070. For everyday investors, this means staying alert to potential volatility driven by geopolitical events and economic data, focusing on the key support around 0.688 and resistance zone from 0.698 to 0.707 to gauge the next directional move.

AUDUSD: AI Commodity Boom Drives Australian Dollar Rally with Key Technical Patterns in Play
25Mar

AUDUSD: AI Commodity Boom Drives Australian Dollar Rally with Key Technical Patterns in Play

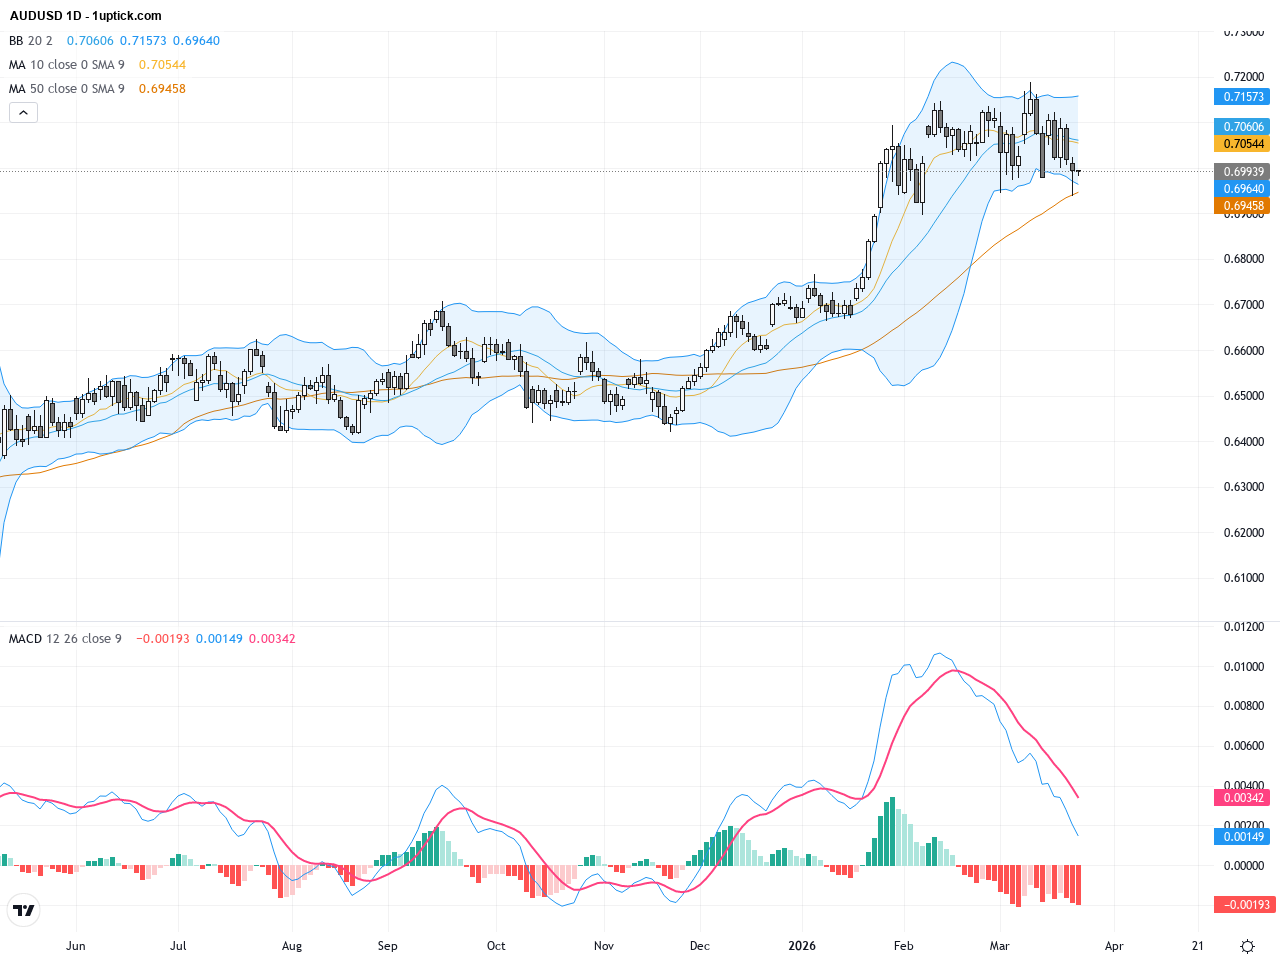
The AUDUSD currency pair has shown resilient volatility near yesterday’s closing price of 0.69939, influenced by geopolitical tensions around the Strait of Hormuz and an upgraded Australian dollar outlook by Barclays. Over the past three trading days, the Australian dollar gained support from rising commodity demand and positive domestic economic signals. Barclays highlighted the accelerating AI-driven commodity boom as a key bullish driver for the Aussie. For the average investor, this means amid recovering global risk appetite, the AUD is positioned well to benefit from commodity strength and economic improvement, suggesting a potential for steady upward moves in the near term. Traders should watch the 0.6944 support level closely alongside evolving geopolitical dynamics.

1 10 11 12 13 14 19

1uptick Analytics @

Risk Warning​

*Investment involves risk. You may use the information, strategies and trading signals on this website for academic and reference purposes at your own discretion. 1uptick cannot and does not guarantee that any current or future buy or sell comments and messages posted on this website/app will be profitable. Past performance is not necessarily indicative of future performance. It is impossible for 1uptick to make such guarantees and users should not make such assumptions. Readers should seek independent professional advice before executing a transaction. 1uptick will not solicit any subscribers or visitors to execute any transactions, and you are responsible for all executed transactions.

© 2022-26 1uptick Analytics all rights reserved.


Risk Warning​

*Investment involves risk. You may use the information, strategies and trading signals on this website for academic and reference purposes at your own discretion. 1uptick cannot and does not guarantee that any current or future buy or sell comments and messages posted on this website/app will be profitable. Past performance is not necessarily indicative of future performance. It is impossible for 1uptick to make such guarantees and users should not make such assumptions. Readers should seek independent professional advice before executing a transaction. 1uptick will not solicit any subscribers or visitors to execute any transactions, and you are responsible for all executed transactions.

© 1uptick Analytics all rights reserved.

Home
.AI
Analysis
Calendar
Tools