AUDUSD Technical Analysis

Home  Technical Analysis  AUDUSD Technical Analysis
AUDUSD
AUDUSD: AI Commodity Boom Drives Australian Dollar Rally with Key Technical Patterns in Play
25Mar

AUDUSD: AI Commodity Boom Drives Australian Dollar Rally with Key Technical Patterns in Play

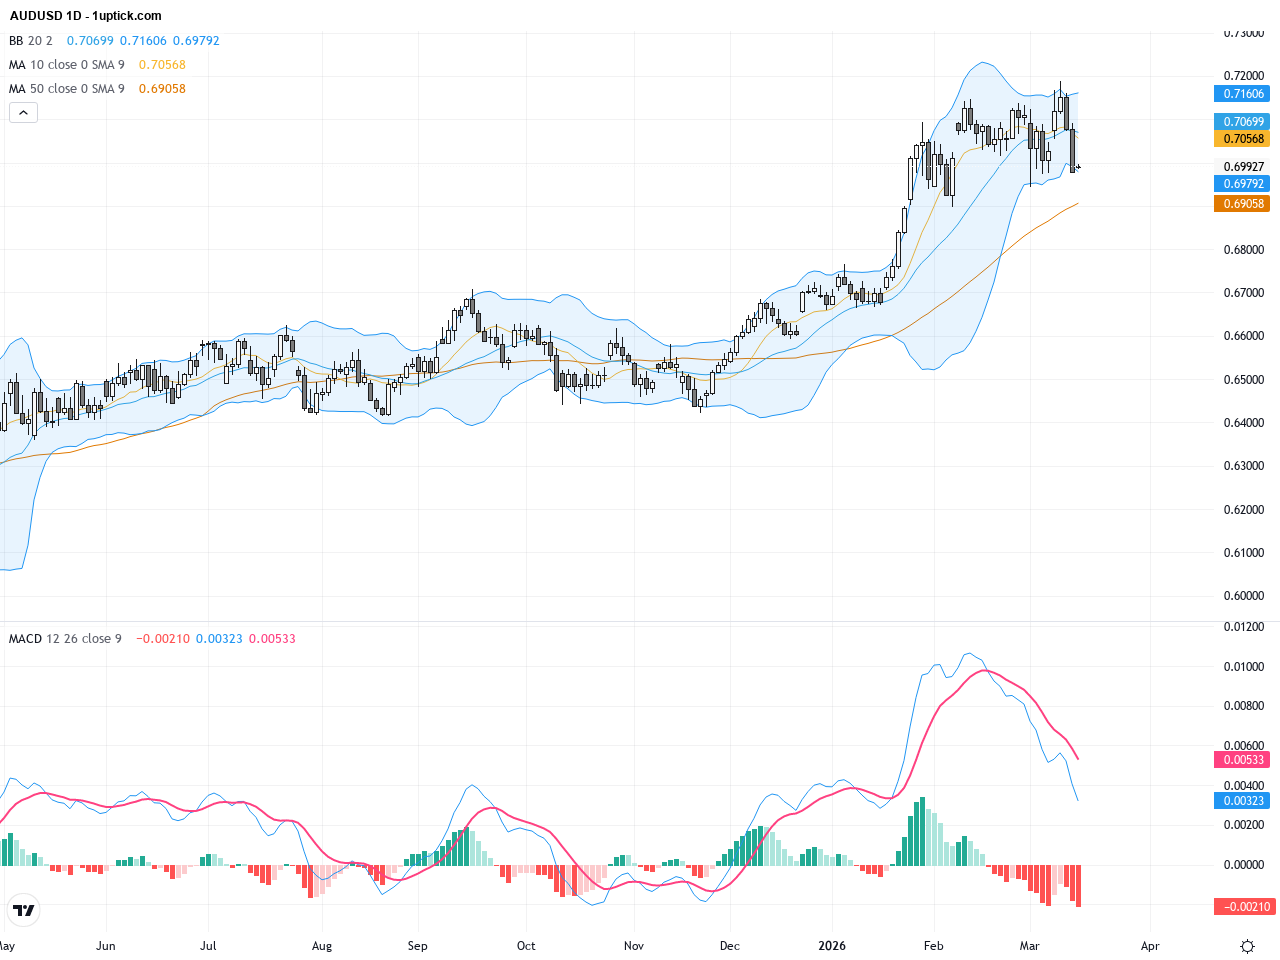
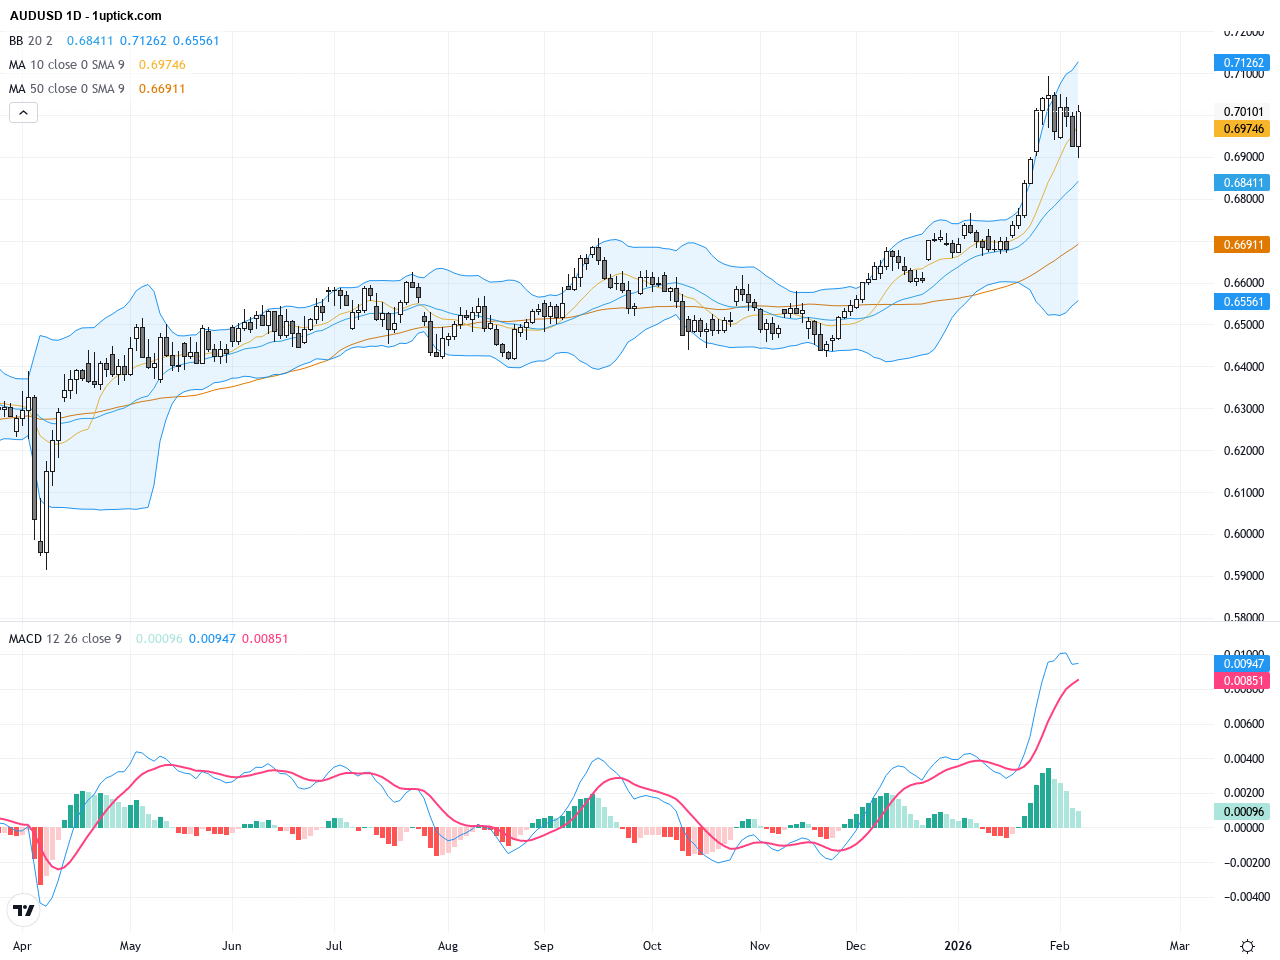
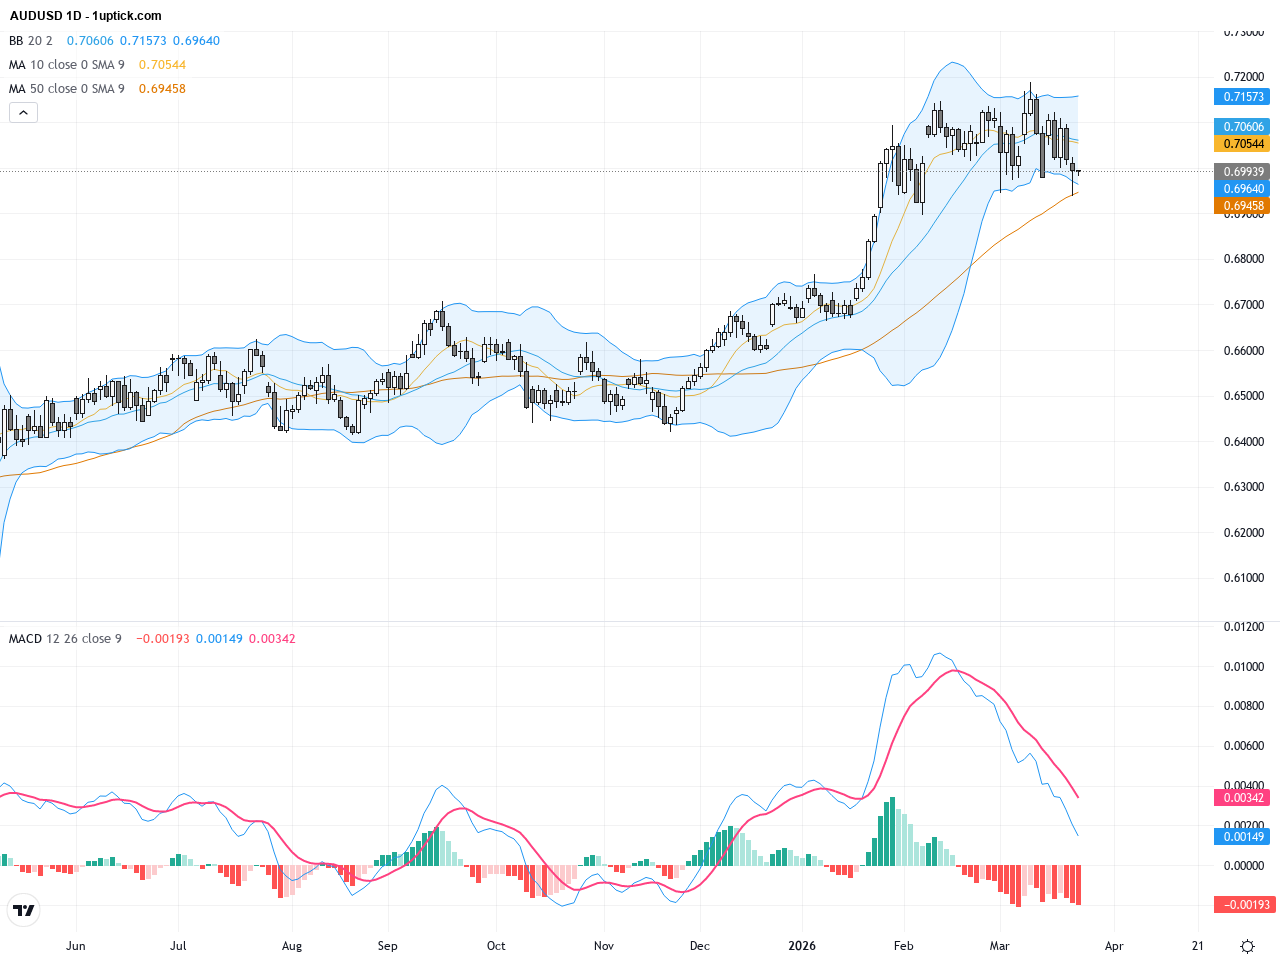
The AUDUSD currency pair has shown resilient volatility near yesterday’s closing price of 0.69939, influenced by geopolitical tensions around the Strait of Hormuz and an upgraded Australian dollar outlook by Barclays. Over the past three trading days, the Australian dollar gained support from rising commodity demand and positive domestic economic signals. Barclays highlighted the accelerating AI-driven commodity boom as a key bullish driver for the Aussie. For the average investor, this means amid recovering global risk appetite, the AUD is positioned well to benefit from commodity strength and economic improvement, suggesting a potential for steady upward moves in the near term. Traders should watch the 0.6944 support level closely alongside evolving geopolitical dynamics.
AUDUSD Technical and Fundamental Analysis: Watch the Key 0.7000 Support Amid Hormuz Strait Risks
23Mar

AUDUSD Technical and Fundamental Analysis: Watch the Key 0.7000 Support Amid Hormuz Strait Risks

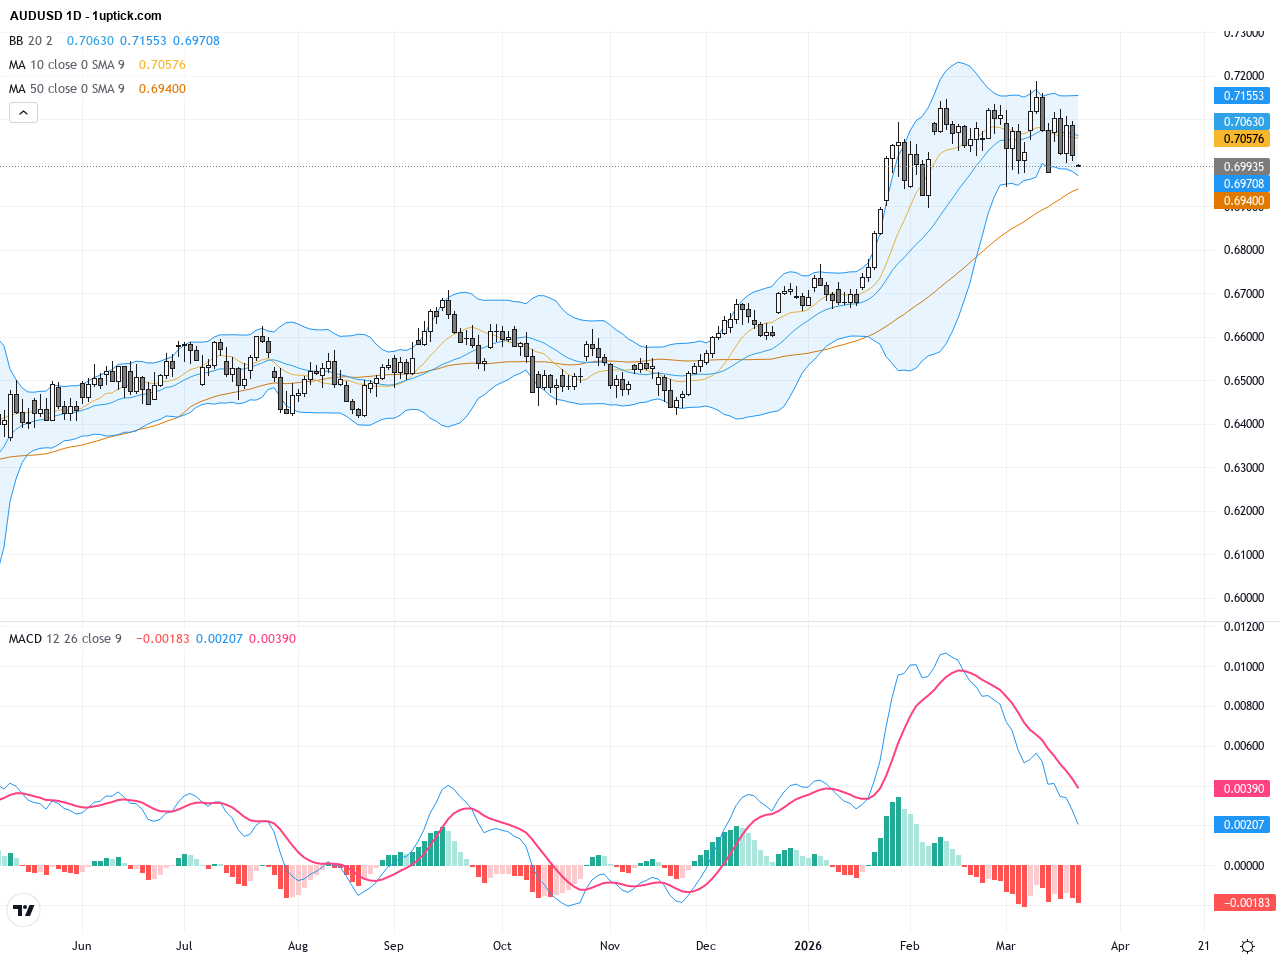
Over the past three trading days, AUDUSD has experienced significant volatility, closing yesterday at 0.69935, down about 1.3% from the previous day. Geopolitical tensions in the Strait of Hormuz have triggered risk aversion, boosting the US dollar and breaking AUD/USD’s six-week winning streak. Despite this, a hawkish RBA stance and resilient domestic economic data have supported the Australian dollar, helping it maintain relative strength amid pressure. This dual influence reflects investor sensitivity to geopolitical uncertainty and central bank policy expectations, presenting a cautious but resilient outlook. Retail investors may view this as a defensive test for AUD in a volatile environment, suggesting close attention to key support levels.

AUDUSD: Bullish Momentum Gaining After 50-day SMA Breakout with Eyes on 0.7100
20Mar

AUDUSD: Bullish Momentum Gaining After 50-day SMA Breakout with Eyes on 0.7100

Over the past three trading days, AUDUSD has shown notable volatility, closing yesterday at 0.70868, an increase of approximately 0.74%. Weakening USD and commodity price shifts, particularly a decline in crude oil, have supported the Aussie. Recent market updates highlight a bullish outlook above the 50-day simple moving average, targeting the 0.7100 resistance level despite expectations that the Fed will delay rate cuts until 2027. For average investors, this translates into an opportunity where the AUD is poised to show stronger upside momentum amid a softer dollar and strengthening commodity prices. Traders should monitor critical technical support and resistance to capture potential next moves.

AUDUSD: Bullish Rebound Supported by Hawkish RBA and Strong Technical Patterns
18Mar

AUDUSD: Bullish Rebound Supported by Hawkish RBA and Strong Technical Patterns

Over the past three trading days, AUDUSD has displayed a robust rebound, closing yesterday at 0.71018, slightly below the prior day. The Australian dollar rallied on the back of hawkish Reserve Bank of Australia (RBA) signals and a global recovery in risk appetite, despite a slightly softer US dollar. Market news highlights the impact of RBA deputy governor Bullock’s hawkish comments and commodity strength bolstering the pair. For average investors, this means AUD is benefiting short-term from Australia’s high interest rate environment combined with improving market sentiment, suggesting close monitoring of key technical support levels and global economic data for optimal trading opportunities.

AUDUSD Technical and Fundamental Analysis: Retesting 0.7070 Support Amid Market Volatility
16Mar

AUDUSD Technical and Fundamental Analysis: Retesting 0.7070 Support Amid Market Volatility

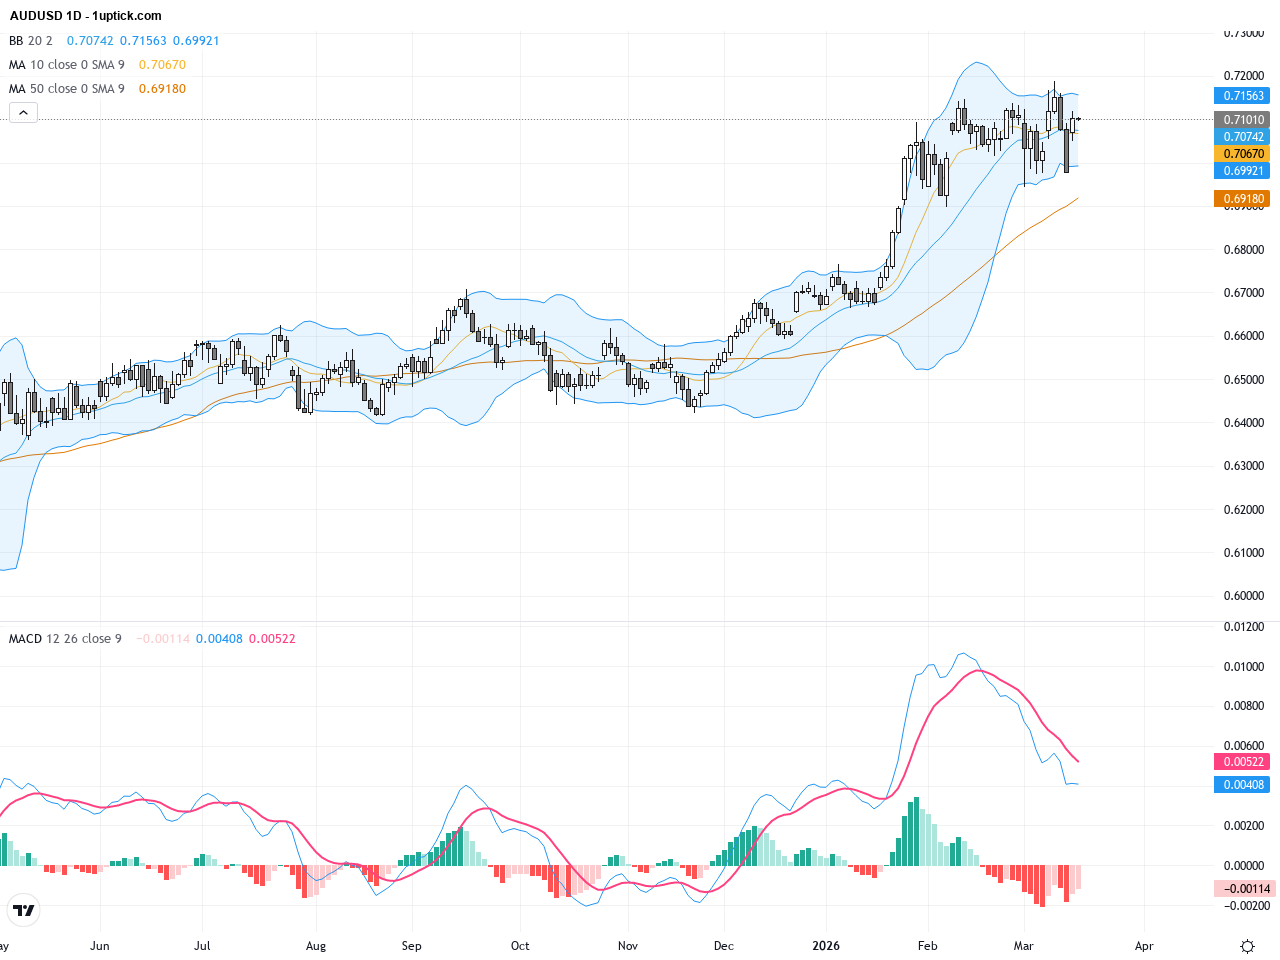
Over the past three trading days, AUDUSD has shown marked volatility, closing at 0.69932 yesterday, down about 1.17% from the previous close of 0.70761. The turmoil in the Hormuz Strait triggered a surge in USD safe-haven demand, pressuring the Australian dollar. Meanwhile, hawkish bets on the Reserve Bank of Australia (RBA) hiking rates remain strong, with approximately 78% chance of further hikes, creating a tug-of-war between risk appetite and safety. This driven fluctuation is reflected in AUDUSD’s short-term choppy movement. For the average investor, this means staying alert to geopolitical developments and central bank signals, managing risk carefully while exploring buying opportunities at key support levels.

1 13 14 15 16 17 23
AUDUSD: Strong Jobs Data Fuels Bullish Momentum With Golden Cross Formation
20Feb

AUDUSD: Strong Jobs Data Fuels Bullish Momentum With Golden Cross Formation

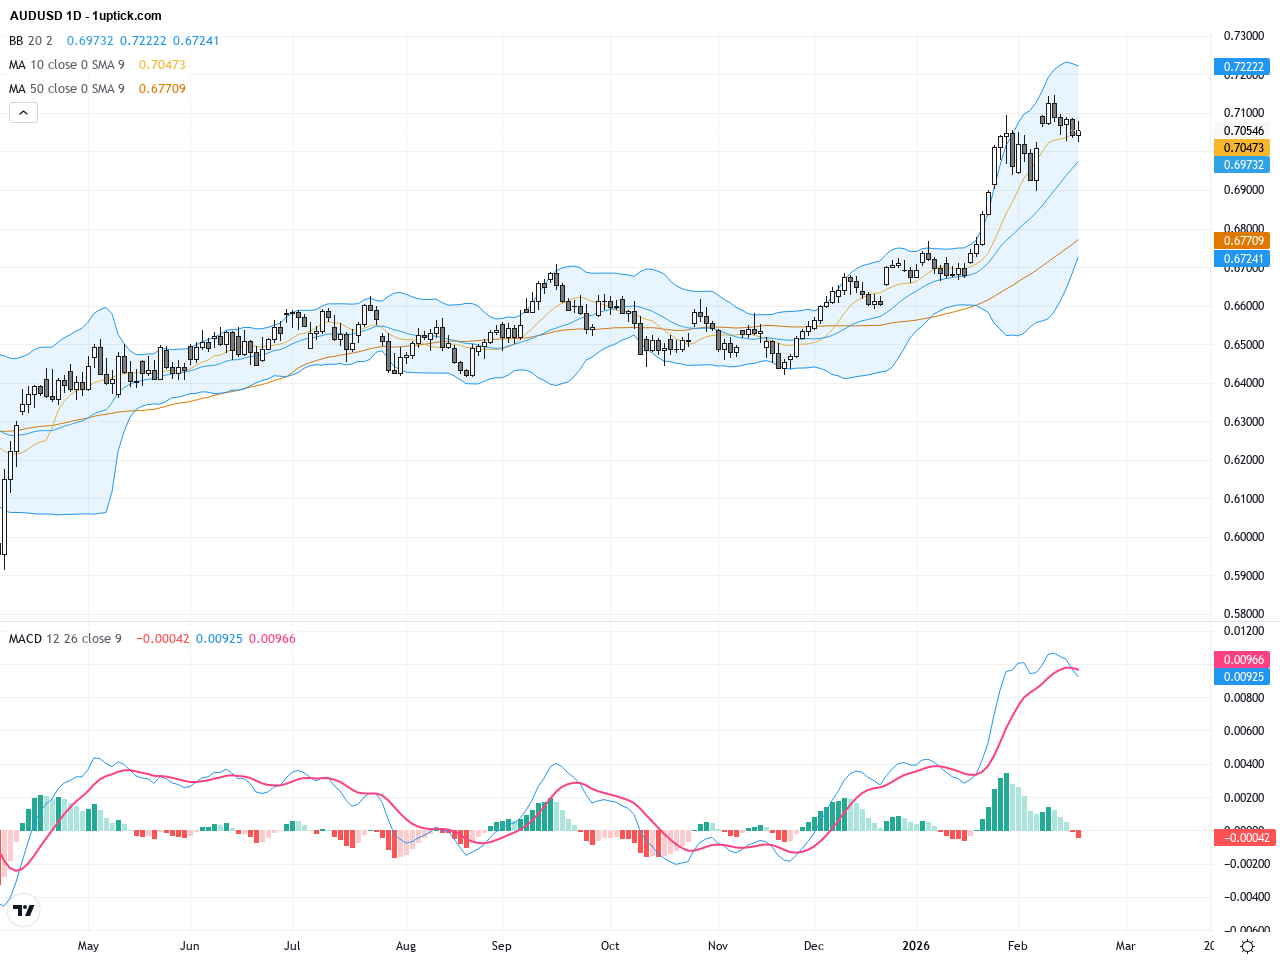
Over the past three trading days, AUDUSD has shown resilient strength, buoyed by robust Australian jobs data, pushing the pair close to 0.70546. Rising market expectations for further rate hikes from the Reserve Bank of Australia (RBA) have limited downside risks. This positive sentiment is supported by steady unemployment rates and a strong labour market. For the average investor, the Aussie dollar’s strengthening fundamentals signal an attractive short-term opportunity amidst global market uncertainties.

AUDUSD: Key Golden Cross Signals Short-Term Pullback Risk with Vital Trading Outlook
18Feb

AUDUSD: Key Golden Cross Signals Short-Term Pullback Risk with Vital Trading Outlook

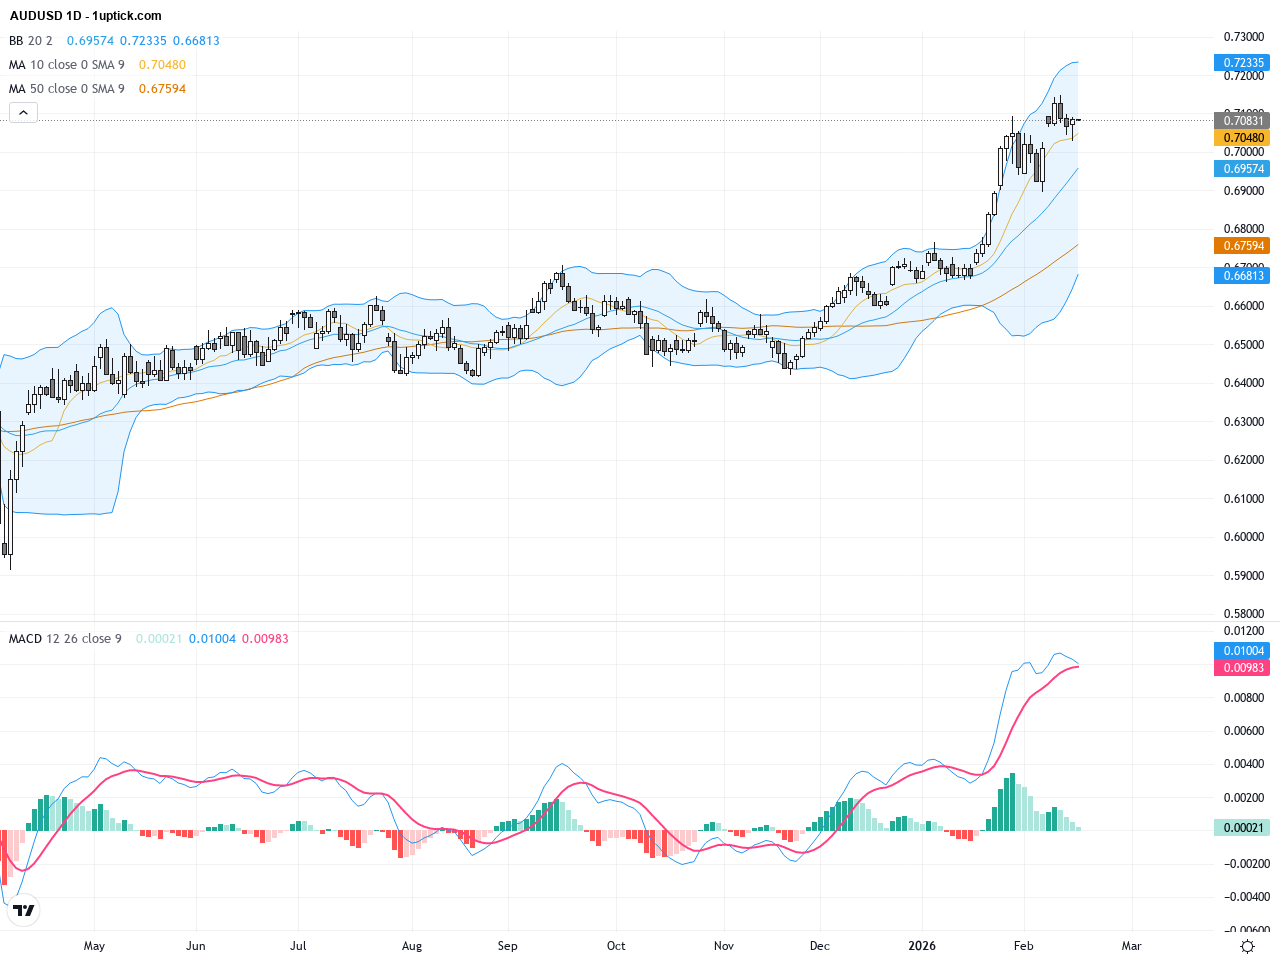
Over the past three trading days, AUDUSD has shown significant volatility after closing at 0.70853 yesterday. The market reacted to concerns over global risk appetite and the Reserve Bank of Australia’s (RBA) minutes, which kept a cautious policy tone without new stimulus signals, causing the Australian Dollar to weaken around 0.4%. Meanwhile, weak U.S. retail sales reinforced expectations for a stronger US dollar. This mixed sentiment has seen AUDUSD hover near 0.7050, reflecting investor caution. For average investors, such market reactions to key data releases underscore the importance of risk management. This report integrates recent market news with technical patterns to provide a clear trading outlook and key support/resistance levels to help you navigate upcoming opportunities.

AUDUSD: Rate Hike Spurs Bullish Momentum Amid Hawkish RBA Outlook
09Feb

AUDUSD: Rate Hike Spurs Bullish Momentum Amid Hawkish RBA Outlook

Over the past three trading days, AUDUSD has shown notable volatility, climbing from an opening of 0.69258 to a close at 0.70136. This movement reflects the market’s positive reaction to the Reserve Bank of Australia’s first rate hike in two years, raising rates by 25 basis points. While the US Dollar Index occasionally shows signs of weakness, ongoing hawkish signals from the Fed continue to pressure the pair. Global equities and commodity price fluctuations have influenced risk sentiment surrounding AUDUSD, creating a tug-of-war scenario. Investors should consider these rate changes and dollar dynamics carefully, focusing on support and resistance levels to navigate the trading outlook effectively.

AUDUSD Breaks 0.70 Barrier: Inflation and China’s Policy Shift Driving Aussie Surge
30Jan

AUDUSD Breaks 0.70 Barrier: Inflation and China’s Policy Shift Driving Aussie Surge

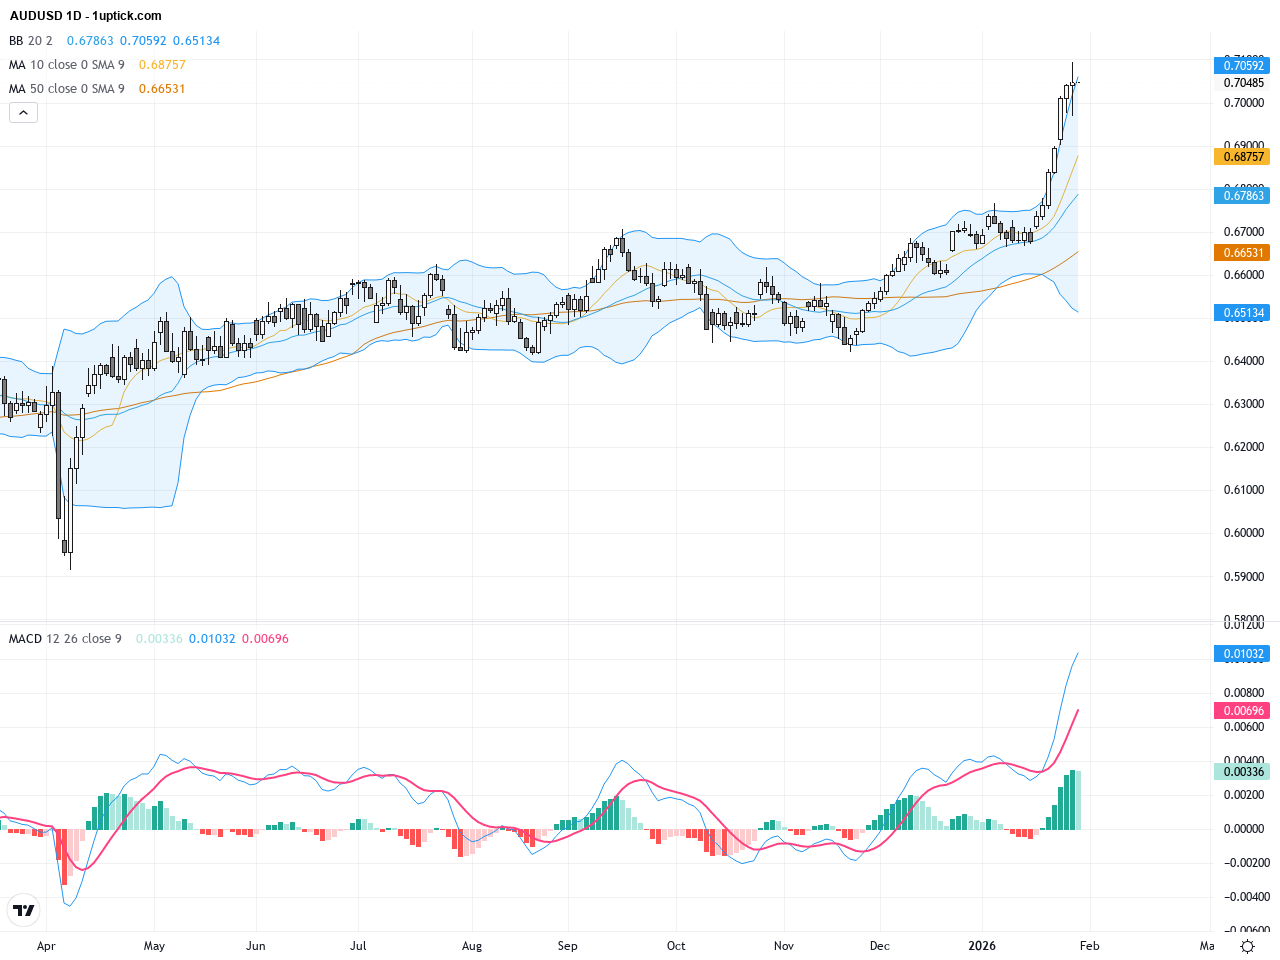
Over the past three trading days, AUDUSD has shown remarkable strength, climbing from around 0.6930 to an intraday high of 0.7090, with yesterday’s close at 0.70475. The pairing’s rally is fueled by robust Australian inflation data alongside China’s property market policy adjustments, which have boosted demand for the Aussie. Simultaneously, a dovish Fed has weakened the US dollar, providing additional tailwinds. This confluence of fundamental drivers is mirrored in a clear bullish technical setup, making AUDUSD an attractive opportunity for both active traders and long-term investors. In short, inflation data and geopolitical pivots have been the catalyst behind the recent price surge and will continue to shape the AUDUSD trading outlook.

AUDUSD: Strong Technical Breakout Signals Bullish Momentum Near Key Resistance
28Jan

AUDUSD: Strong Technical Breakout Signals Bullish Momentum Near Key Resistance

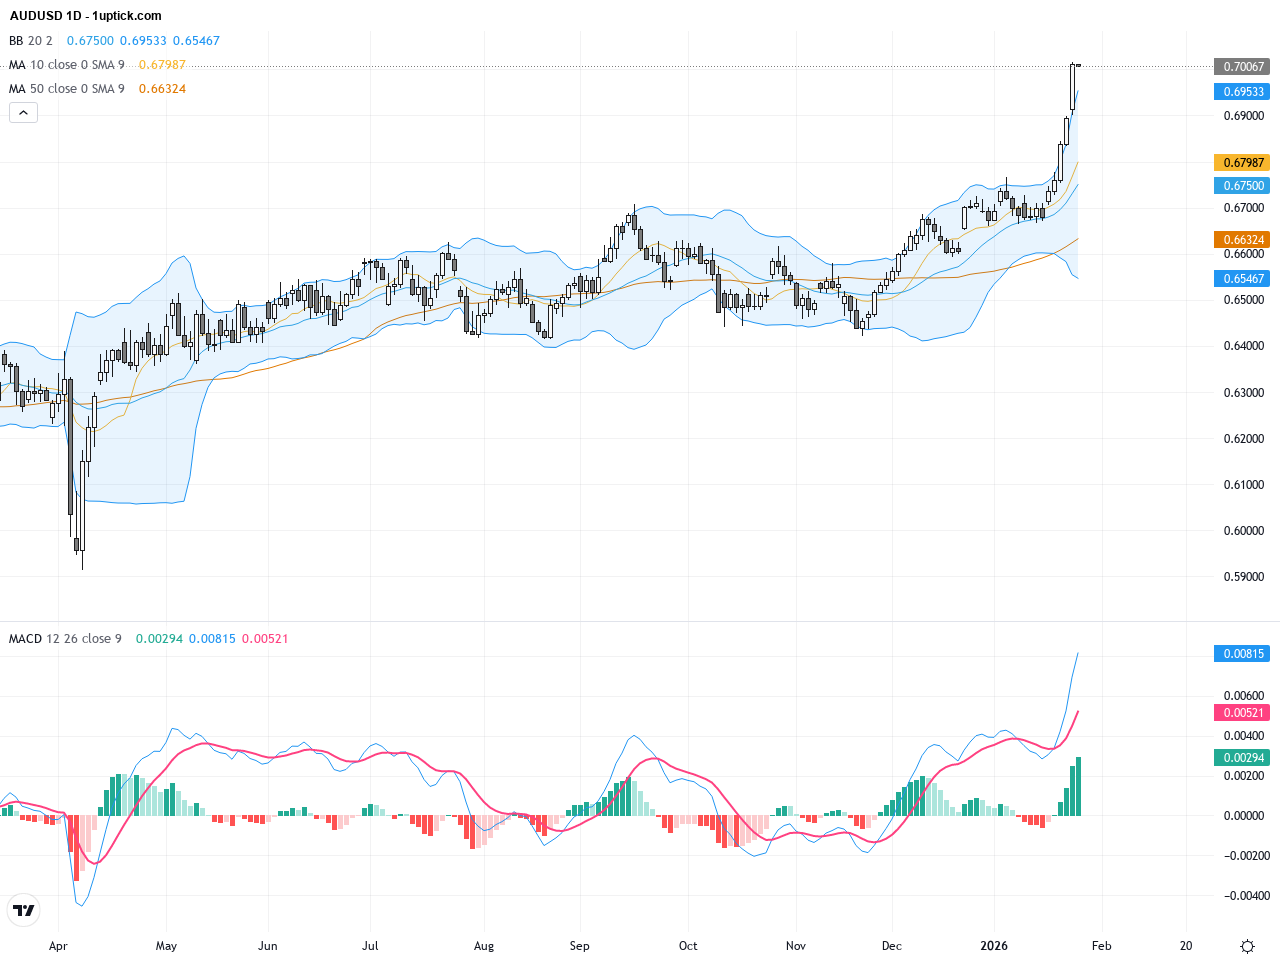
Over the past three trading days, AUDUSD has seen notable bullish momentum, climbing steadily from the 0.6900 level to close yesterday at 0.70067. The rise reflects weakening US dollar sentiment alongside a resurgence in global risk appetite. Recent news highlights central bank interventions in the USD/JPY carry trade, contributing to macro stability, while strong Australian employment data and positive economic forecasts boost AUD demand. For the average investor, this means the Australian dollar is poised to maintain its strength in the near term. Traders should monitor key technical support and resistance levels closely for upcoming trading opportunities.

AUDUSD: Bullish Breakout Near 16-Month High Signals Continued Upside Momentum
28Jan

AUDUSD: Bullish Breakout Near 16-Month High Signals Continued Upside Momentum

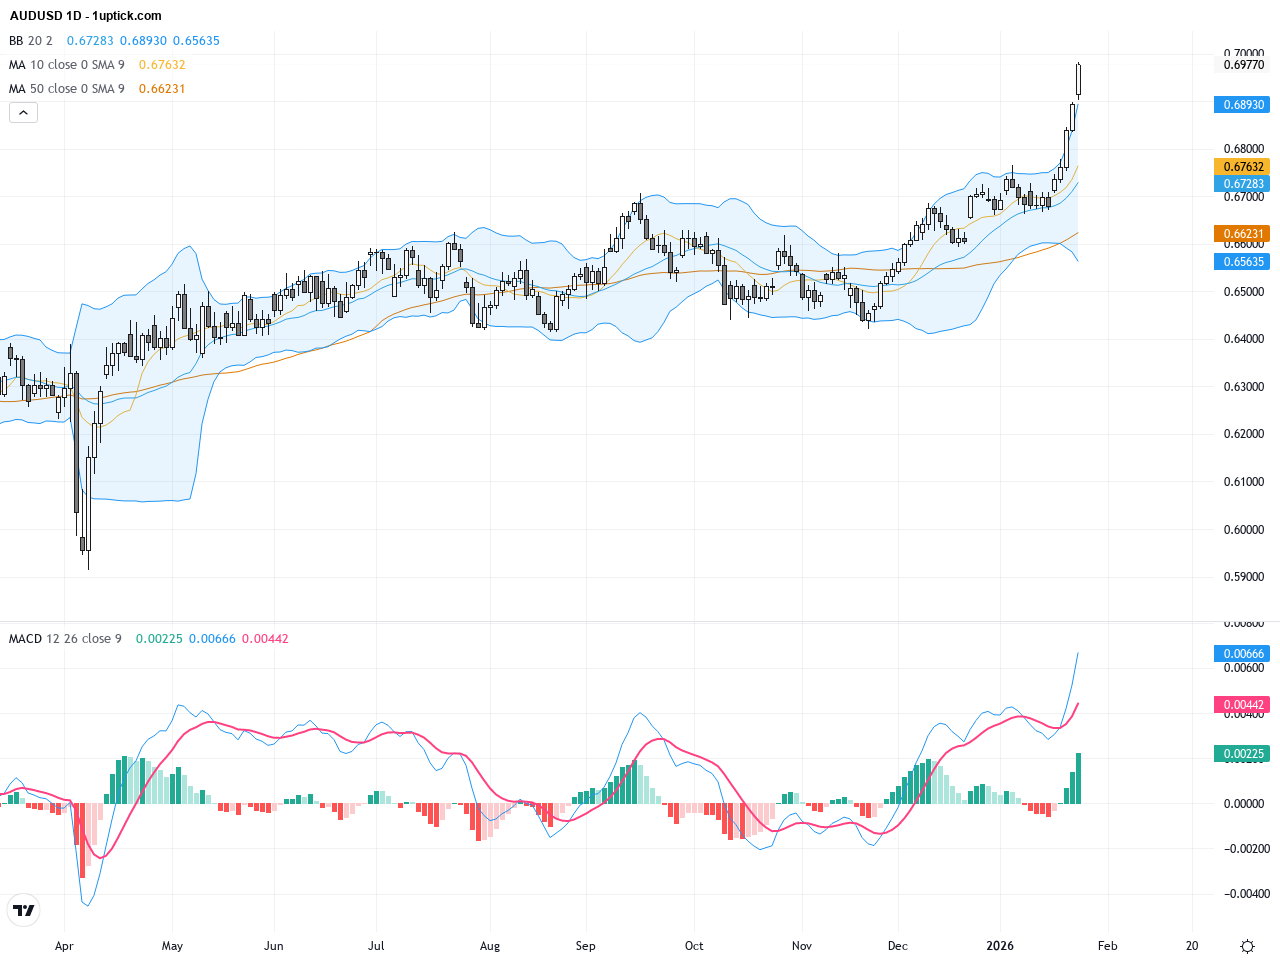
AUDUSD has seen solid gains over the past three trading days, maintaining a position above 0.6900 and closing yesterday at 0.6977, marking its highest level in 16 months. The rally is fueled by strong Australian employment data and a softer US dollar, lifted further by positive risk sentiment and favorable monetary policy considerations. Several market reports highlight the upward trend, reflecting renewed confidence in the Australian economy amid global shifts. For average investors, this trend represents an opportunity driven by a mix of improving fundamentals and technical strength. Market players should continue to monitor key support and resistance levels to gauge future price moves.

1 13 14 15 16 17 19

1uptick Analytics @

Risk Warning​

*Investment involves risk. You may use the information, strategies and trading signals on this website for academic and reference purposes at your own discretion. 1uptick cannot and does not guarantee that any current or future buy or sell comments and messages posted on this website/app will be profitable. Past performance is not necessarily indicative of future performance. It is impossible for 1uptick to make such guarantees and users should not make such assumptions. Readers should seek independent professional advice before executing a transaction. 1uptick will not solicit any subscribers or visitors to execute any transactions, and you are responsible for all executed transactions.

© 2022-26 1uptick Analytics all rights reserved.


Risk Warning​

*Investment involves risk. You may use the information, strategies and trading signals on this website for academic and reference purposes at your own discretion. 1uptick cannot and does not guarantee that any current or future buy or sell comments and messages posted on this website/app will be profitable. Past performance is not necessarily indicative of future performance. It is impossible for 1uptick to make such guarantees and users should not make such assumptions. Readers should seek independent professional advice before executing a transaction. 1uptick will not solicit any subscribers or visitors to execute any transactions, and you are responsible for all executed transactions.

© 1uptick Analytics all rights reserved.

Home
.AI
Analysis
Calendar
Tools