2025-02-24 @ 16:55
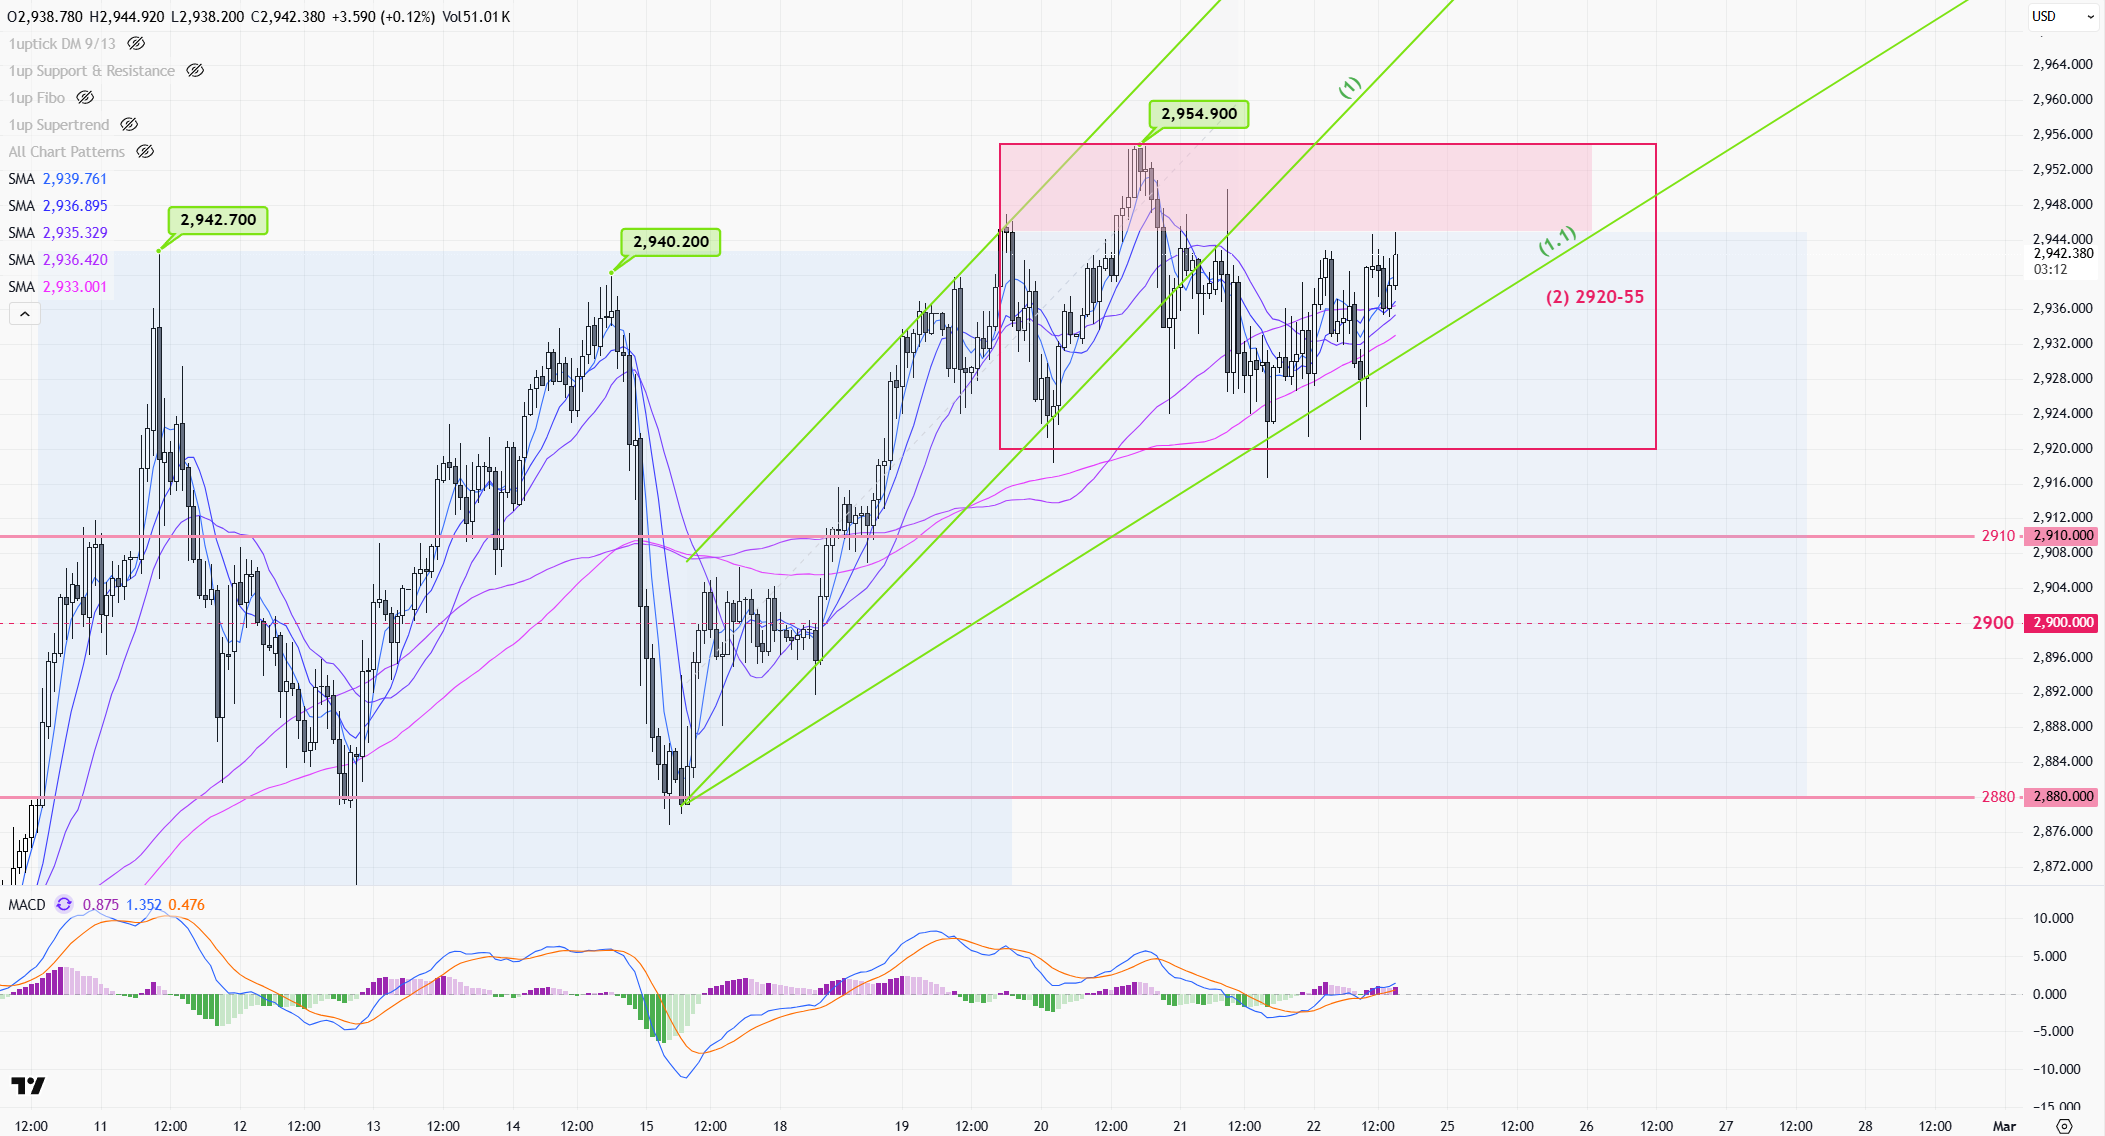
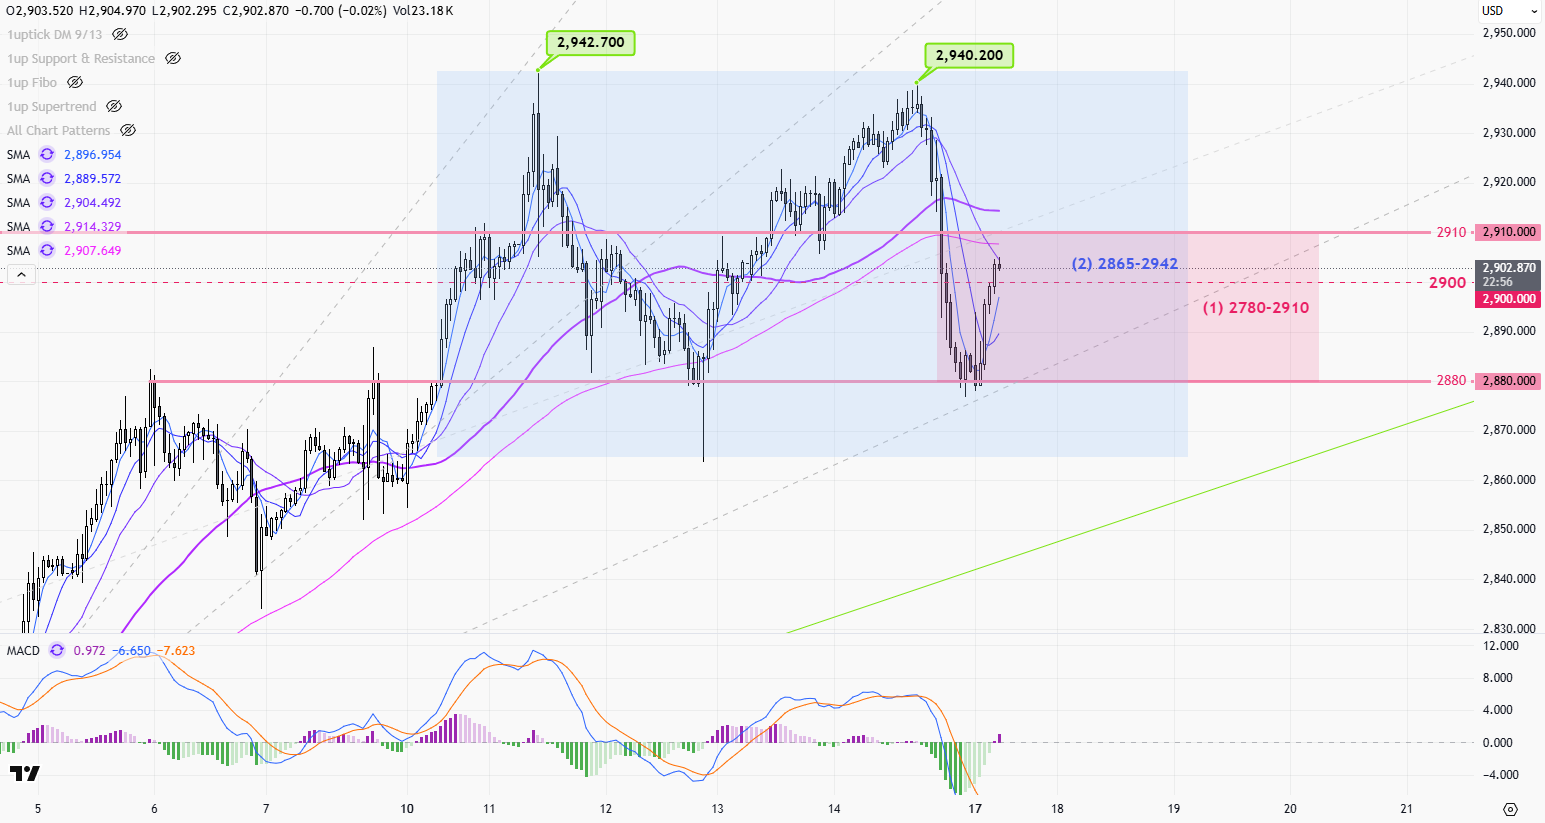
Gold prices continue to fluctuate near record highs. Early last week, the market was again driven by uncertainty over Trump’s tariff policy, hitting a new high of 2942. It was pushed toward 2863 by stronger-than-expected US inflation data on Wednesday, but the price rebounded quickly to 2940 before the U.S. session on Friday. As the peace talks began between Russia and the US, the geopolitical situation eased, profit taking/short-selling hit the market where the gold prices closed below 2900 near 2880.
The gold market will still be under the influence of Trump’s new economic policy this week. However, unless a more aggressive policy is introduced, the market is starting to adapt to the current market condition after nearly four weeks of news turmoil. With the prospect of a truce between Russia and Ukraine, it should be difficult for gold prices to hit a new high in the short term.
>
1-hr chart(above) > Monday is a U.S. holiday, the price should be bounded by the range of 2780-2910 (1). Later this week, a wider range can be expected between 2865-and 2942, and wait for the breakout before the next round of major trends.
>
Daily chart(above) > The 10-day moving average (3) dip-buying strategy mentioned last week is still valid. Note that last Friday’s sharp one-day pullback reflects the bear is starting to take control of the market, and it is important to be careful of a significant correction in the market this week. The breakout of the 10 days MA(3) will be the start of a bearish trend on the daily chart.
P. To
2025-02-24 @ 00:46
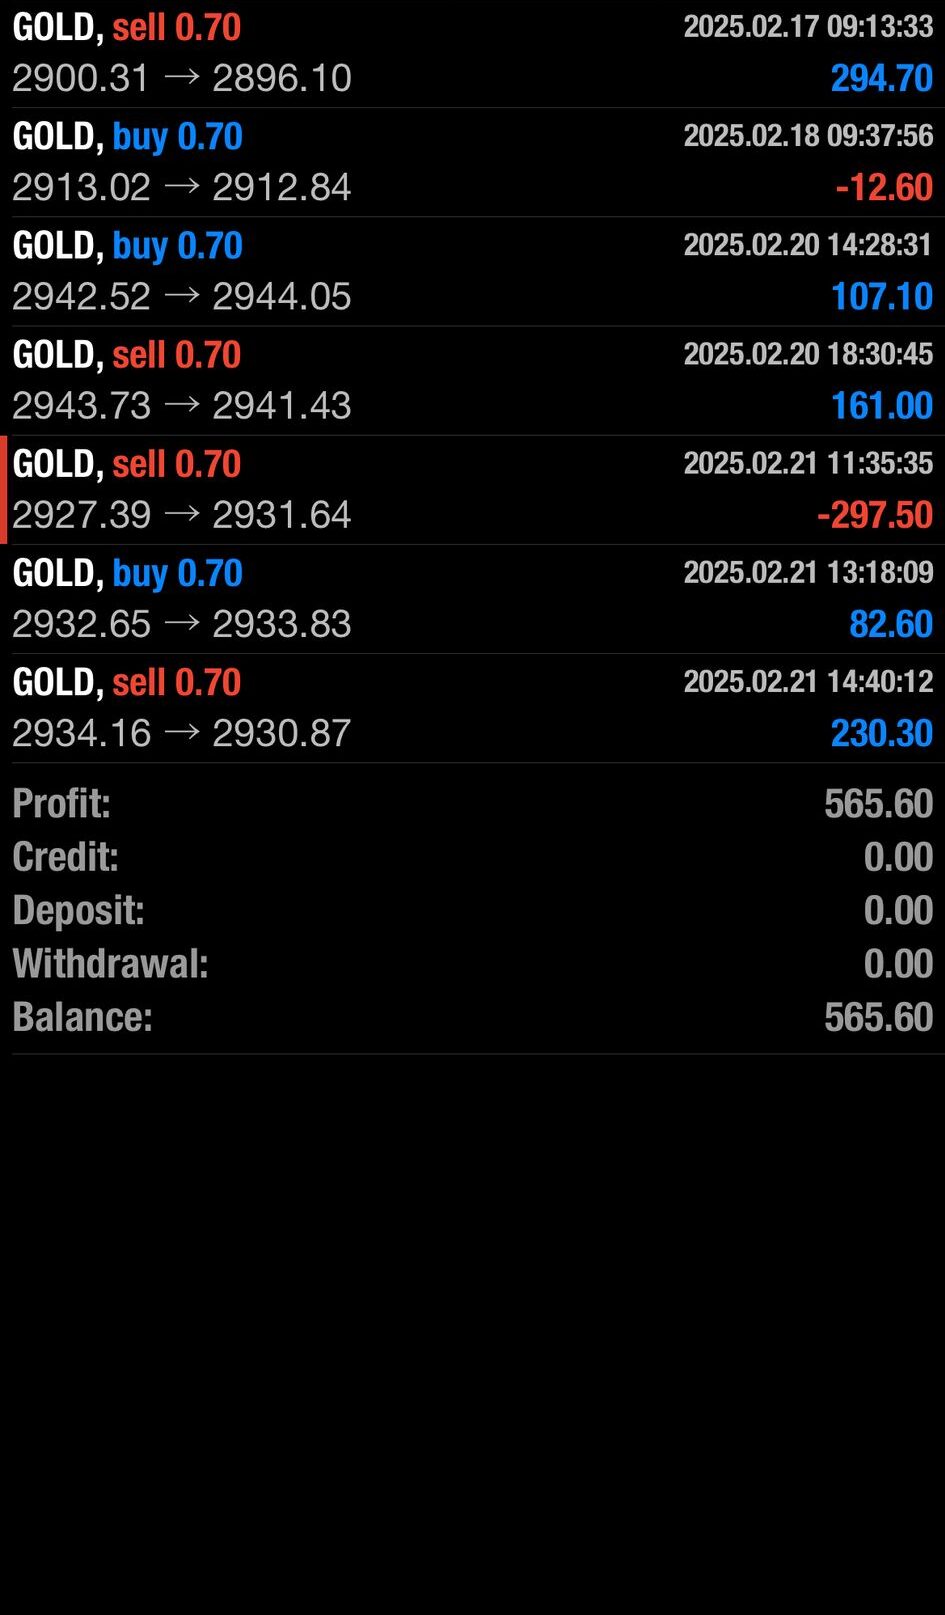
+US$565.60 2025 2.17-20252.21
2025-02-23 @ 15:52
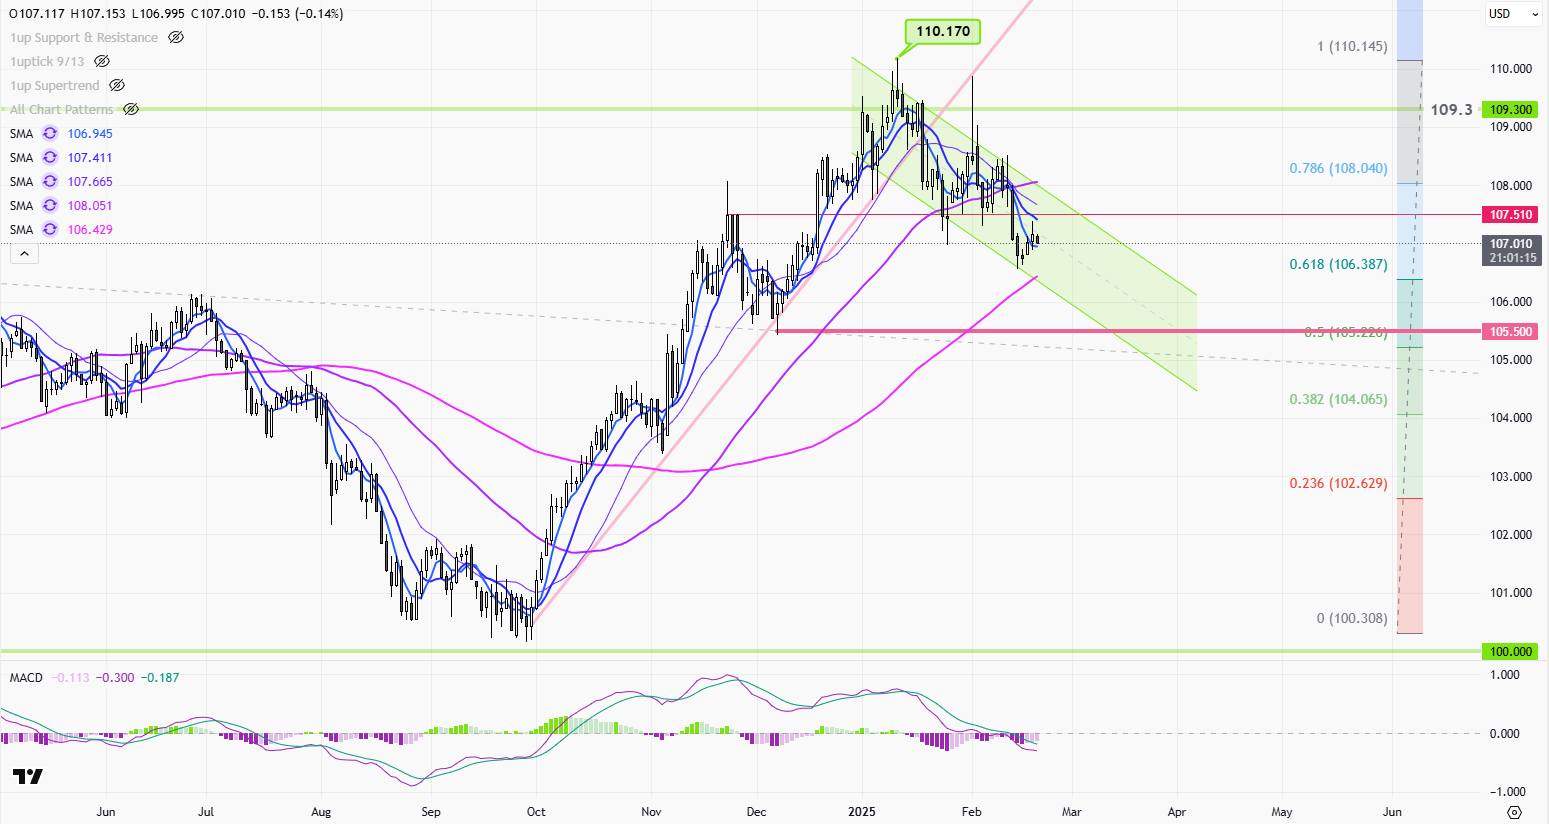
Price Movement The USD Index daily chart shows a recent period of volatility with notable price shifts. Initially, the index experienced an upward trend, reaching a peak near 110.170. This rise was followed by a pullback, as sellers gained control, leading to increased bearish sentiment. The chart indicates a series of lower highs and lower […]
2025-02-17 @ 17:26
Gold prices continue to fluctuate near record highs. Early last week, the market was again driven by uncertainty over Trump’s tariff policy, hitting a new high of 2942. It was pushed toward 2863 by stronger-than-expected US inflation data on Wednesday, but the price rebounded quickly to 2940 before the U.S. session on Friday. As the peace talks began between Russia and the US, the geopolitical situation eased, profit taking/short-selling hit the market where the gold prices closed below 2900 near 2880.
The gold market will still be under the influence of Trump’s new economic policy this week. However, unless a more aggressive policy is introduced, the market is starting to adapt to the current market condition after nearly four weeks of news turmoil. With the prospect of a truce between Russia and Ukraine, it should be difficult for gold prices to hit a new high in the short term.
>
1-hr chart(above) > Monday is a U.S. holiday, the price should be bounded by the range of 2780-2910 (1). Later this week, a wider range can be expected between 2865-and 2942, and wait for the breakout before the next round of major trends.
>
Daily chart(above) > The 10-day moving average (3) dip-buying strategy mentioned last week is still valid. Note that last Friday’s sharp one-day pullback reflects the bear is starting to take control of the market, and it is important to be careful of a significant correction in the market this week. The breakout of the 10 days MA(3) will be the start of a bearish trend on the daily chart.
P. To
2025-02-10 @ 14:21
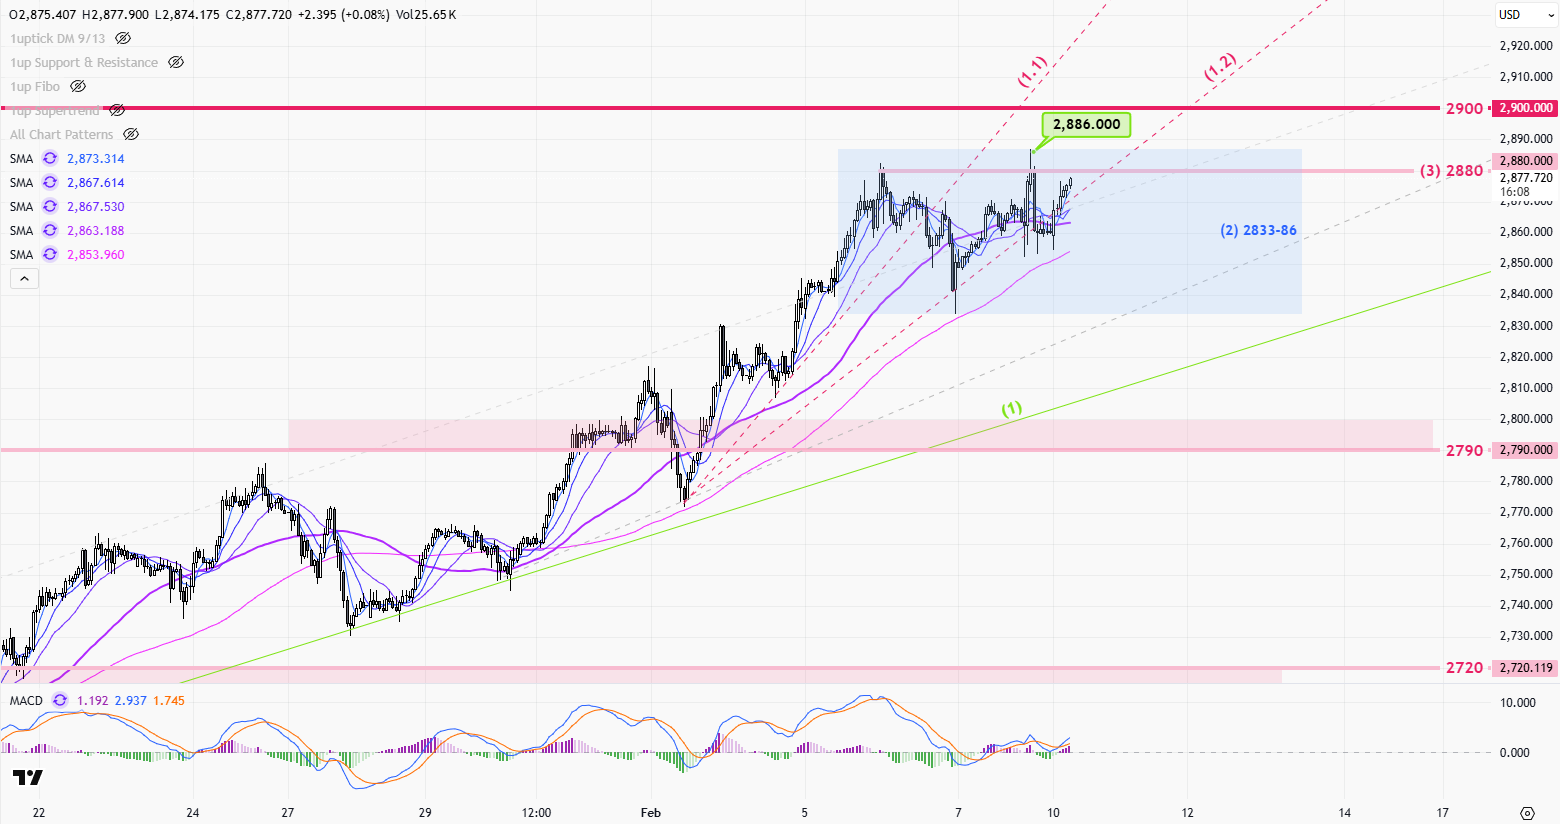
Triggered by Trump’s 25% tariffs on Canada and Mexico, Gold tested new highs last week. Although the tariffs were delayed for a month just hours after they were deployed, the news sent shockwaves to the market, pushing gold prices above last week’s highs early in the U.S. session on Monday. The upward momentum accelerated with the upward support accelerated from line (1) to (1.1), which rose to 2880 on Wednesday’s session. The market turned quiet as it waited for Friday’s US employment data, and the rally slowed slightly to (1.2). Although the Jan. non-farm jobs were smaller than expected, Friday’s U.S. data wasn’t bad at all, with the December figure being revised up to 300,000 and the latest unemployment rate revised down to 4.0% from 4.1% in the previous month. The pressure was on gold before the weekend.
The gold price continues to trade around its all-time high, hovering near 2880 with no signs of retreating. It is still imperative to keep an eye on the latest tariff policy developments in the United States and the responses of various countries. Fed Chairman Jerome Powell will have a hearing on Tuesday, and the US will release inflation data for January on Wednesday.
>
1-hour chart(above) > Although the upward trend slowed from (1.1) to (1.2) just before the weekend, there was no reversal signal in the 1-hour chart, and the price continued to stick to the all-time high of 2880. See if the price can break out from the resistance at 2880(3) in the next 12 hours, and if it fails to break up, the price will be sideway between 2833-86 early this week.
>
Daily Chart(above) > Gold prices temporarily showed S-T resistance at 2880, but the turnaround signal is still nowhere to be seen. An S-T long-entering point can be set at the 10-day moving average (4).
P. To
2025-02-03 @ 16:08
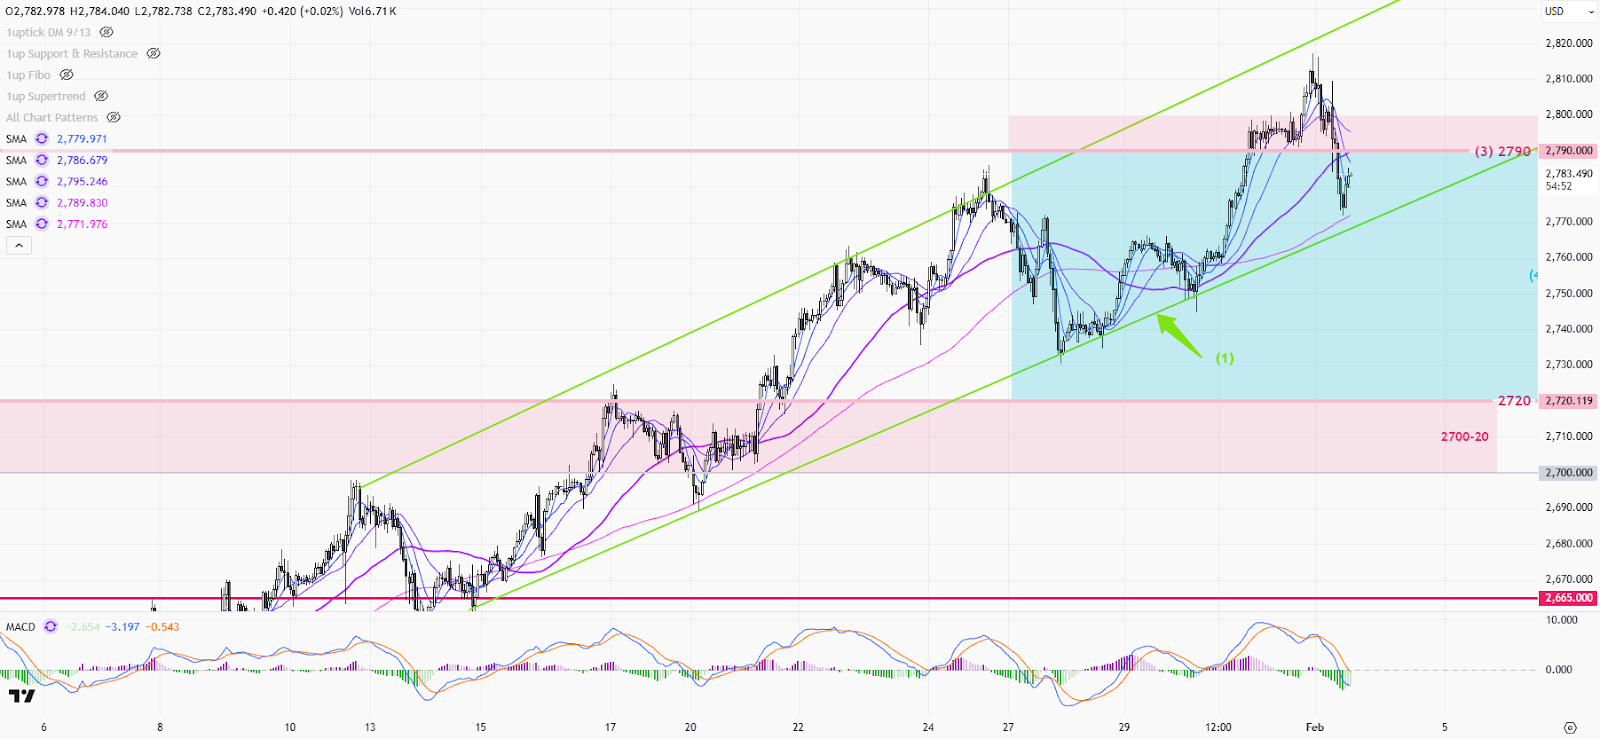
Following the decline from the previous week, the gold price tested the low near 2730 early last week. The market started to focus on the meetings of various central banks, 1st The Bank of Canada cut interest rates by 1/4%, followed by the Federal Reserve keeping interest rates unchanged, and then the ECB cut interest rates by 1/4 percentage point, led the price to rebound. The decline in global interest rates attracted gold buying, causing the gold price to cross the high of 2790. Driven by Trump’s tariff policy, the risk premium surged before the weekend, pushing gold prices to hit a new high of 2,817 during the U.S. session on Friday. But the price fell back to close at 2798, the week was up by $28.
Due to the weekend risk premium, the gold price hit a record high of 2817 on Friday, but the strong US dollar on Monday put pressure on the gold price. Last week’s US GDP and PCE inflation data, both reflected that the US economy keeps going strong, along with the tariff policy introduced by Trump over the weekend has further raised inflation expectations. Interest rates will remain high in the S-T just like Powell declared after the Fed. meeting last week, and gold prices will face pressure on the fundamental side.
In COMEX, the number of open interest(OI) has fallen after it reached 59k contracts on January 24. When gold prices hit a new high last week, both the trading volume and OI have reduced, reflecting investors are cautious in long-buying at current levels. The focus this week will be Friday’s U.S. employment data, as long as the numbers remain strong, gold prices will be under pressure once again.
>
1-hour chart(above) > The resistance above 2790 is still strong as the gold price failed to stabilize above 2790 back from the weekend. However, gold prices are still in the S-T rising channel(1). The price action will change to sideway only if the price falls below the support line(1). Notice that the upper resistance area is now at 2790-2800(5).
>
Daily chart > Although there was a clear selling before the market closed last Friday, the reversal signal has not yet appeared. Gold is still running in an upward trend along with the 10-day ma(6), wait for it to break where the bear will kick in.
P. To