


 |
| Gold V.1.3.1 signal Telegram Channel (English) |

XAUUSD: Gold Faces Bearish Signal Near $4900 Resistance Amid Market Uncertainty
2026-04-14 @ 05:04
Over the past 24 to 48 hours, gold (XAUUSD) has experienced notable volatility. Starting from the closing price of $4739.28 on April 13, 2026, gold prices have been influenced significantly by geopolitical tensions. The latest market news reveals that gold hit a weekly low amid heightened geopolitical friction, yet a Swiss bank remains bullish on gold’s long-term outlook, forecasting a possible surge toward $6,000.
Reports highlighted a temporary ceasefire agreement between the US and Iran, which initially propelled gold prices up to nearly $4,850. However, renewed geopolitical uncertainty and fluctuating safe-haven demand caused prices to pull back, stalling near the critical $4,900 resistance level and resulting in a choppy trading pattern recently.
For the average investor, this underscores gold’s continuing role as a key safe-haven asset. Despite recent price dips and fluctuations, ongoing global uncertainties — especially geopolitical risks and inflationary pressures — keep gold attractive for risk diversification and wealth preservation. Investors might consider opportunistic buying amid volatility, as market experts like BNP Paribas advocate staying calm and confident in gold’s fundamental strength during turbulent times.
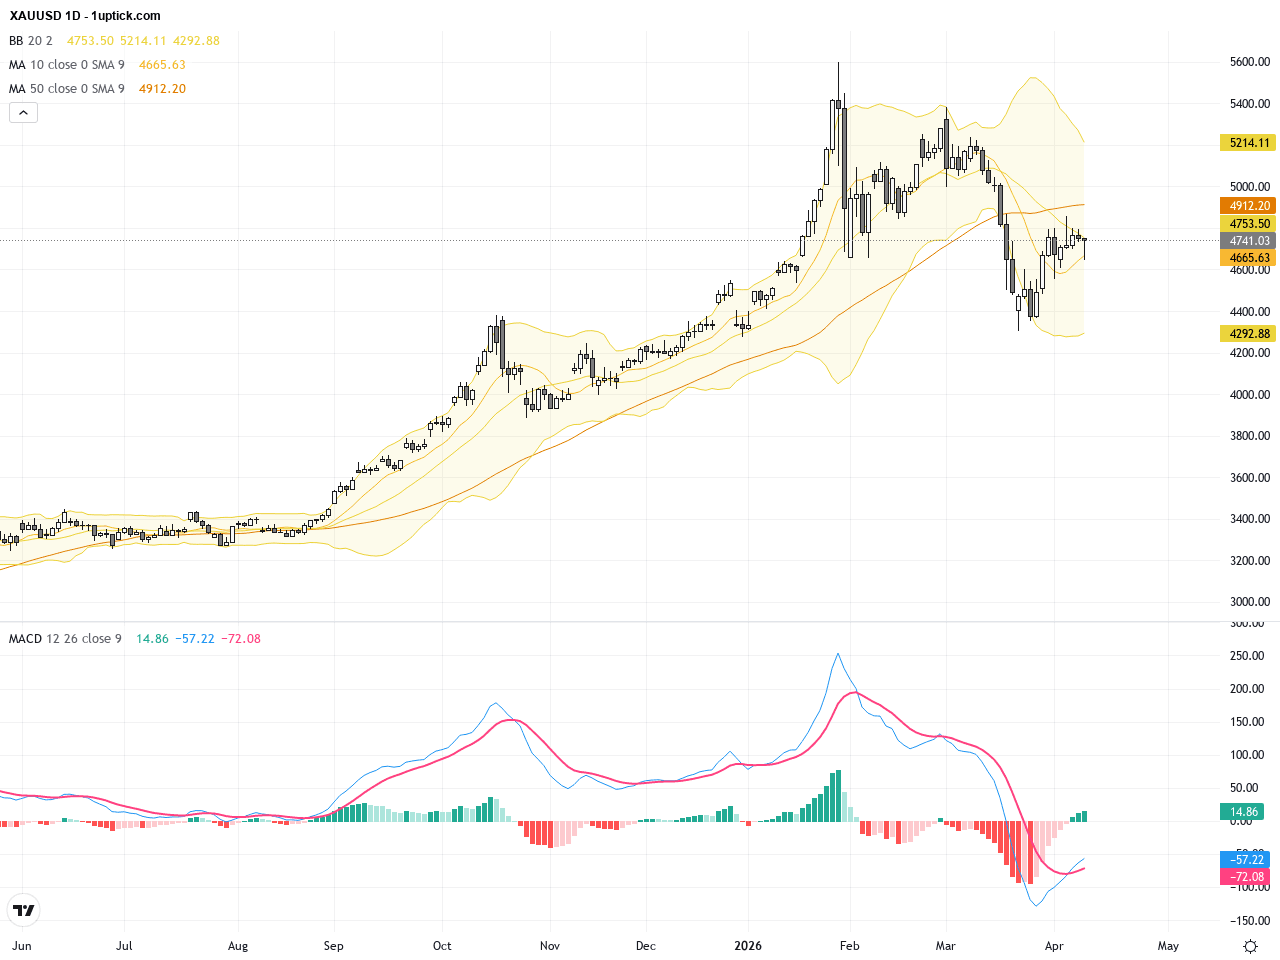
The daily chart shows XAUUSD in a clear phase of consolidation and correction recently. Price attempted to break above the critical $4900 resistance but was rejected, forming a prominent upper shadow indicating strong selling pressure. Moving averages are intertwined, reflecting indecision between bulls and bears, while Bollinger Bands narrow, suggesting reduced volatility ahead. The MACD is near a bearish crossover, signaling possible downside in the short term and a cautious overall trend.
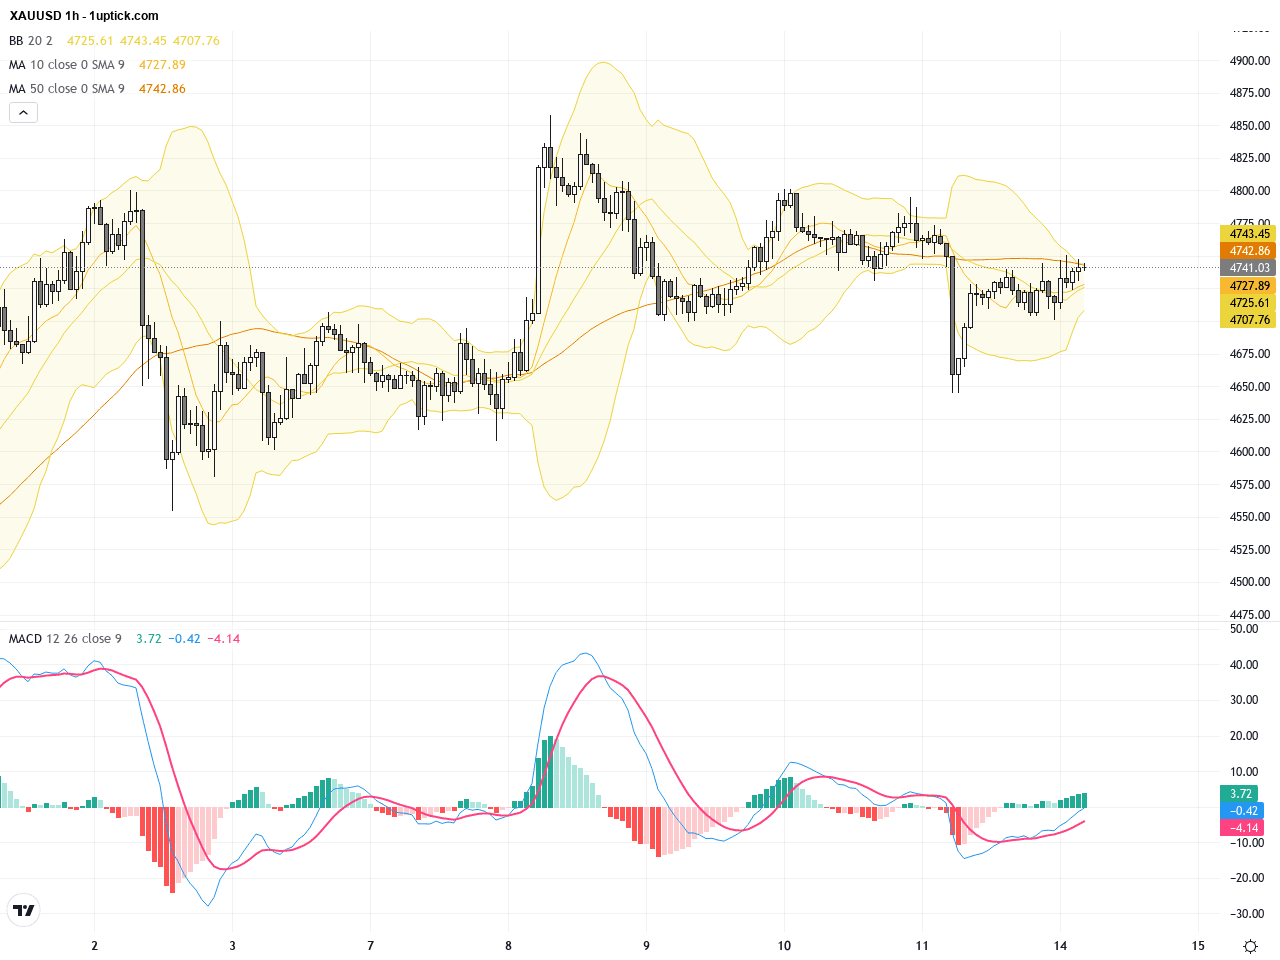
On the hourly chart, the past 3 to 5 days reveal a pronounced downtrend in XAUUSD. The price has tested and held above $4600 support multiple times, forming a short-term base. Bollinger Bands show price near the lower to middle band, and MACD divergence suggests weakening bearish momentum. Volume spikes indicate potential accumulation for a rebound. Watch for bullish reversal candlestick patterns like a golden cross or engulfing pattern in the next 24 hours for directional clues.
Technical Trend: XAUUSD is currently in a cautiously bearish downtrend, characterized by consolidating price action and subdued market sentiment.
Technically, the daily chart’s approaching MACD bearish crossover signals increased medium-term downside risk, while hourly chart MACD divergence and support near the Bollinger midline suggest potential short-term rebound. The repeated failure to break above $4900 resistance confirms strong selling interest at higher levels. The recent bearish engulfing candlestick on the daily timeframe warns of selling pressure ahead. Traders should be cautious and look to combine signals for strategic entries with protective stops.Today’s economic calendar in GMT+1 shows no major US data releases directly impacting XAUUSD. Some EU and Polish data may influence the euro and indirectly affect USD and gold prices. Meanwhile, Chinese new loans and M2 money supply data indicate liquidity tightening, possibly reducing short-term precious metals demand. Overall, no direct market-moving event for XAUUSD is expected today, which may result in continued range-bound trading.
Resistance & Support

The above financial market data, quotes, charts, statistics, exchange rates, news, research, analysis, buy or sell ratings, financial education, and other information are for reference only. Before making any trades based on this information, you should consult independent professional advice to verify pricing data or obtain more detailed market information. 1uptick.com should not be regarded as soliciting any subscriber or visitor to execute any trade. You are solely responsible for all of your own trading decisions.