



 |
| Gold V.1.3.1 signal Telegram Channel (English) |

AUDUSD: Key Technical Breakout as Aussie Hits Four-Year High Amid Market Rally
2026-04-20 @ 06:01
Over the past 24 to 48 hours, the Australian Dollar against the US Dollar (AUD/USD) experienced significant volatility, breaking above the 0.7200 level to hit a four-year high, with the previous day’s closing price at 0.71615. This surge was primarily fueled by rising hopes of peace between the US and Iran, which diminished the war risk premium and boosted risk sentiment.
Moreover, China’s Q1 GDP exceeded expectations at 5.0%, reinforcing confidence in Australian export demand and providing strong support for the Aussie. Additionally, Australia’s labor market remained robust, with unemployment steady at 4.3%, keeping the Reserve Bank of Australia (RBA) hawkish and preserving the yield advantage of the Aussie versus other currencies.
For the average investor, the easing of geopolitical tensions reduces demand for the safe-haven US Dollar, benefiting risk-linked currencies like the AUD. Meanwhile, China’s solid economic performance bolsters demand expectations for commodities, further underpinning the AUD. Together, these fundamentals have offered strong support and propelled the AUD/USD higher amid recent market swings.
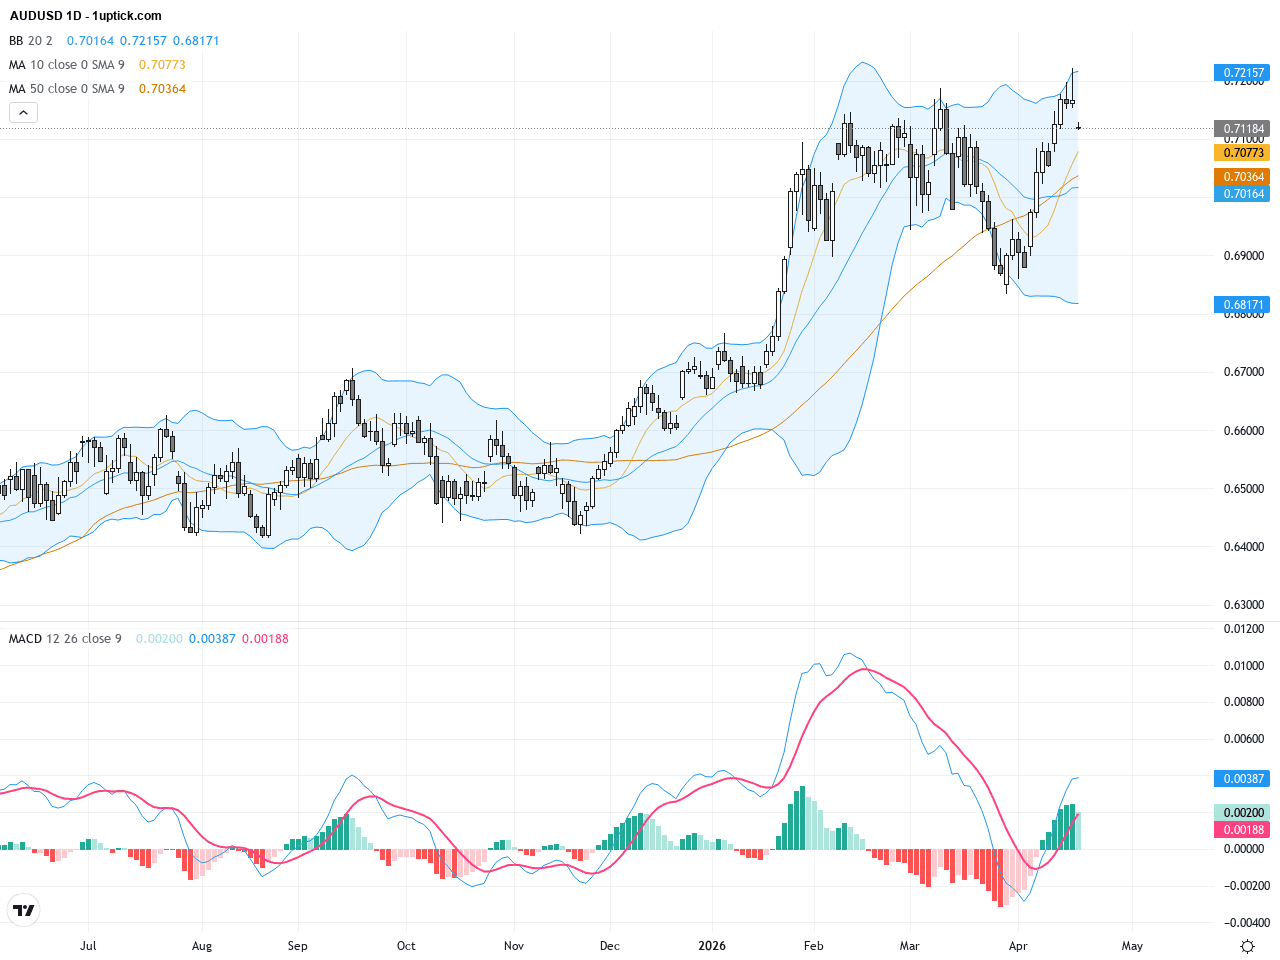
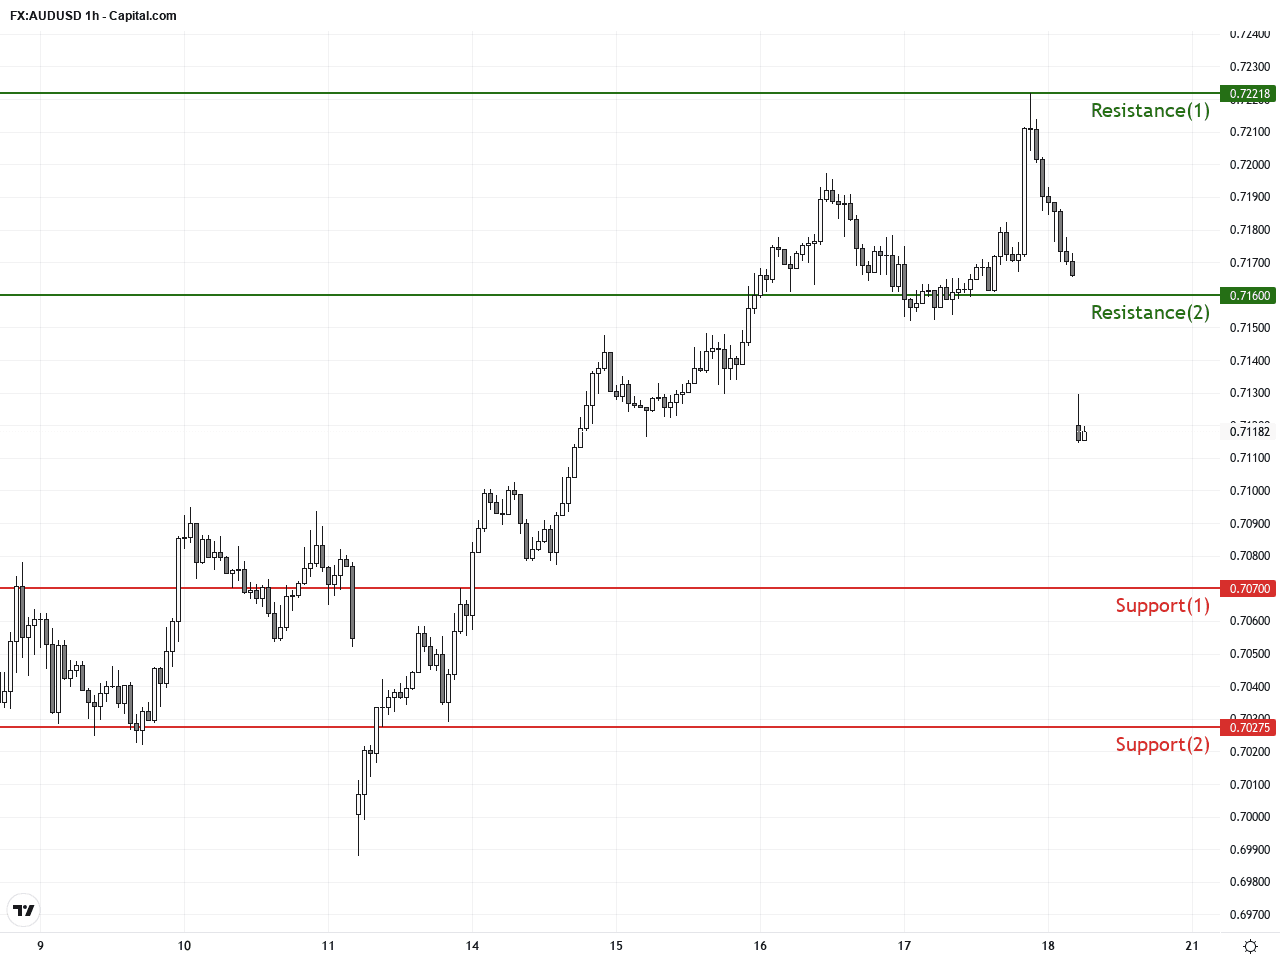
The daily chart reveals a clear bullish trend for AUDUSD, with the price consistently trading above the 50-day (0.70275) and 200-day (0.67494) moving averages, confirming strong medium-to-long term buying interest. After breaking above the 0.7160 resistance, the pair experienced a brief consolidation forming a flag pattern. Bollinger Bands expand, indicating increased volatility, while the MACD histogram is growing with the fast line above the slow line, signaling strong bullish momentum. Overall, the daily chart supports continued upside potential in the near term.
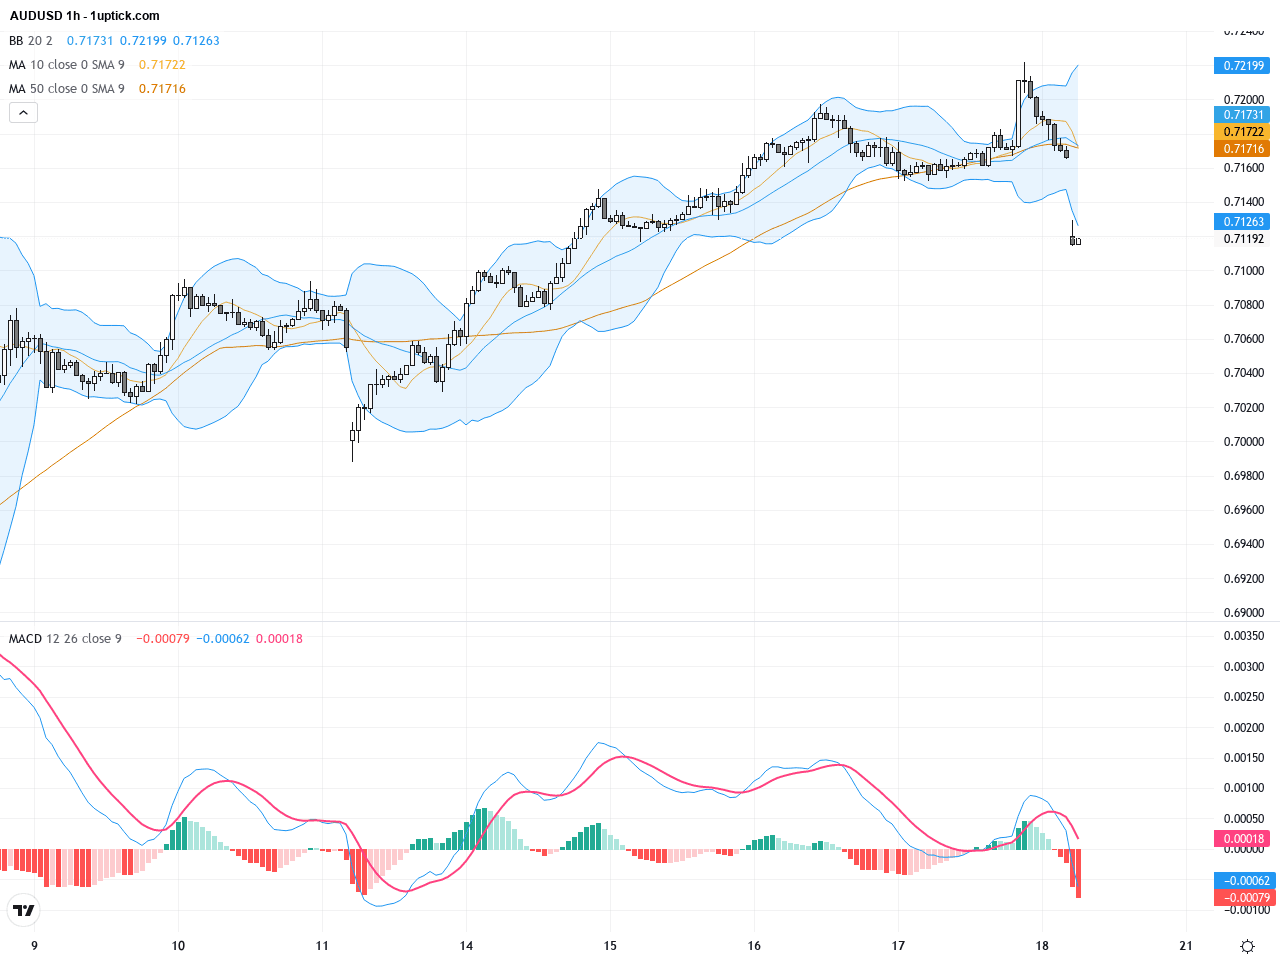
Hourly chart analysis over the past 3-5 days shows AUDUSD tightly squeezed between 0.6980 and 0.7070. Recent candlesticks formed a Morning Star pattern, indicating a short-term bullish reversal. The Bollinger Bands are slightly contracting but beginning to open, suggesting a breakout could be imminent in either direction. The MACD lines are nearing a bullish crossover, hinting at strengthening upward momentum. Short-term moving averages are trending up, supporting a favorable environment for buyers and possible short-term entries on dips.
Technical Trend: Trend Direction: Decisively Bullish, with price maintaining a strong upward trajectory above multiple moving averages.
Technically, AUDUSD is currently in a bullish flag consolidation within an established uptrend, with strong potential for an upside breakout. Daily MACD momentum is robust, and prices remain above key moving averages, favoring a long bias. The recent Morning Star candlestick on the hourly chart combined with an approaching MACD bullish crossover signals possible short-term momentum gain. Support levels remain firm, limiting downside risk. Altogether, these factors point toward a high-probability buying opportunity in the near term.There are no significant or directly relevant economic events scheduled today that would impact AUDUSD trading. Investors should focus on geopolitical developments and overall market sentiment for trading cues, while watching for volatility during major market open hours.
Resistance & Support
The above financial market data, quotes, charts, statistics, exchange rates, news, research, analysis, buy or sell ratings, financial education, and other information are for reference only. Before making any trades based on this information, you should consult independent professional advice to verify pricing data or obtain more detailed market information. 1uptick.com should not be regarded as soliciting any subscriber or visitor to execute any trade. You are solely responsible for all of your own trading decisions.