 |
| Gold V.1.3.1 signal Telegram Channel (English) |

WTI Crude Oil: Key Technical Patterns Emerge Amid Strait of Hormuz Shipping Slowdown, June 30, 2026
2026-06-30 @ 06:03
Over the past 24 to 48 hours, WTI crude oil has experienced notable volatility, rising from yesterday’s closing price of $70.42 per barrel on June 29th to peak gains of around 1.78%. This price rally has been primarily driven by slowed tanker traffic through the Strait of Hormuz, a critical energy transit route globally, where any logistical delays immediately heighten supply risk and market anxiety.
In addition, renewed military tensions between the U.S. and Iran have sustained bullish sentiment. Despite a recent ceasefire agreement to halt attacks, ongoing skirmishes and troop movements have kept investors wary about stability in the Middle East supply corridor. The resumption of Iraqi oil shipments through the Strait signals a partial easing of geopolitical pressures, yet uncertainties remain pervasive.
For average investors, this underscores how closely energy prices can respond to geopolitical developments and regional security issues, which in turn impact energy-linked portfolios. Staying attuned to such market news and supply chain factors is crucial for managing risks and capitalizing on shifts in the energy market landscape.
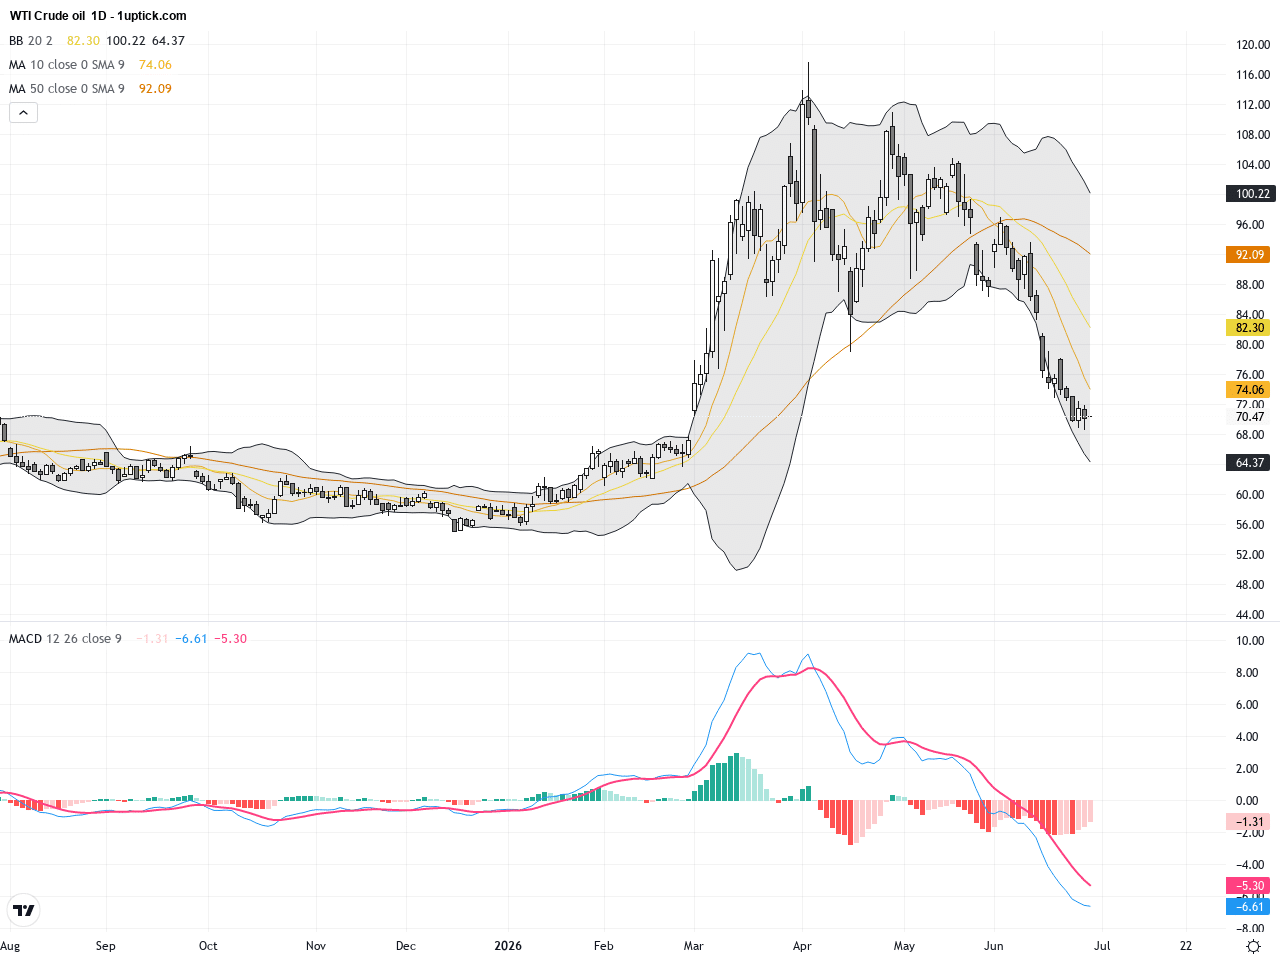
The daily chart shows WTI Crude in a consolidating phase after a significant downtrend from mid-June highs around $93.53 to near $70 currently. Price levels find support near the $70 mark with moving averages flattening out. Bollinger Bands are narrowing, indicating reduced volatility, while MACD hovers near the zero line, suggesting consolidation but preparing for a potential breakout. The long-term trend still reflects downward pressures, but short-term bullish rebounds linked to supply fears remain in play.
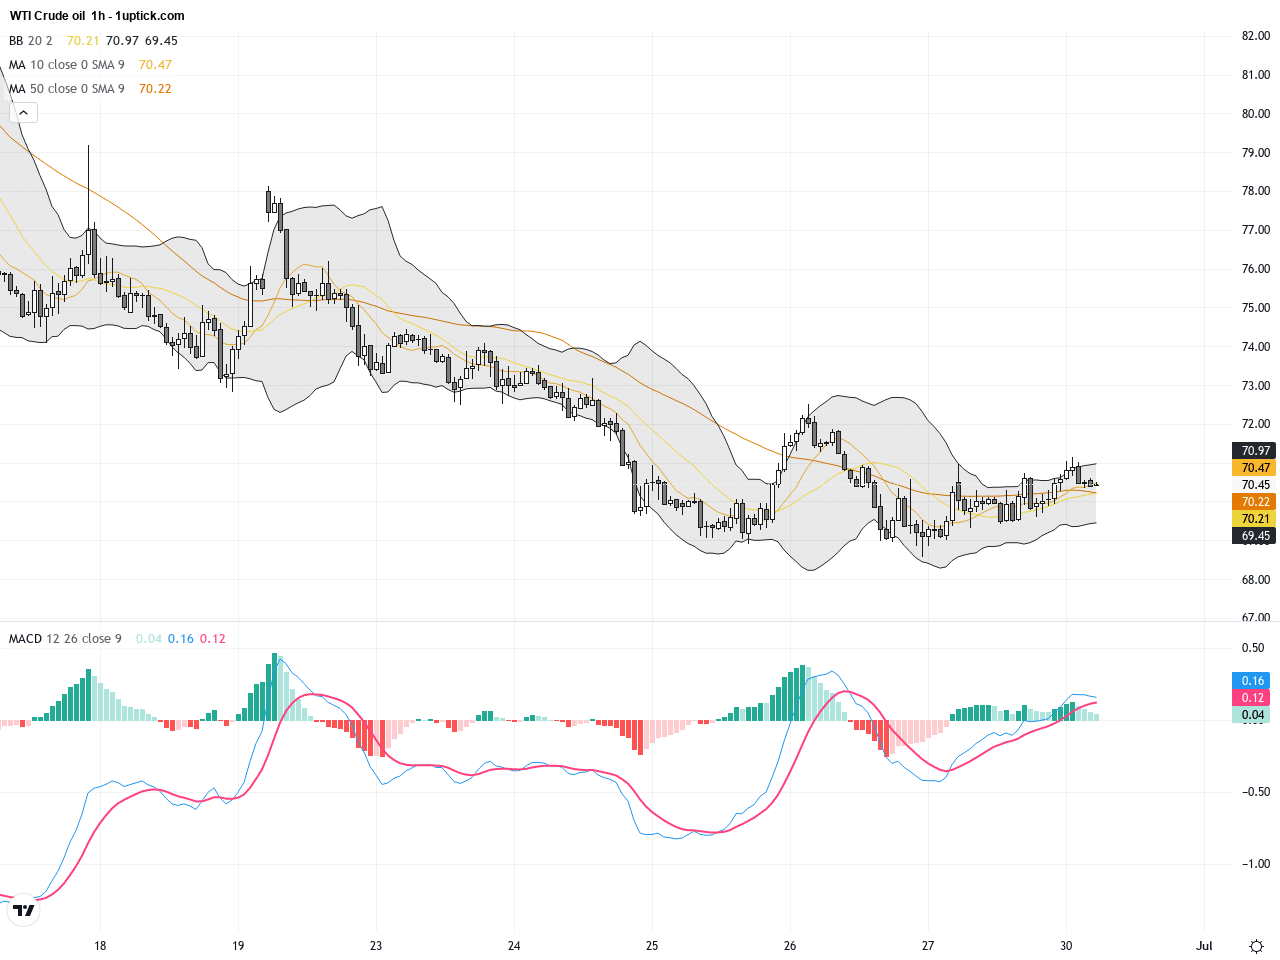
On the hourly chart over the past 3-5 days, WTI prices formed an ascending flag pattern, rising from about $69 towards $71. Bollinger Band width is slightly expanding, with price testing the upper band multiple times — a sign of increasing short-term bullish momentum. MACD recently crossed bullishly, with RSI holding near 60, supporting a continuation of the upward move. A bullish engulfing candlestick formed last night, highlighting potential sustained gains over the next 24 hours.
Technical Trend: WTI Crude Oil is currently in a cautiously bullish consolidation with signs pointing to a mild upward trend in the short term, though the longer-term outlook remains slightly bearish.
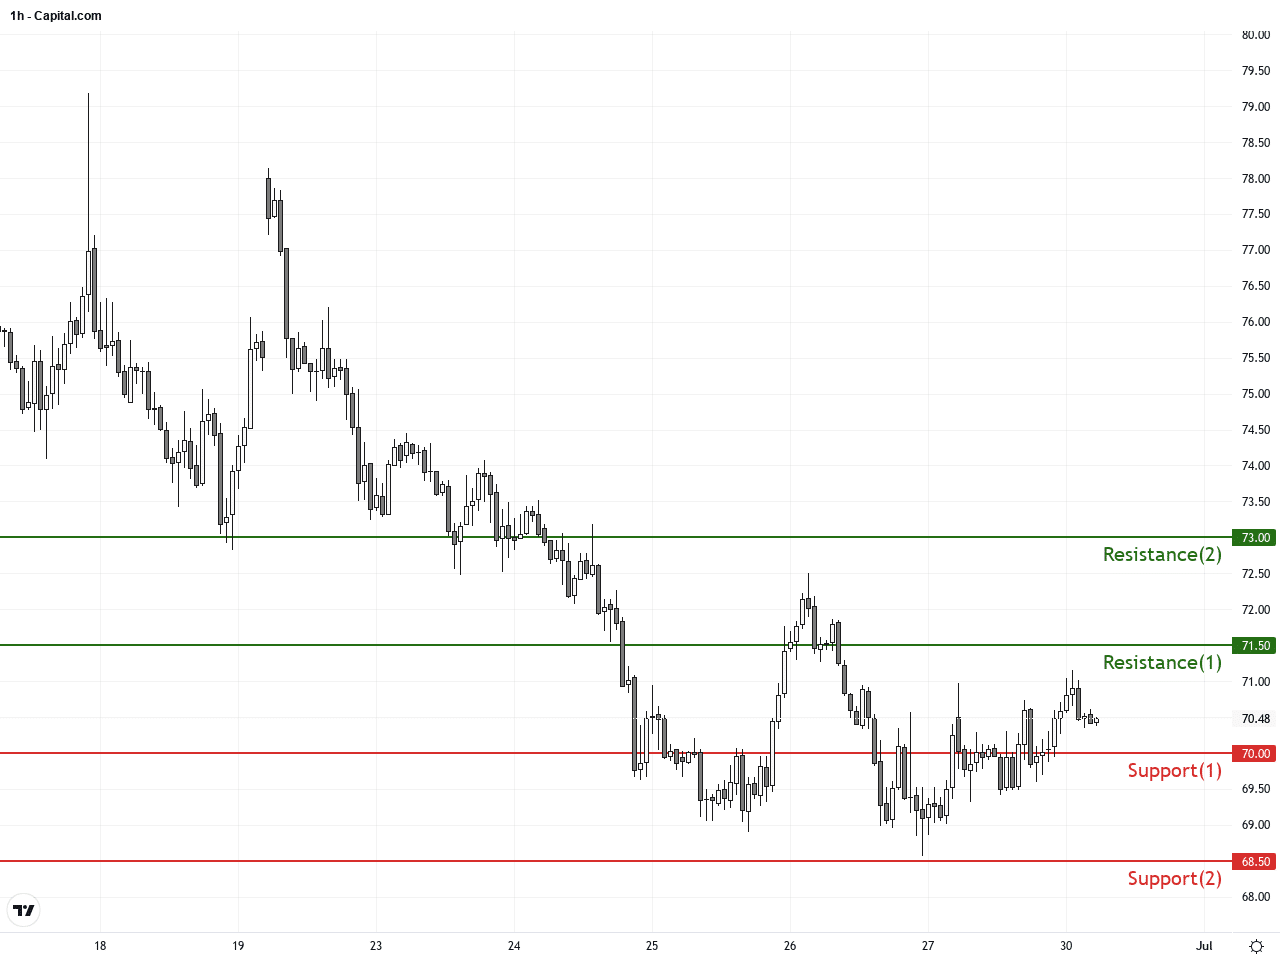
The market is transitioning from a longer-term downtrend into a consolidation phase with cautious bullish momentum. Technical signals such as the MACD bullish crossover and the recent bullish engulfing candlestick indicate strengthening buying interest. The key support at $70 is critical; a decisive break above the flag pattern resistance near $71.5 could trigger a strong upward move. Traders should remain cautious of sudden geopolitical news which could quickly reverse sentiment.There are no significant or directly relevant economic events today that would impact WTI Crude Oil prices. Given WTI’s sensitivity primarily lies in global supply-demand and geopolitical developments, economic data releases today are unlikely to shift prices materially.
Resistance & Support
Run Live WTI Crude Oil Analysis
The above financial market data, quotes, charts, statistics, exchange rates, news, research, analysis, buy or sell ratings, financial education, and other information are for reference only. Before making any trades based on this information, you should consult independent professional advice to verify pricing data or obtain more detailed market information. 1uptick.com should not be regarded as soliciting any subscriber or visitor to execute any trade. You are solely responsible for all of your own trading decisions.