


 |
| Gold V.1.3.1 signal Telegram Channel (English) |
XAUUSD Technical & Fundamental Analysis: Key Support Emerges Amid Fed-Rate Hike Risks, July 3, 2026
2026-07-03 @ 05:04
Over the past 24 to 48 hours, gold prices (XAUUSD) have experienced significant volatility, edging slightly higher from the closing price of $4119.345 on July 2, reflecting investors’ heightened sensitivity to movements in the precious metals market. Gold’s recent performance has been driven by multiple factors, including a push toward all-time highs in 2026 and rising expectations of Federal Reserve interest rate hikes.
Recent market news indicates that since late 2023 to early 2024, gold’s price behavior has begun diverging from traditional trends, signaling the onset of a new bullish cycle. Nonetheless, the Fed’s continued hawkish stance on raising rates has increased downside risk for gold prices. Deutsche Bank has notably cut its gold price forecasts, warning that if rates climb further, prices could fall to around $3,800.
For the average investor, this means gold’s allure as a safe-haven asset is being tested. While gold currently stands at new highs supported by inflation concerns and geopolitical risks, strong U.S. employment data and rate hike expectations are contributing to price swings. Investors considering gold exposure must closely monitor Federal Reserve policy shifts and global economic developments to adjust strategies and manage volatility risks effectively.

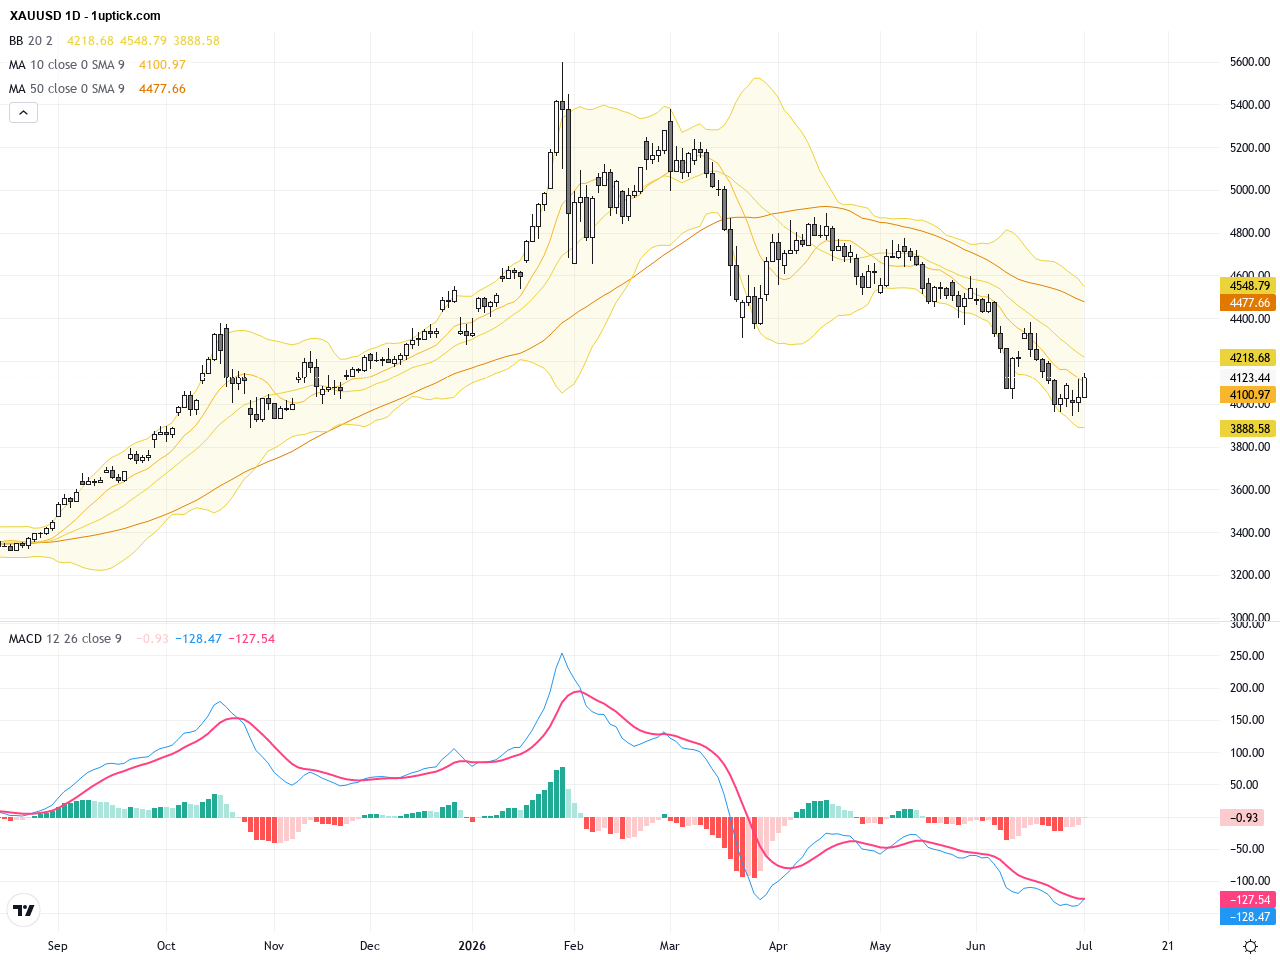
The daily chart for XAUUSD shows an upward corrective trend since late June, with price oscillating between 3950 and 4140. Higher lows have formed after multiple retracements, signaling strengthening bullish momentum. Bollinger Bands are showing a recent breakthrough above the middle band, and MACD indicates renewed bullish momentum. Moving averages (20 and 50 days) have flattened and are beginning to tilt upward, reinforcing the emerging uptrend. A notable inverse head and shoulders pattern is developing near key resistance levels, suggesting a potential breakout. Overall, the daily chart suggests a healthy recovery and consolidation within an uptrend.
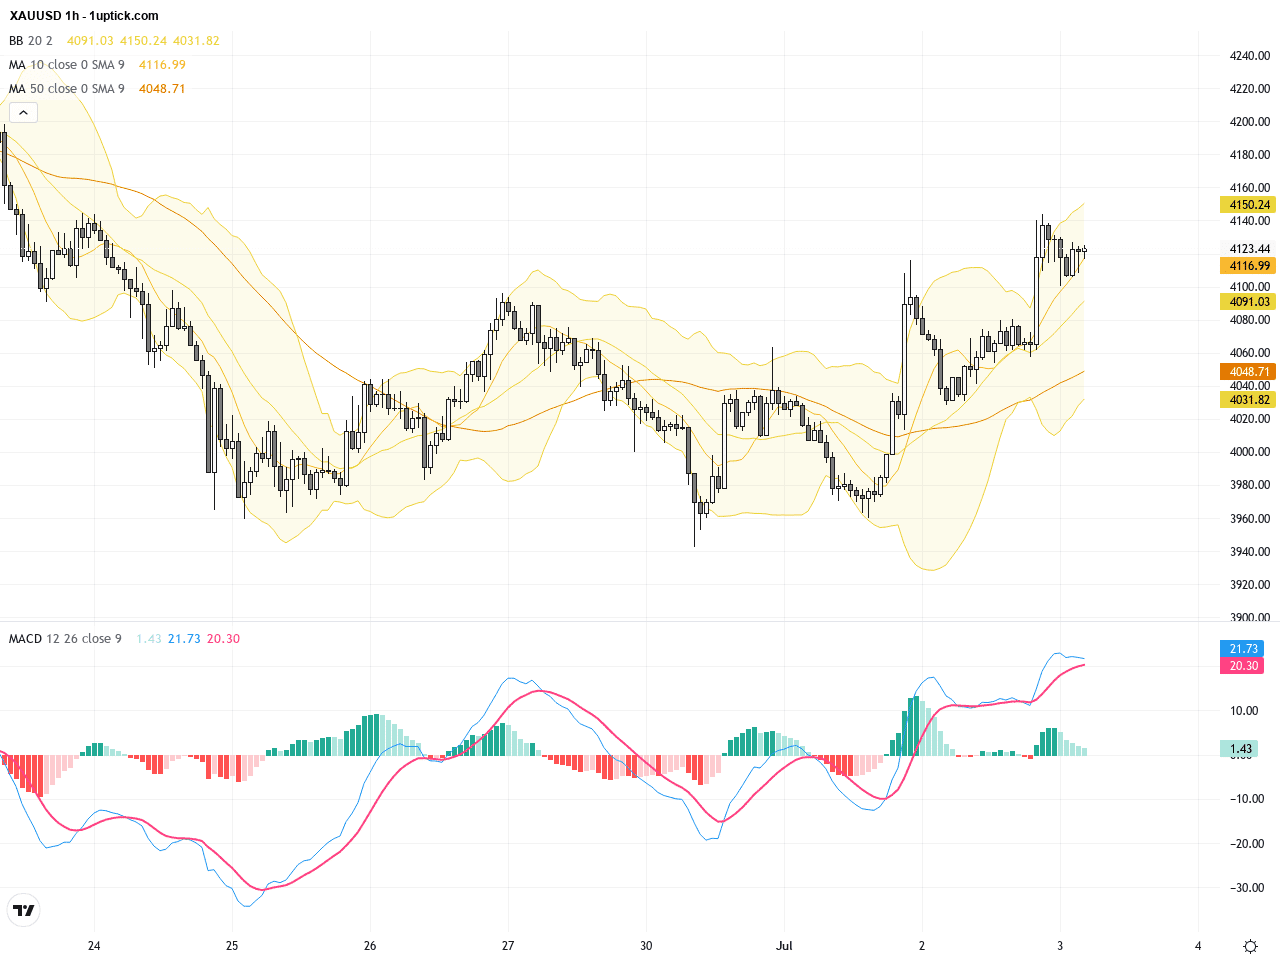
On the hourly timeframe, XAUUSD has been range-bound between 4070 and 4120 over the past 3-5 days. Short-term moving averages and Bollinger Bands signify reduced volatility as the market awaits a breakout. A MACD bullish crossover near the zero line and RSI around 55 suggest gathering short-term bullish momentum. A recent bullish engulfing candlestick pattern points to strengthening buyers, setting the stage for a possible test of the 4120 resistance. A confirmed breakout above this level could pave the way for further gains in the near term.
Technical Trend: Currently, XAUUSD is in a cautiously bullish consolidation phase, showing signs of recovery while facing resistance at key levels; overall trend is mildly upward with intermittent sideways action.
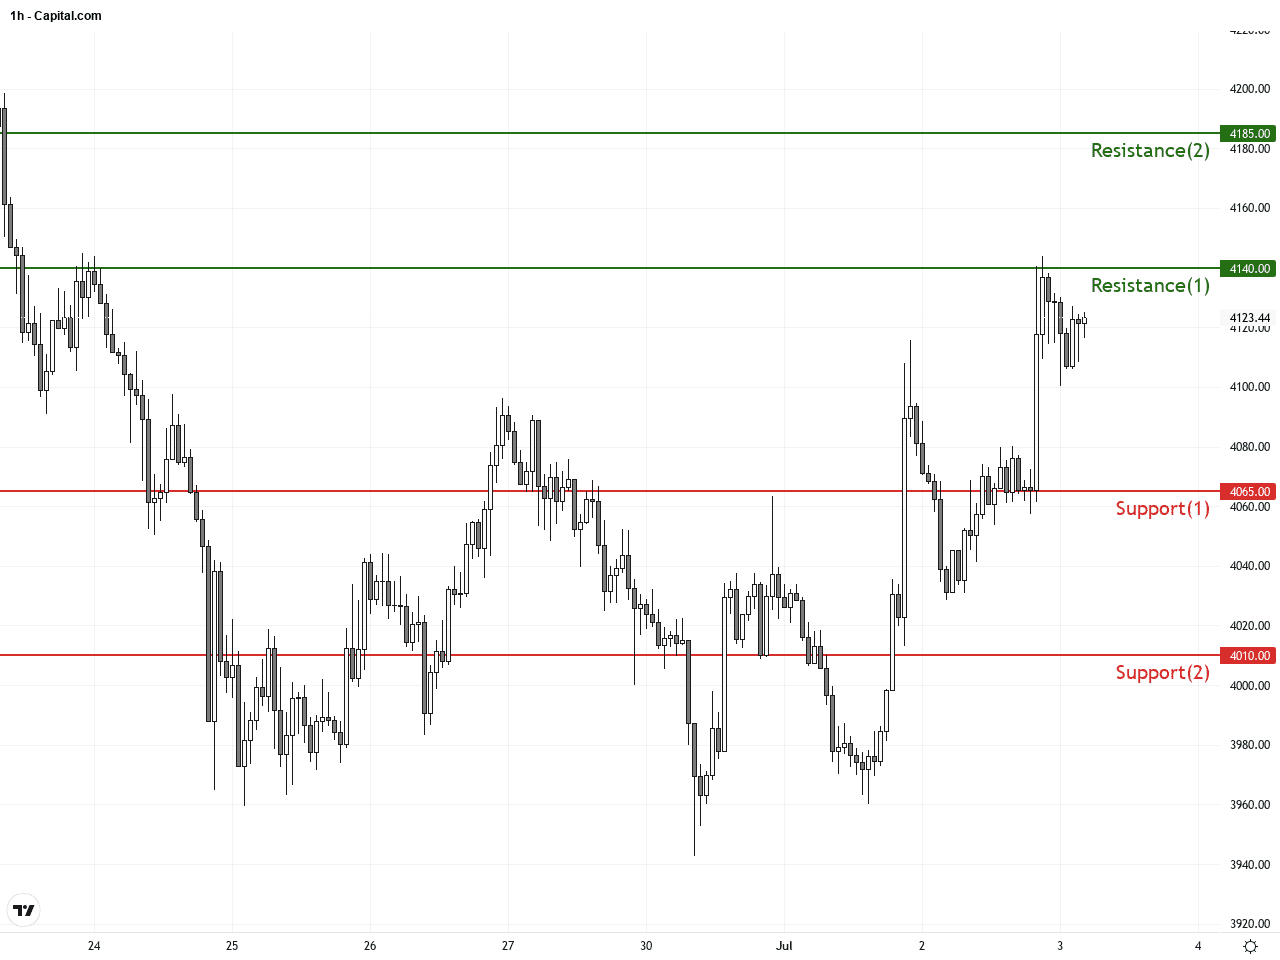
Technically, the daily chart’s developing inverse head and shoulders pattern signals a potential bullish reversal upon neckline breakout. On the hourly chart, recent bullish engulfing candles combined with a MACD golden cross and rising Bollinger Band midline suggest short-term buying pressure. Key resistance between 4120 and 4140 is crucial; a breakout supported by volume would confirm a strong upward move. Traders should also monitor US employment data outcomes, as stronger-than-expected numbers could induce volatility and possible pullbacks. Strategic position adjustments near critical levels are recommended to manage risk and capitalize on momentum shifts.Today’s economic calendar features several key US data releases at 14:30 GMT+1, including June Non-Farm Employment Change, Unemployment Rate, and Average Hourly Earnings. Recently, non-farm payrolls grew by only 57K, significantly below the expected 110K, while unemployment improved from 4.3% to 4.2%. If the upcoming employment data also disappoints, it will likely support gold prices due to easing Fed rate hike expectations. Conversely, strong data would favor the USD and potentially pressure gold. Other events like the Australian Trade Balance and EU Unemployment Rate have limited direct impact on XAUUSD today. Traders should watch closely for market reactions around the US data releases.
Resistance & Support
The above financial market data, quotes, charts, statistics, exchange rates, news, research, analysis, buy or sell ratings, financial education, and other information are for reference only. Before making any trades based on this information, you should consult independent professional advice to verify pricing data or obtain more detailed market information. 1uptick.com should not be regarded as soliciting any subscriber or visitor to execute any trade. You are solely responsible for all of your own trading decisions.